. 2019 Nov 11;12(11):dmm041228.
doi: 10.1242/dmm.041228.

Harnessing region-specific neurovascular signaling to promote germinal matrix vessel maturation and hemorrhage prevention

Affiliations

Harnessing region-specific neurovascular signaling to promote germinal matrix vessel maturation and hemorrhage prevention

Devi Santhosh et al. Dis Model Mech. .

Abstract

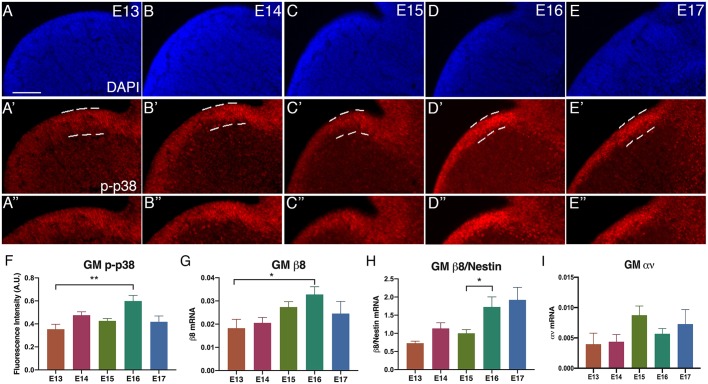
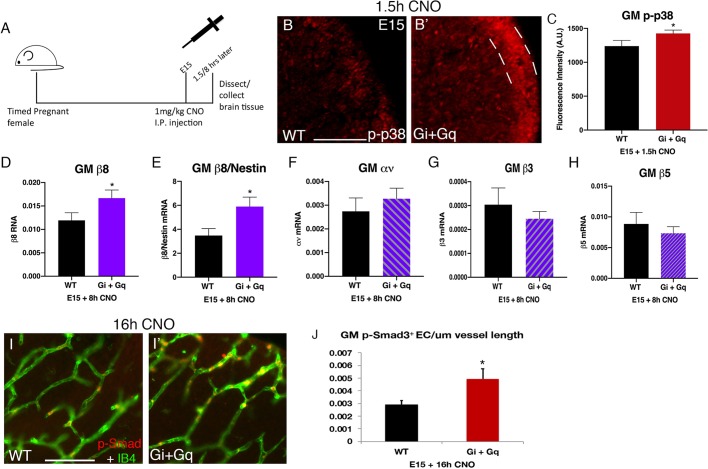
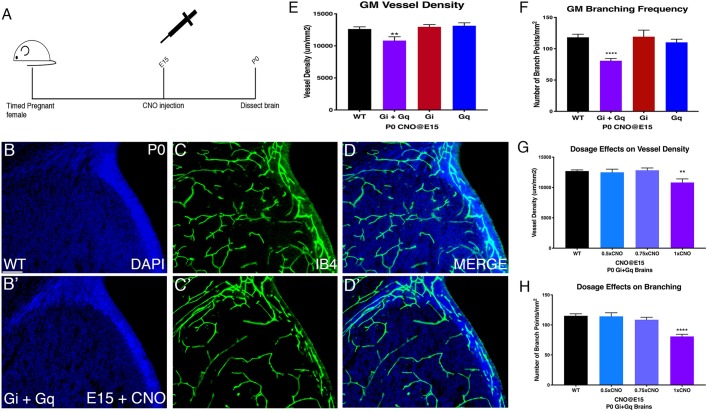
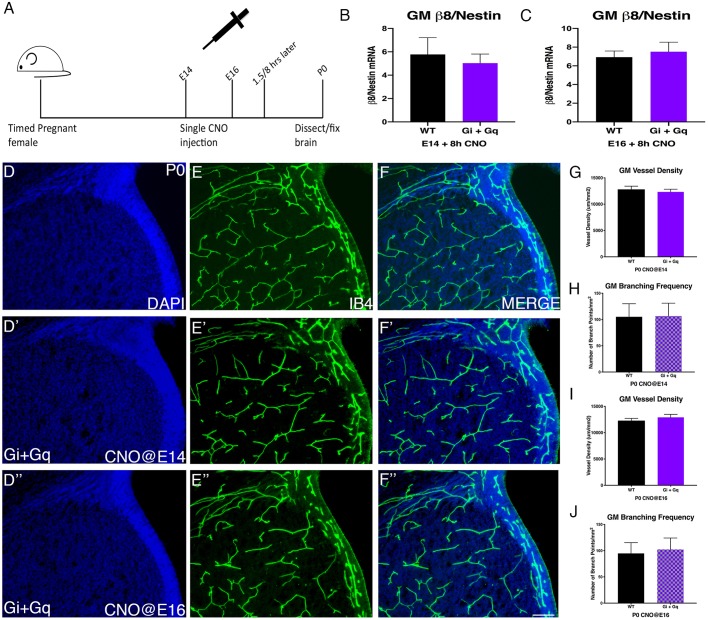
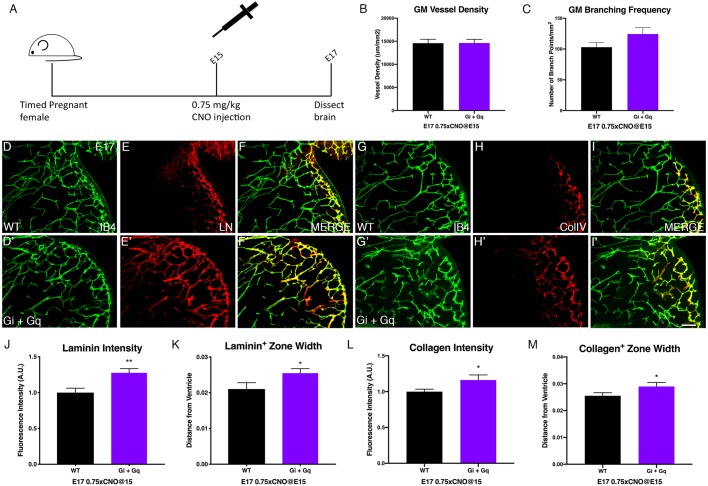
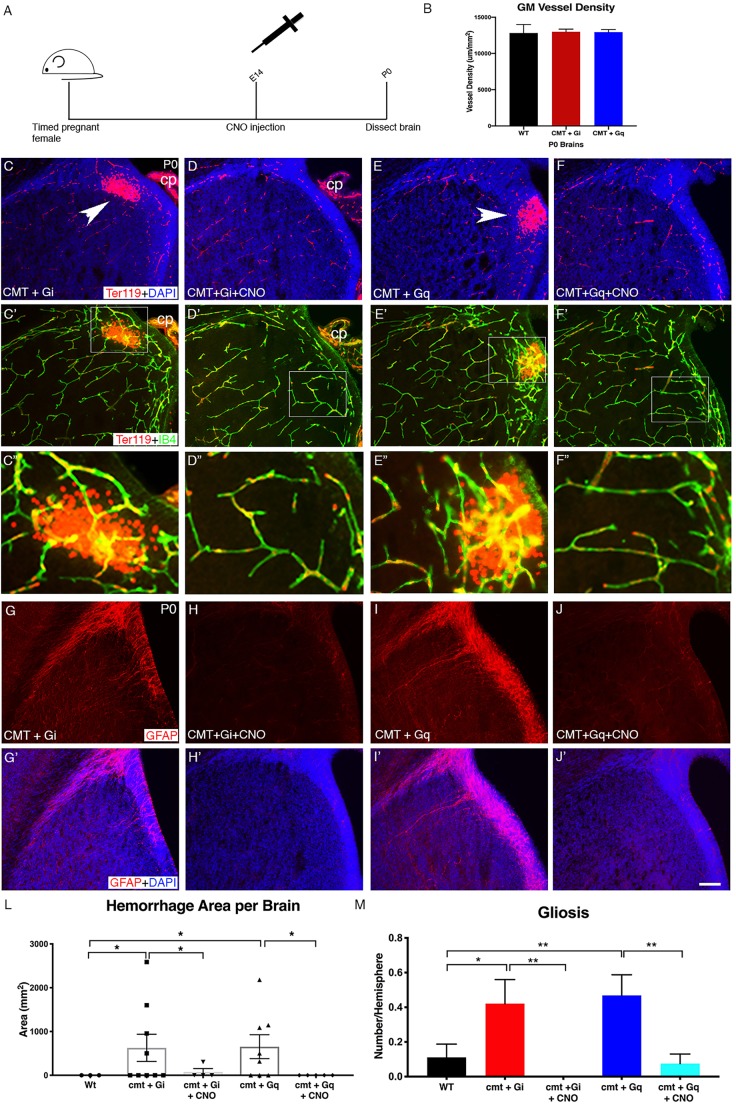
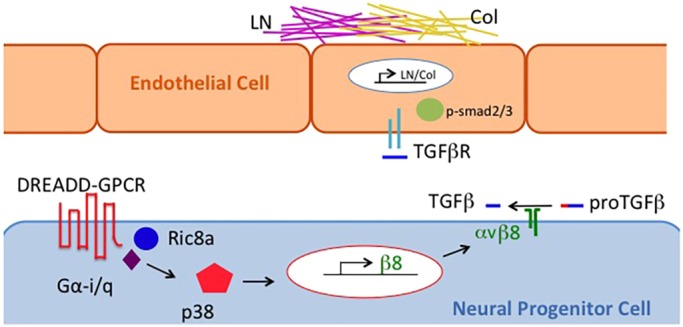
Germinal matrix hemorrhage (GMH), affecting about 1 in 300 births, is a major perinatal disease with lifelong neurological consequences. Yet despite advances in neonatal medicine, there is no effective intervention. GMH is characterized by localized bleeding in the germinal matrix (GM), due to inherent vessel fragility unique to this developing brain region. Studies have shown that reduced TGFβ signaling contributes to this vascular immaturity. We have previously shown that a region-specific G-protein-coupled receptor pathway in GM neural progenitor cells regulates integrin β8, a limiting activator of pro-TGFβ. In this study, we use mice to test whether this regional pathway can be harnessed for GMH intervention. We first examined the endogenous dynamics of this pathway and found that it displays specific patterns of activation. We then investigated the functional effects of altering these dynamics by chemogenetics and found that there is a narrow developmental window during which this pathway is amenable to manipulation. Although high-level activity in this time window interferes with vessel growth, moderate enhancement promotes vessel maturation without compromising growth. Furthermore, we found that enhancing the activity of this pathway in a mouse model rescues all GMH phenotypes. Altogether, these results demonstrate that enhancing neurovascular signaling through pharmacological targeting of this pathway may be a viable approach for tissue-specific GMH intervention. They also demonstrate that timing and level are likely two major factors crucial for success. These findings thus provide critical new insights into both brain neurovascular biology and the intervention of GMH.

Keywords: Brain neurovascular biology; Germinal matrix hemorrhage; Mouse model; TGFβ signaling.


Conflict of interest statement

Competing interestsThe authors declare no competing or financial interests.

Figures

Fig. 1.
Fig. 1.
Endogenous GPCR-integrin β8 signaling dynamics in the GM during development. (A-E) DAPI images of GM from E13-E17. (A′-E′) Phospho-p38 (p-p38) staining of GM from E13-E17 in the ventricular zone (VZ, dashed lines). (A″-E″) Cropped images of phospho-p38 in the VZ. (F) Quantification of immunofluorescence of phospho-p38 staining (E13: n=9; E14: n=17; E15: n=18; E16: n=9; E17: n=11; **P=0.001). (G) q-PCR of integrin β8 gene expression from E13 to E17 in the GM (E13: n=5; E14: n=7; E15: n=6; E16: n=8; E17: n=5; *P=0.041). (H) Integrin β8 gene expression normalized to nestin gene expression for each embryonic stage (*P=0.020). (I) q-PCR of integrin αν gene expression from E13 to E17 (E13: n=8; E14: n=6; E15: n=6; E16: n=4; E17: n=6). Data are mean±s.e.m. ANOVA was used for statistical analyses. Scale bar: 100 µm.
Fig. 2.
Fig. 2.
DREADD activation at E15 specifically induces GPCR-integrin β8 pathway in the GM. (A) Schematic of experiment showing IP injection of 1 mg/kg of CNO at E15 and tissue collection time points for analysis. (B,B′) Phospho-p38 (p-p38) staining in the ventricular zone (VZ) of the GM 1.5 h after CNO injection at E15 in wild-type (B) and Gi+Gq (B′) brains. Dashed lines indicate the VZ region quantified. (C) Quantification of phospho-p38 staining in B (WT+CNO: n=9; Gi+Gq+CNO: n=10; *P=0.03). (D) q-PCR of integrin β8 gene expression 8 h after CNO injection at E15 in wild-type and Gi+Gq brains (WT+CNO: n=12; Gi+Gq+CNO: n=8; *P=0.03). (E) q-PCR of integrin β8 gene expression normalized to nestin 8 h after CNO injection at E15 in wild-type and Gi+Gq brains (*P=0.01). (F-H) q-PCR of integrin αν (F), β3 (G) and β5 (H) gene expression 8 h after CNO injection at E15 in wild-type and Gi+Gq brains (WT+CNO and Gi+Gq+CNO: n=6; all P>0.1). (I,I′) Phospho-Smad3 staining along vessels in the GM 16 h after CNO injection at E15 in wild-type (I) and Gi+Gq (I′) brains. (J) Quantification of phospho-Smad3 staining in I (WT+CNO: n=9; Gi+Gq+CNO: n=11; P=0.016). Data are mean±s.e.m. One-way Welch's t-test was used for statistical analyses. Scale bars: 100 µm.
Fig. 3.
Fig. 3.
GM vessel morphology is altered at P0 after E15 maximum CNO injection only in Gi+Gq brains. (A) Schematic of experiment showing IP injection at E15 and analyzing vessel morphology at P0. (B,B′) DAPI staining of GM of wild-type (B) and Gi+Gq (B′) P0 brains after CNO injection at E15. (C,C′) IB4 staining of GM vessels in wild-type (C) and Gi+Gq (C′) P0 brains after CNO injection at E15. (D,D′) DAPI and IB4 merged images. (E,F) Quantification of vessel density (WT+CNO: n=21; Gi+Gq+CNO: n=13; Gi+CNO n=10; Gq+CNO: n=12; **P=0.009) (E) and branching frequency (WT+CNO: n=21; Gi+Gq+CNO: n=13; Gi+CNO n=10; Gq+CNO: n=12; ****P<0.0001) (F) in GM in wild-type, Gi+Gq, Gi alone and Gq alone brains after 1 mg/kg CNO injection at E15. (G,H) Quantification of vessel density (WT+CNO: n=53; 0.5×CNO: n=10; 0.75×CNO: n=17; 1×CNO: n=13; **P=0.0011) (G) and branching frequency (WT+CNO: n=39; 0.5×CNO: n=10; 0.75×CNO n=31; 1×CNO: n=13; ****P<0.0001) (H) in wild-type and Gi+Gq brains after a single injection of 0.5, 0.75 or 1 mg/kg of CNO at E15. Data are mean±s.e.m. ANOVA was used for statistical analyses. Scale bar: 100 µm.
Fig. 4.
Fig. 4.
Activation of DREADDs at E14 or E16 does not alter vessel morphology or integrin β8 expression in the GM. (A) Schematic of experiment showing single IP injection of 1 mg/kg of CNO at either E14 or E16 and then the tissue collection time points for analysis. (B-C) q-PCR of integrin β8 gene expression 8 h after CNO injection at E14. (WT+CNO: n=6; Gi+Gq+CNO: n=6) (B) or at E16.5 (WT+CNO: n=5; Gi+Gq+CNO: n=5) (C). (D-D″) DAPI staining of GM of wild-type or Gi+Gq P0 brains after CNO injection at E14 (D′) or E16 (D″). (E-E″) IB4 staining of GM vessels in wild-type or Gi+Gq P0 brains after CNO injection at E14 (E′) or E16 (E″). (F-F″) Merge of DAPI and IB4 staining wild-type or Gi+Gq P0 brains after CNO injection at E14 (F′) or E16 (F″). (G-H) Quantification of GM vessel density (WT+CNO: n=10; Gi+Gq+CNO: n=16) (G) and branching frequency (WT+CNO: n=10; Gi+Gq+CNO: n=16) (H) after CNO injection at E14 in wild-type or Gi+Gq P0 brains. (I-J) Quantification of GM vessel density (WT+CNO: n=13; Gi+Gq+CNO: n=18) (I) and branching frequency (WT+CNO: n=13; Gi+Gq+CNO: n=18) (J) after CNO injection at E16 in wild-type or Gi+Gq P0 brains. Data are mean±s.e.m. One-way Welch's t-test was used for statistical analyses. Scale bar: 100 µm.
Fig. 5.
Fig. 5.
Moderate dose of CNO injection at E15 enhances vessel maturity in the GM. (A) Schematic of experiment showing single IP injection of 0.75 mg/kg of CNO at E15 and tissue collection at E17. (B,C) Quantification of vessel density (WT+CNO: n=8; Gi+Gq+CNO: n=11) (B) and branching frequency (WT+CNO: n=8; Gi+Gq+CNO: n=11) (C) in wild-type and Gi+Gq E17 brains after 0.75 mg/kg CNO injection at E15. (D,D′,G,G′) IB4 staining of GM vessels in wild-type (D,G) and Gi+Gq (D′,G′) E17 brains after CNO injection at E15. (E,E′) Laminin (LN) staining of GM in wild-type (E) and Gi+Gq (E′) E17 brains after CNO injection at E15. (F,F′) Merged image of IB4 and laminin from D,D′ and E,E′. (H,H′) Collagen IV staining of GM in wild-type (H) and Gi+Gq (H′) E17 brains after CNO injection at E15. (I,I′) Merged image of IB4 and collagen IV staining from G,G′ and H,H′. (J,K) Quantification of laminin fluorescence intensity (WT+CNO: n=13; Gi+Gq+CNO: n=11; **P=0.0036) (J) and staining positive zone (WT+CNO: n=13; Gi+Gq+CNO: n=14; *P=0.027) (K) in GM of wild-type and Gi+Gq E17 brains after CNO injection at E15. (L,M) Quantification of collagen IV fluorescence intensity (WT+CNO: n=17; Gi+Gq+CNO: n=17; *P=0.025) (L) and staining positive zone (WT+CNO: n=18; Gi+Gq+CNO: n=17; *P=0.038) (M) in GM of wild-type and Gi+Gq E17 brains after CNO injection at E15. Data are mean±s.e.m. One-way Welch's t-test was used for statistical analyses. Scale bar: 100 µm.
Fig. 6.
Fig. 6.
DREADD activation rescues mouse model of GMH. (A) Schematic of experiment showing CNO injection at E14 and analysis of brain tissue at P0. (B) Quantification of GM vessel density in wild-type, compound mutant CMT+Gi and CMT+Gq brains at P0 without CNO injection (WT: n=5; CMT+Gi: n=30; CMT+Gq: n=27). (C-F) Ter119 (red blood cell) and DAPI staining of GM in CMT+Gi (C) and CMT+Gq (E) P0 brains without CNO injection and GM after CNO injection in CMT+Gi (D) and CMT+Gq (F) P0 brains. Arrowheads indicate hemorrhage. (C′-F′) Ter119 and IB4 staining of GM in CMT+Gi (C′) and CMT+Gq (E′) P0 brains without CNO injection and GM after CNO injection in CMT+Gi (D′) and CMT+Gq (F′) P0 brains. (C″-F″) Magnification of boxed areas in C′-F′, respectively. Ter119-positive red blood cells can be clearly observed outside IB4-positive blood vessels in C″ and E″. (G-J) GFAP staining of GM in CMT+Gi (G) and CMT+Gq (I) P0 brains without CNO injection and GM after CNO injection in CMT+Gi (H) and CMT+Gq (J) P0 brains. (G′-J′) GFAP and DAPI staining of GM in CMT+Gi (G′) and CMT+Gq (I′) P0 brains without CNO injection and GM after CNO injection in CMT+Gi (H′) and CMT+Gq (J′) P0 brains. (L) Quantification of Ter119 staining in GM at P0 (CMT+Gi: n=9, P=0.038; CMT+Gq: n=8, P=0.024; CMT+Gi +CNO: n=4, P=0.038; CMT+Gq+CNO: n=5; P=0.024). (M) Quantification of GFAP staining in GM of P0 (CMT+Gi: n=19, P=0.03; CMT+Gq: n=32, P=0.007; CMT+Gi +CNO: n=15, P=0.0036; CMT+Gq+CNO: n=40, P=0.0022). Data are mean± s.e.m. cp, choroid plexus. One-way Welch's t-test was used for statistical analyses. *P<0.05, **P<0.005. Scale bar: 100 µm.
Fig. 7.
Fig. 7.
Schematic diagram of DREADD-induced increases in basement membrane component deposition along blood vessels in the GM. Ligand binding to DREADDs in neural progenitor cells results in Gαi/q and subsequently p38 activation, which then induces integrin β8 gene transcription followed by integrin αvβ8-dependent latent pro-TGFβ cleavage and activation. TGFβ activation of receptors on endothelial cells in turn signals through phosphorylated smad2/3 to increase expression of laminin (LN) and collagen (Col) which leads to increased deposition of the basement membrane components and, as a result, improved blood vessel integrity.

References

    1. Alexander G. M., Rogan S. C., Abbas A. I., Armbruster B. N., Pei Y., Allen J. A., Nonneman R. J., Hartmann J., Moy S. S., Nicolelis M. A. et al. (2009). Remote control of neuronal activity in transgenic mice expressing evolved G protein-coupled receptors. Neuron 63, 27-39. 10.1016/j.neuron.2009.06.014 - DOI - PMC - PubMed
    1. Armbruster B. N., Li X., Pausch M. H., Herlitze S. and Roth B. L. (2007). Evolving the lock to fit the key to create a family of G protein-coupled receptors potently activated by an inert ligand. Proc. Natl. Acad. Sci. USA 104, 5163-5168. 10.1073/pnas.0700293104 - DOI - PMC - PubMed
    1. Bader B. L., Rayburn H., Crowley D. and Hynes R. O. (1998). Extensive vasculogenesis, angiogenesis, and organogenesis precede lethality in mice lacking all alpha v integrins. Cell 95, 507-519. 10.1016/S0092-8674(00)81618-9 - DOI - PubMed
    1. Ballabh P. (2014). Pathogenesis and prevention of intraventricular hemorrhage. Clin. Perinatol. 41, 47-67. 10.1016/j.clp.2013.09.007 - DOI - PMC - PubMed
    1. Ballabh P., Xu H., Hu F., Braun A., Smith K., Rivera A., Lou N., Ungvari Z., Goldman S. A., Csiszar A. et al. (2007). Angiogenic inhibition reduces germinal matrix hemorrhage. Nat. Med. 13, 477-485. 10.1038/nm1558 - DOI - PubMed

Publication types

MeSH terms