. 2019 Nov 1;33(21-22):1591-1612.
doi: 10.1101/gad.328971.119. Epub 2019 Oct 10.

Hi-C guided assemblies reveal conserved regulatory topologies on X and autosomes despite extensive genome shuffling

Affiliations

Hi-C guided assemblies reveal conserved regulatory topologies on X and autosomes despite extensive genome shuffling

Gina Renschler et al. Genes Dev. .

Abstract

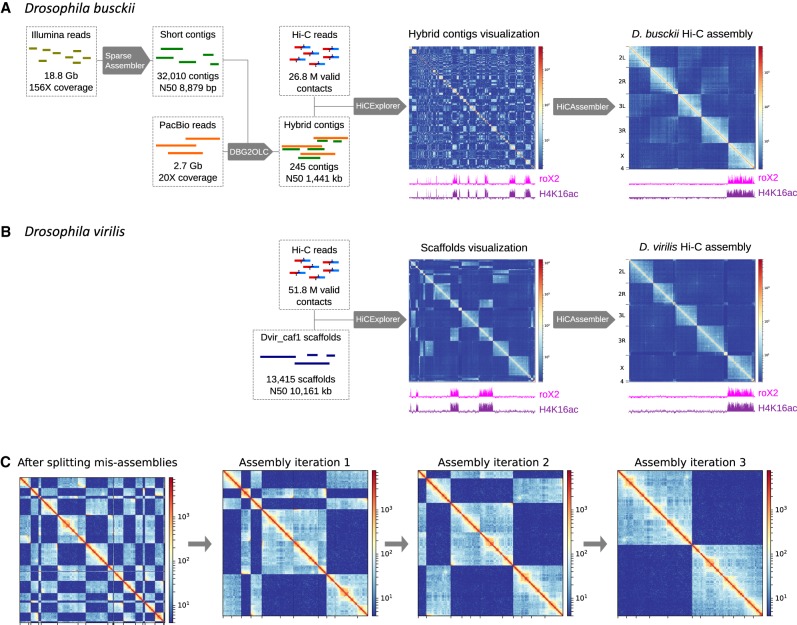
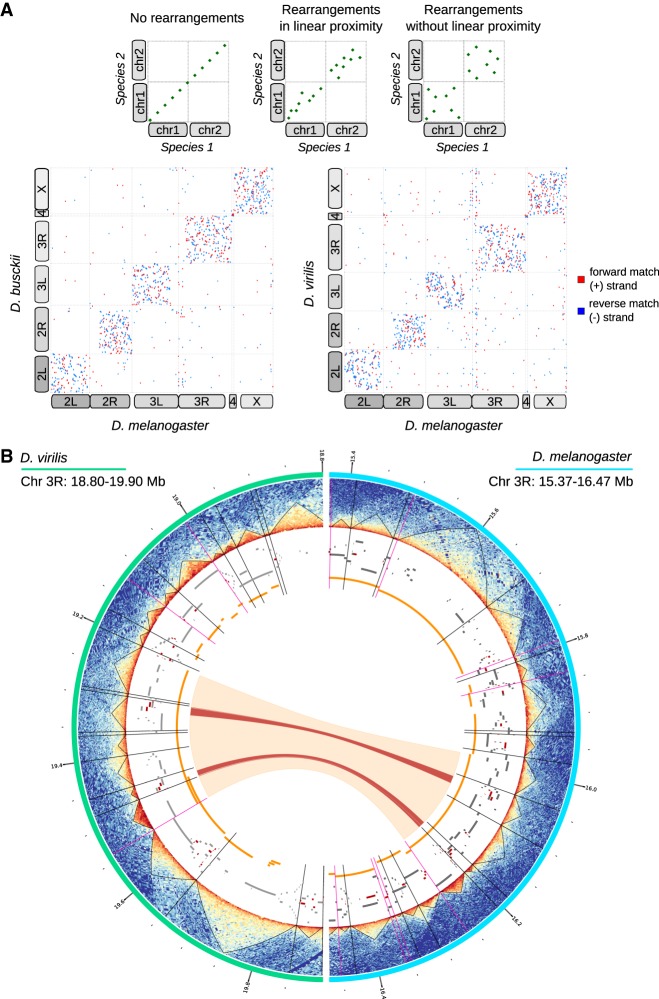
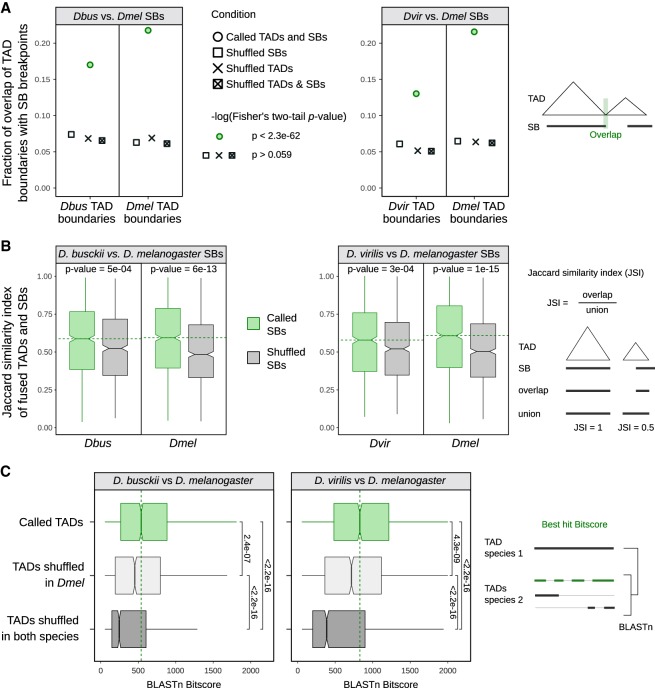
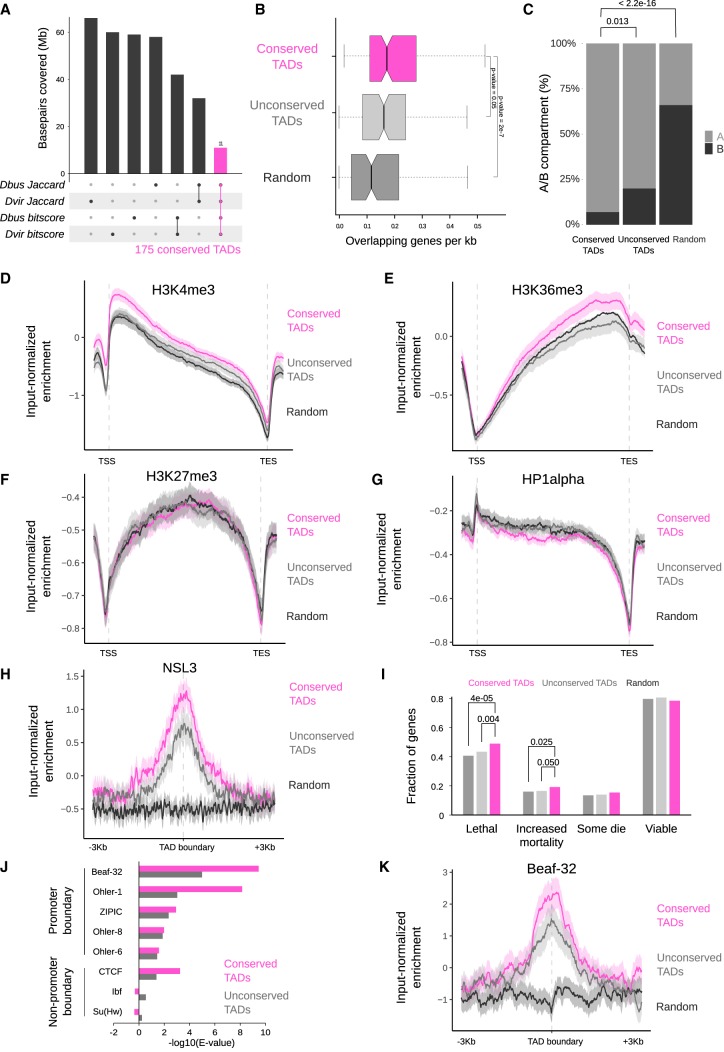
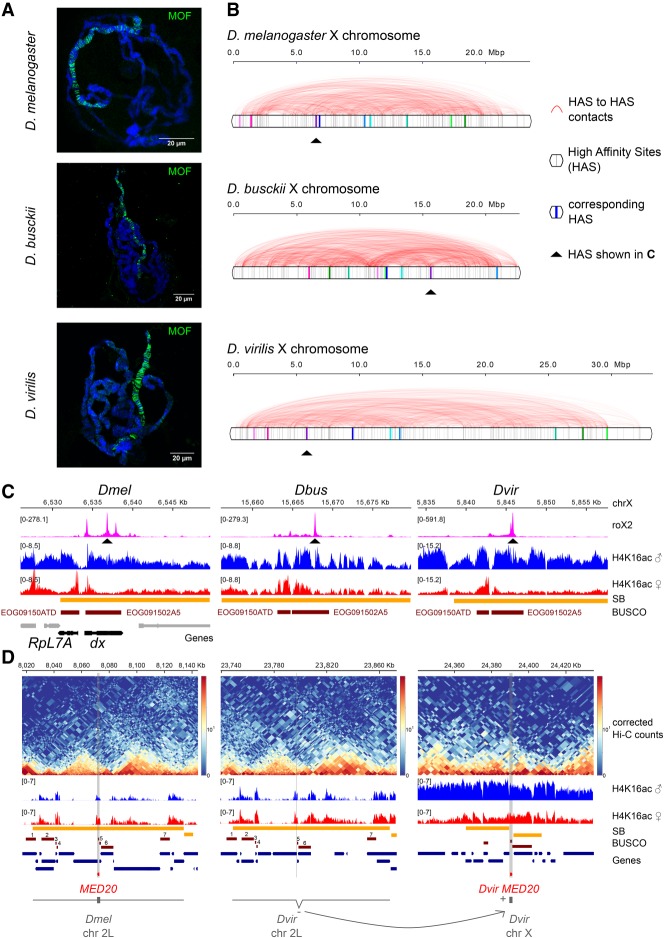
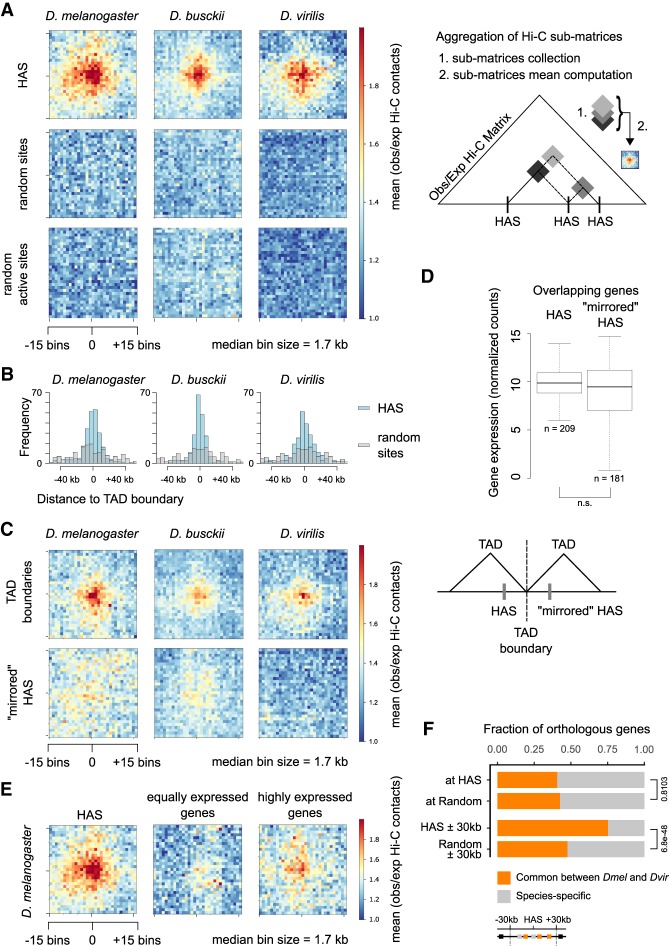
Genome rearrangements that occur during evolution impose major challenges on regulatory mechanisms that rely on three-dimensional genome architecture. Here, we developed a scaffolding algorithm and generated chromosome-length assemblies from Hi-C data for studying genome topology in three distantly related Drosophila species. We observe extensive genome shuffling between these species with one synteny breakpoint after approximately every six genes. A/B compartments, a set of large gene-dense topologically associating domains (TADs), and spatial contacts between high-affinity sites (HAS) located on the X chromosome are maintained over 40 million years, indicating architectural conservation at various hierarchies. Evolutionary conserved genes cluster in the vicinity of HAS, while HAS locations appear evolutionarily flexible, thus uncoupling functional requirement of dosage compensation from individual positions on the linear X chromosome. Therefore, 3D architecture is preserved even in scenarios of thousands of rearrangements highlighting its relevance for essential processes such as dosage compensation of the X chromosome.

Keywords: HiC; X chromosome; chromosome topology; dosage compensation.


Figures

Figure 1.
Figure 1.
Hi-C guided chromosome-length assemblies of D. busckii and D. virilis genomes. (A) De novo assembly of D. busckii genome. A hybrid approach integrating long PacBio reads and short contigs assembled from Illumina reads was used to obtain 245 de novo contigs of the D. busckii genome. Assembly of 156× Illumina reads using SparseAssembler (Ye et al. 2012) resulted in 32,010 short contigs. 20× PacBio data was integrated using DBG2OLC (Ye et al. 2016), which increased the N50 more than 100-fold. These 245 hybrid contigs were scaffolded into chromosome-length with Hi-C data using HiCAssembler. Integrity of the X chromosome (identified by whole-genome alignment to D. melanogaster) was validated using ChIRP-seq data of the dosage compensation complex member roX2 (Quinn et al. 2016) and ChIP-seq data of H4K16ac from male D. busckii larvae. (B) D. virilis Hi-C assembly. The existing reference scaffolds of D. virilis (Dvir_caf1 scaffolds) were assembled into full chromosomes using HiCAssembler. The enrichment of roX2 and H4K16ac (male) on one chromosome depicts full integrity of the assembled X chromosome. (C) Overview of HiCAssembler strategy (see Materials and Methods and Supplemental Fig. S3 for a complete description of the algorithm). The figure displays the iterative progression of the Hi-C assembly strategy as in Dudchenko et al. (2017) for a small example Hi-C matrix. First, the original scaffolds are split if they contain misassemblies and small scaffolds are removed. In each iteration of the Hi-C assembly algorithm scaffolds are joined and oriented to form larger and larger Hi-C scaffolds until chromosome-length assemblies are obtained as shown in the last panel where two separated blocks remain. Afterward, the small scaffolds that were initially removed are inserted into the Hi-C scaffolds.
Figure 2.
Figure 2.
Extensive genome shuffling during Drosophila evolution. (A, top) Hypothetical whole-genome alignments. If no rearrangements have occurred between two species, whole-genome alignments result in matches that perfectly align at the diagonal (left). If there was a link between linear proximity and synteny breakpoints, matches would be expected to converge near the diagonal (middle). If shuffling happens without linear proximity, matches would occur randomly throughout the whole-chromosome arms (right). (Bottom) Dotplots showing actual whole-genome alignments between D. melanogaster and D. busckii or D. virilis, respectively. Alignments were performed using Mummer4 (Marçais et al. 2018). Forward matches (+ strand) are shown in red; reverse matches (− strand) are displayed in blue. Corresponding chromosome arms are indicated with boxes that are displayed connected if chromosome arms are fused in one species. Karyotypes are additionally depicted in Supplemental Figure S2A. (B) Association between TAD boundaries and synteny block breakpoints. From the exterior to the interior of the Circos plot. (Turquoise) The 18.80–19.90 Mb region of the chromosome 3L in D. virilis, (light blue) the 15.37–16.47 Mb of the chromosome 3L in D. melanogaster, (heatmaps) Hi-C contact heatmaps with TADs displayed as black triangles, (black radial lines) TAD boundaries, (magenta radial lines) TAD boundaries overlapping with synteny block start or end sites, (gray blocks) genes, (red blocks) BUSCOs, (orange blocks) synteny blocks, (orange arc) conserved synteny block between D. virilis and D. melanogaster in the displayed regions, (red arcs) conserved BUSCOs in the displayed regions.
Figure 3.
Figure 3.
TAD boundaries correlate significantly with synteny block breakpoints. (A) Fraction of overlapping extended TAD boundaries with extended synteny block (SB) start and end sites in comparisons of D. busckii or D. virilis with D. melanogaster. The extension is 500 bp in both 5′ and 3′ direction. Overlap and −log10(P-value) is shown for boundaries of TADs (n = 2209, 2134, and 2127 in D. melanogaster, D. busckii, and D. virilis, respectively) and SB breakpoints (n = 3726 and 3252 in the D. melanogaster vs. D. virilis comparison, respectively, and 3340 and 2776 in the D. melanogaster vs. D. busckii comparison, respectively). Overlap with respective shuffled TADs, shuffled SBs, and both TADs and SBs shuffled as controls. A summary of significant and not significant −log10(P-value) of Fisher's two-tailed test is shown, the exact P-values are provided in Supplemental Table S3. Scheme illustrating the performed overlap analysis. (B) Jaccard similarity index of fused TADs and SBs or respective number of shuffled SBs for D. busckii and D. virilis compared with D. melanogaster. For calculating the Jaccard score, consecutive TADs were fused if a SB overlapped the adjacent TAD by 20% or more (see Materials and Methods). The shuffling of SBs is the same as in A. The median of called SBs is shown as a green dotted line. P-values of two-sided Wilcoxon rank-sum tests are displayed. Scheme illustrating the calculation of the Jaccard similarity index. (C) Bitscores of interspecies TAD alignments using BLASTn. TAD to TAD comparisons are displayed in green, TADs shuffled in D. melanogaster in light gray, and TADs shuffled in both species in dark gray. Shuffling is the same as in A. The median of called TADs is displayed as a green dotted line, and significance was calculated by two-sided Wilcoxon rank-sum test comparisons between the bitscore distributions. All P-values are displayed and significant by using a 0.05 P-value threshold. Scheme illustrating the BLASTn strategy of whole TADs between two species and the associated bitscore of the best hit.
Figure 4.
Figure 4.
Evolutionary conserved TADs are active gene-rich regions comprising essential genes and are demarcated by conserved boundary motifs. (A) Definition of conserved TADs between D. busckii, D. virilis, and D. melanogaster. TADs with Jaccard similarity index above the median from D. melanogaster versus D. busckii and D. melanogaster versus D. virilis comparisons were overlapped. Respective overlap of TADs were performed using the bitscores. Afterward, TADs found in both analyses were compared and the intersect was defined as conserved TADs. Barplots represent the base-pair coverage of each subset in the D. melanogaster genome. (B) Conserved TADs are gene-dense. Genes overlapping with conserved TADs (pink), unconserved TADs (gray), and random genomic regions (dark gray) expressed in number of genes per kilobase. Equal length of overlapping genes is displayed in Supplemental Figure S6B as a control. Wilcoxon rank-sum test P-values are displayed for comparisons with conserved TADs. (C) Percentage of conserved TADs, unconserved TADs, and random regions that lie completely in the active (A) or inactive (B) compartment (n = 101, 101, 92). P-values were obtained using a two-sided two-proportions z-test. (DG) Conserved TADs compared to unconserved TADs are significantly enriched in the H3K4me3 (D) and H3K36me3 histone marks (E), but are not enriched in H3K27me3 (F) or HP1α (G). ChIP-seq profiles are from 14- to 16-h old D. melanogaster embryos (Celniker et al. 2009). Log2ratio of H3K4me3, H3K36me3, H3K27me3, and HP1α ChIP-seq reads over input reads along genes (transcription start site [TSS] to transcription end site [TES]) in conserved TADs (pink), unconserved TADs (gray), and random regions (black). ChIP-seq profiles show mean (thick line) and 95% CI (shadowed area) of input-normalized ChIP-seq enrichment along scaled genes and unscaled 1 kb before the TSS and after the TES, computed using deepStats (Richard 2019). (H) Conserved TADs are enriched in the NSL complex member NSL3. Log2ratio of NSL3 (Lam et al. 2012) ChIP-seq reads over input reads at boundaries of conserved TADs (pink), unconserved TADs (gray), and random regions (black) including the 95% CI (confidence interval) obtained from bootstrapping (n = 1000). The NSL3 enrichment at TAD boundaries is significant based on the 95% CI (1.23 ± 0.21 in conserved and 0.78 ± 0.23 in unconserved TAD boundaries). (I) Fraction of genes with “lethal,” “increased mortality,” “some die,” or “viable” phenotypic classes defined in FlyBase automatic summaries (genes can be annotated with several phenotypes, see Materials and Methods). Significant P-values (a = 0.05) for genes intersecting conserved TADs are displayed. They were obtained using one-tailed χ2 test to check for proportion differences in two samples. (J) Enrichment analysis of promoter and nonpromoter boundary motifs at the boundaries of conserved TADs and unconserved TADs in D. melanogaster. Beaf-32 shows the highest motif enrichment at conserved TADs in all three species (see Supplemental Fig. S6G). (K) Conserved TADs show higher enrichment of Beaf-32 at their boundaries than unconserved TADs by input-normalized ChIP-seq reads (Van Bortle et al. 2014).
Figure 5.
Figure 5.
Binding sites of the dosage compensation complex are shuffled along the X chromosome in D. melanogaster, D. busckii, and D. virilis. (A) Immunostaining of male polytene chromosomes with MOF antibody (green) in D. melanogaster, D. busckii, and D. virilis. DNA is counterstained with Hoechst (blue). Scale bars, 20 µm. Immunostaining of female polytene chromosomes are shown in Supplemental Figure S7. (B) Position (gray vertical bars) and obs/exp Hi-C contacts (red arcs) between high-confidence roX2 sites (HAS) along the entire X chromosome in D. melanogaster, D. busckii, and D. virilis. (C) Example of one corresponding HAS as indicated by the red arrows in B. Coverage of roX2 ChIRP-seq reads, H4K16ac ChIP-seq reads from separated female and male third-instar larvae, SBs, BUSCOs, and genes annotated in D. melanogaster, highlighting RpL7A and dx, two genes with phenotypic classes related to viability reduction corresponding, respectively, to the BUSCOs EOG09150ATD and EOG091502A5 in all three species. (D) Example gene that moved between an autosome and the X chromosome when comparing D. melanogaster and D. virilis. MED20 is localized on chromosome 2L in D. melanogaster but on chromosome X in D. virilis (Dvir GJ18844). The surrounding genes on this SB on chromosome 2L maintained the same order (see corresponding BUSCOs numbered from 1 to 7 and gene track). MED20 in D. virilis (Dvir GJ18844) is localized on chromosome X in between two surrounding SBs, within a H4K16ac domain (male). Two additional examples are shown in Supplemental Figure S7B,C.
Figure 6.
Figure 6.
Enriched Hi-C contacts between binding sites of the dosage compensation complex are maintained throughout Drosophila evolution despite genome shuffling. (A) Aggregate Hi-C matrices around pairwise HAS–HAS contacts in D. melanogaster, D. busckii, and D. virilis compared to random and random active (sites in the A compartment within SBs) pairwise contacts. Displayed are the mean observed over expected contacts ratios of corrected Hi-C matrices with an ∼1.7-kb bin size of ∼250 HAS that are on the X chromosome (n = 246, 213, and 247 in D. melanogaster, D. busckii, and D. virilis, respectively) or a respective number of random regions on the X chromosome. Scheme illustrating the generation of aggregate Hi-C matrices (aggregate plots). (B) Distance of HAS used in A to closest TAD boundary compared to the respective number of random sites. (C) Aggregate Hi-C matrices centered on TAD boundaries with the lowest insulation score on the X chromosome in D. melanogaster, D. busckii, and D. virilis (n = 246, 213 and 247 in D. melanogaster, D. busckii, and D. virilis, respectively), and HAS mirrored at their closest TAD boundary (“mirrored” HAS). TAD boundaries show enriched contacts but “mirrored” HAS show no enriched contacts. (D) Gene expression (normalized counts) of genes overlapping with HAS compared to “mirrored” HAS is not significantly different (n.s.) by Wilcoxon rank-sum test. Comparison of gene expression was performed using library-size normalized RNA-seq counts from 14- to 20-h aged embryos from modENCODE data sets obtained from Ramírez et al. (2018) and also available on the Chorogenome web server (http://chorogenome.ie-freiburg.mpg.de/). (E) Aggregate Hi-C matrices around HAS–HAS or TSS–TSS contacts of genes with equally high expression as genes overlapping with HAS or highly expressed genes in D. melanogaster (n = 209). Underlying gene expression values are shown in Supplemental Figure S7D. (F) Fraction of total orthologous genes (gray) and orthologous genes in common between D. melanogaster and D. busckii (orange) at HAS (n = 195), at random positions defined in the X chromosome A (active) compartment (n = 175), at HAS extended by 30 kb in 5′ and 3′ direction (n = 1380), and at 60-kb random regions defined in the X chromosome A (active) compartment (n = 838). Reported values are calculated in D. melanogaster. Two-sided two-proportions z-test P-values are shown on the right of the bar plot. Orthologs between D. melanogaster and D. virilis were retrieved from FlyBase.

References

    1. Alekseyenko AA, Peng S, Larschan E, Gorchakov AA, Lee O-K, Kharchenko P, McGrath SD, Wang CI, Mardis ER, Park PJ, et al. 2008. A sequence motif within chromatin entry sites directs MSL establishment on the Drosophila X chromosome. Cell 134: 599–609. 10.1016/j.cell.2008.06.033 - DOI - PMC - PubMed
    1. Alekseyenko AA, Ellison CE, Gorchakov AA, Zhou Q, Kaiser VB, Toda N, Walton Z, Peng S, Park PJ, Bachtrog D, et al. 2013. Conservation and de novo acquisition of dosage compensation on newly evolved sex chromosomes in Drosophila. Genes Dev 27: 853–858. 10.1101/gad.215426.113 - DOI - PMC - PubMed
    1. Altschul SF, Gish W, Miller W, Myers EW, Lipman DJ. 1990. Basic local alignment search tool. J Mol Biol 215: 403–410. 10.1016/S0022-2836(05)80360-2 - DOI - PubMed
    1. Arrigoni L, Richter AS, Betancourt E, Bruder K, Diehl S, Manke T, Bönisch U. 2016. Standardizing chromatin research: a simple and universal method for ChIP-seq. Nucleic Acids Res 44: e67 10.1093/nar/gkv1495 - DOI - PMC - PubMed
    1. Bankevich A, Nurk S, Antipov D, Gurevich AA, Dvorkin M, Kulikov AS, Lesin VM, Nikolenko SI, Pham S, Prjibelski AD, et al. 2012. SPAdes: a new genome assembly algorithm and its applications to single-cell sequencing. J Comput Biol 19: 455–477. 10.1089/cmb.2012.0021 - DOI - PMC - PubMed

Publication types