. 2019 Dec 2;216(12):2778-2799.
doi: 10.1084/jem.20190147. Epub 2019 Oct 10.

A novel disorder involving dyshematopoiesis, inflammation, and HLH due to aberrant CDC42 function

Michael T Lam #  1   2   3 Simona Coppola #  4 Oliver H F Krumbach #  5 Giusi Prencipe #  6 Antonella Insalaco #  6 Cristina Cifaldi  7   8 Immacolata Brigida  9 Erika Zara  4 Serena Scala  9 Silvia Di Cesare  7   8 Simone Martinelli  10 Martina Di Rocco  10   11 Antonia Pascarella  6 Marcello Niceta  12 Francesca Pantaleoni  12 Andrea Ciolfi  12 Petra Netter  1 Alexandre F Carisey  1   2 Michael Diehl  13 Mohammad Akbarzadeh  5 Francesca Conti  7 Pietro Merli  14 Anna Pastore  12 Stefano Levi Mortera  12 Serena Camerini  15 Luciapia Farina  4   6 Marcel Buchholzer  5 Luca Pannone  10   12 Tram N Cao  1 Zeynep H Coban-Akdemir  16   17 Shalini N Jhangiani  17   18 Donna M Muzny  17   18 Richard A Gibbs  16   17   18 Luca Basso-Ricci  9 Maria Chiriaco  7 Radovan Dvorsky  5 Lorenza Putignani  12 Rita Carsetti  6 Petra Janning  19 Asbjorg Stray-Pedersen  16   20   21 Hans Christian Erichsen  22 AnnaCarin Horne  23   24 Yenan T Bryceson  25   26 Lamberto Torralba-Raga  25 Kim Ramme  27 Vittorio Rosti  28 Claudia Bracaglia  6 Virginia Messia  6 Paolo Palma  7 Andrea Finocchi  7   8 Franco Locatelli  14   29 Ivan K Chinn  1   30 James R Lupski  1   16   17   18 Emily M Mace  2 Caterina Cancrini  7   8 Alessandro Aiuti  9   31   32 Mohammad R Ahmadian #  33 Jordan S Orange #  34   3 Fabrizio De Benedetti #  35 Marco Tartaglia #  36
Affiliations

A novel disorder involving dyshematopoiesis, inflammation, and HLH due to aberrant CDC42 function

Michael T Lam et al. J Exp Med. .

Abstract

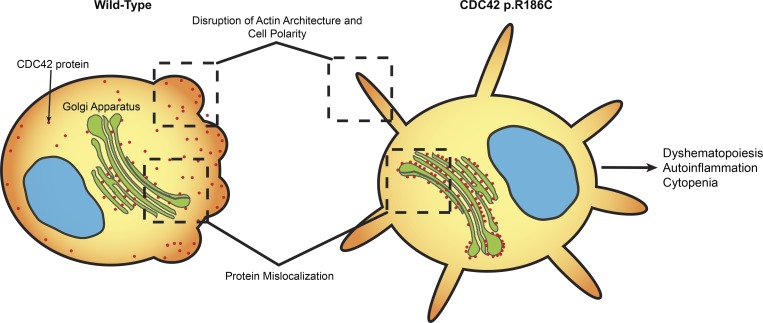
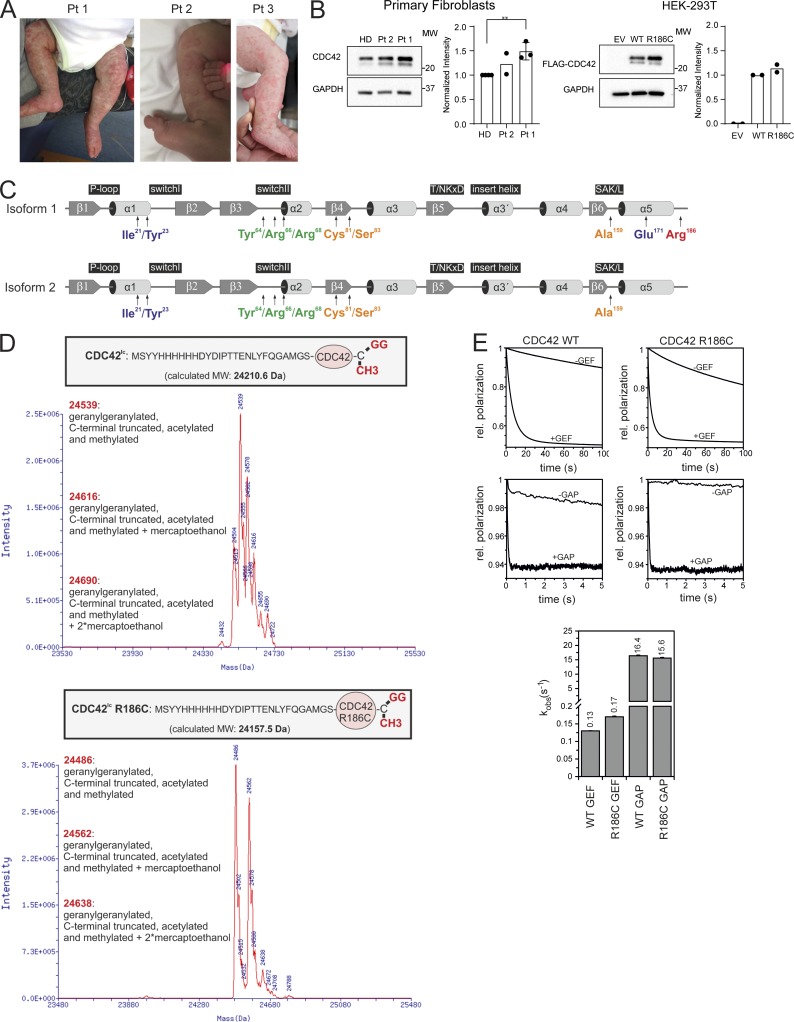
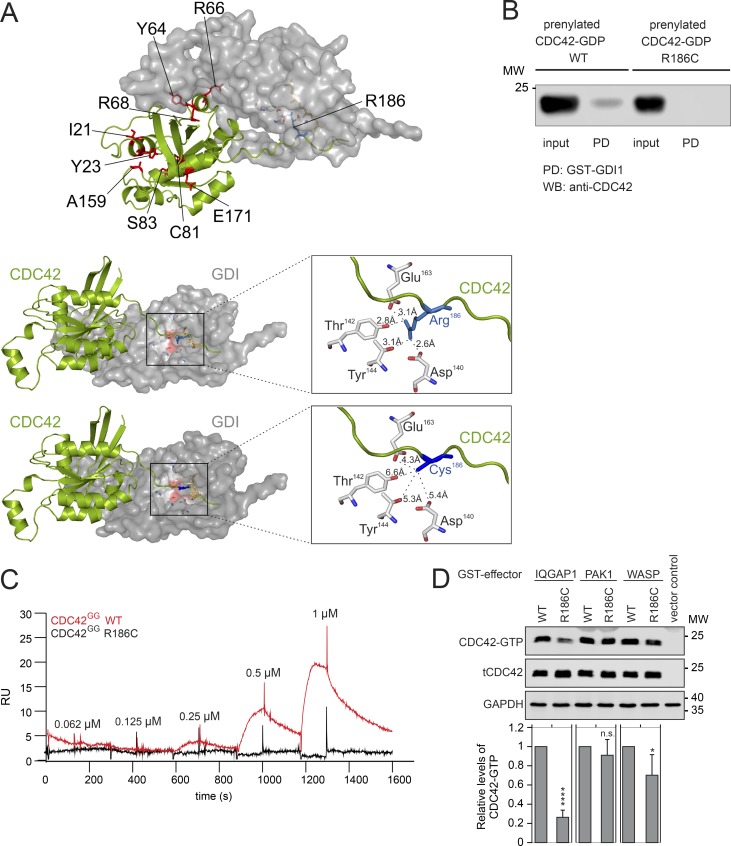
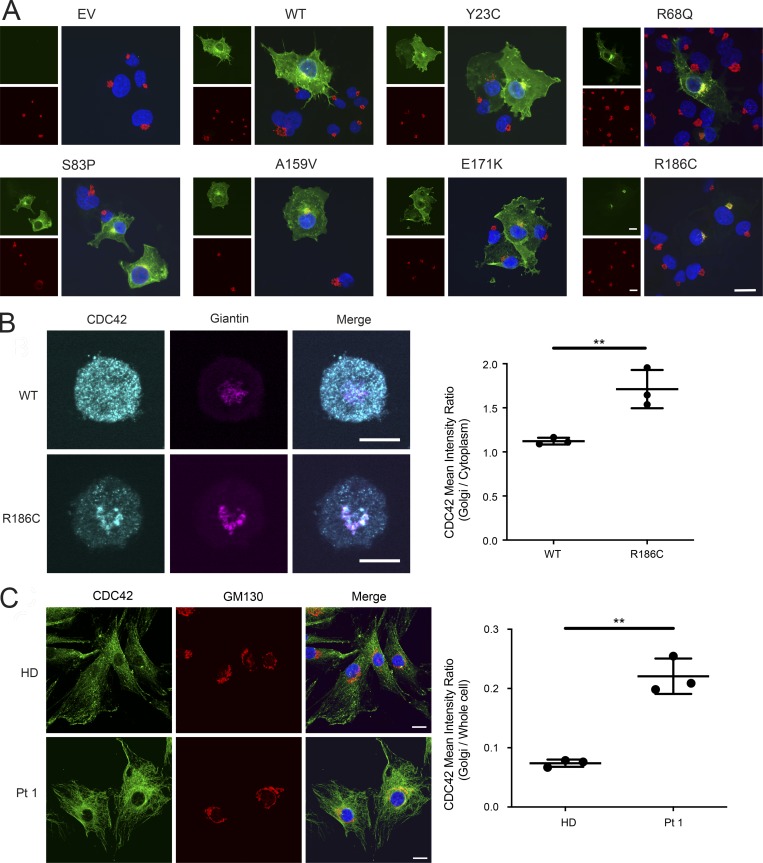
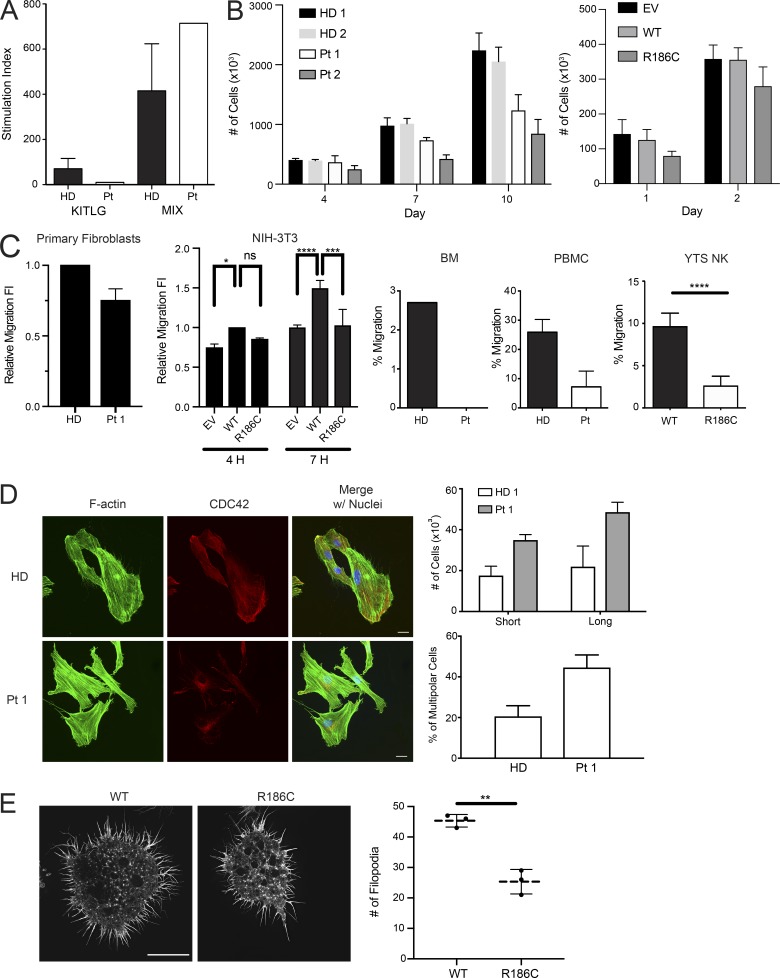
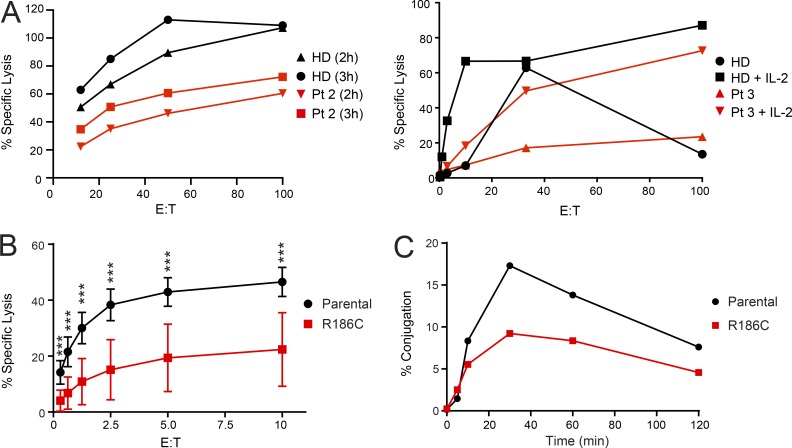
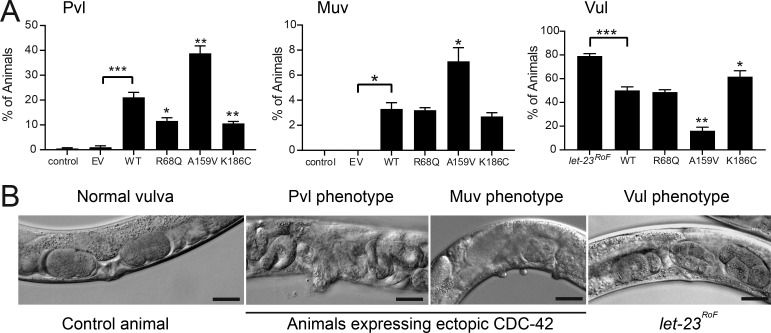
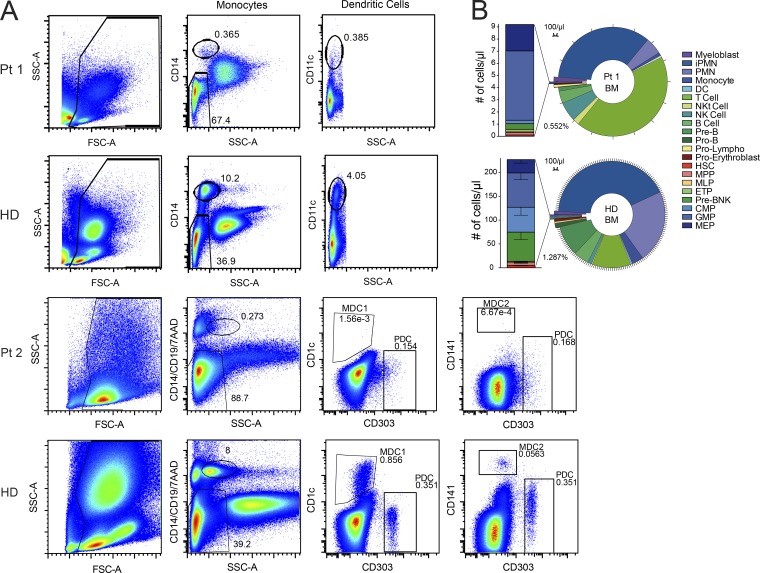
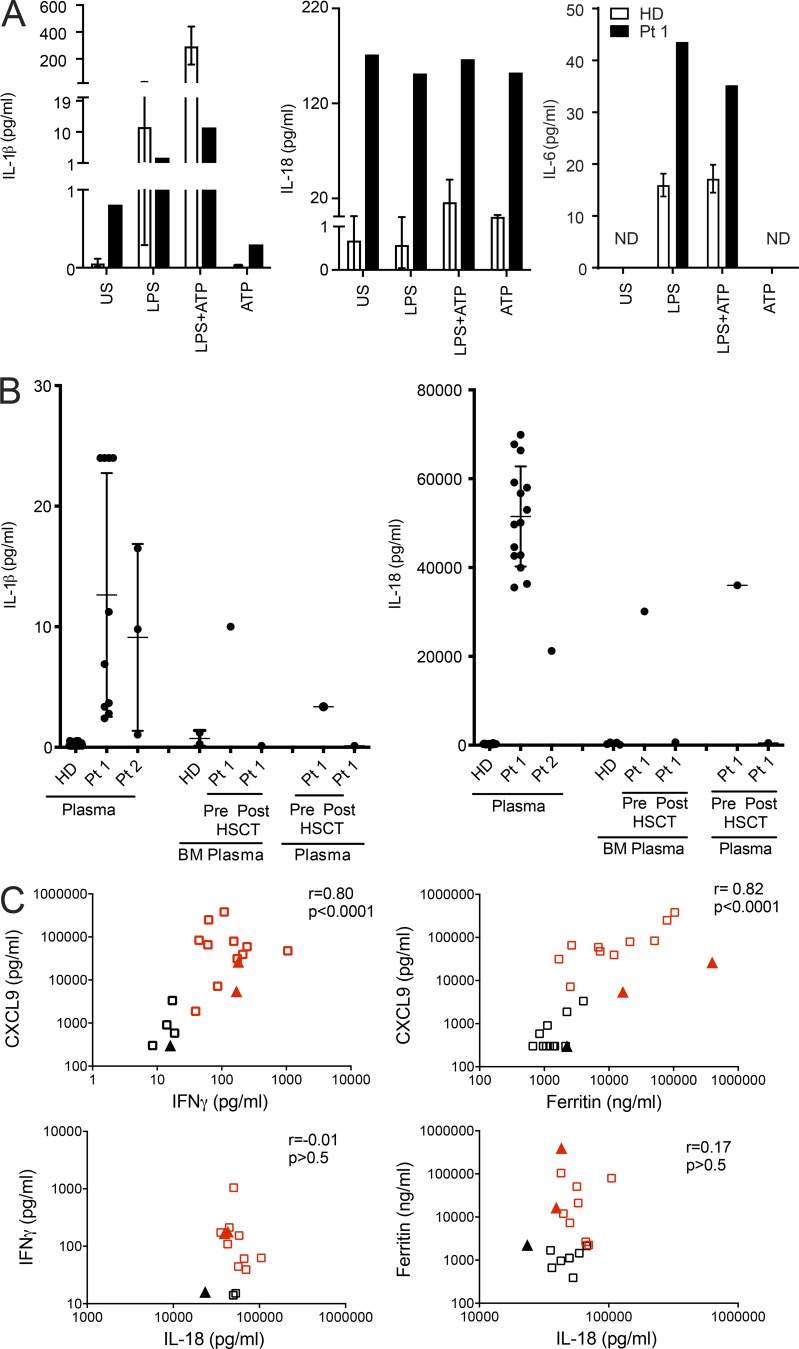
Hemophagocytic lymphohistiocytosis (HLH) is characterized by immune dysregulation due to inadequate restraint of overactivated immune cells and is associated with a variable clinical spectrum having overlap with more common pathophysiologies. HLH is difficult to diagnose and can be part of inflammatory syndromes. Here, we identify a novel hematological/autoinflammatory condition (NOCARH syndrome) in four unrelated patients with superimposable features, including neonatal-onset cytopenia with dyshematopoiesis, autoinflammation, rash, and HLH. Patients shared the same de novo CDC42 mutation (Chr1:22417990C>T, p.R186C) and altered hematopoietic compartment, immune dysregulation, and inflammation. CDC42 mutations had been associated with syndromic neurodevelopmental disorders. In vitro and in vivo assays documented unique effects of p.R186C on CDC42 localization and function, correlating with the distinctiveness of the trait. Emapalumab was critical to the survival of one patient, who underwent successful bone marrow transplantation. Early recognition of the disorder and establishment of treatment followed by bone marrow transplant are important to survival.


Figures

None
Graphical abstract
Figure 1.
Figure 1.
Clinical features of patients carrying the c.556C>T change (p.R186C) in CDC42, and biochemical profiling of the disease-causing mutant. (A) Skin findings of the affected subjects. (B) CDC42 levels in Pt 1 (n = 3, normalized intensity relative to HDs; **, P < 0.01, unpaired t test) and Pt 2 (n = 2) primary fibroblasts and HEK-293T cells (n = 2) expressing FLAG-tagged WT and mutant CDC42 or an empty vector (EV). (C) CDC42 domain organization indicating key functional regions and locations of residues affected by disease-causing variants. The two CDC42 isoforms are shown. Isoform 1 is ubiquitously expressed, while isoform 2 is brain restricted. The missense variants affecting E171 and R186 only affect isoform 1, while mutations affecting the other residues involve both isoforms. (D) p.R186C does not affect CDC42 posttranslational processing. MS analysis of WT and R186C CDC42 proteins shows a strong peak at 24,539 daltons and 24,486 daltons, respectively, indicating that CDC42R186C is properly processed at the C-terminus. Da, daltons. (E) p.R186C does not affect CDC42 GTPase activity and nucleotide exchange behavior. GTPase activity and nucleotide exchange reaction in CDC42R186C (right) are compared with WT CDC42 (left). kobs values (observed dissociation constant) are reported (bottom). Representative polarization curves are shown (n = 4–6). MW, molecular weight; SAK/L, serine-alanine-lysine/leucine motif.
Figure 2.
Figure 2.
p.R186C affects CDC42 binding to RhoGDI, IQGAP1, and WASP. (A) Structure of CDC42 complexed with RhoGDI. Visualization of residues affected in human disease (left). Arg186 has a unique localization within the hypervariable region. Arg186 is surrounded by Asp140, Thr142, Tyr144, and Glu163 of RhoGDI (within 4 Å; right middle panel). p.R186C is predicted to disrupt the interaction between the hypervariable region of CDC42 and RhoGDI (right lower panel). (B) Pull-down (PD) assays showing RhoGDI interaction of prenylated WT and mutant CDC42. Binding of GST-fused RhoGDI to CDC42 proteins was analyzed by WB documenting defective CDC42R186C binding. A representative image is shown (n = 2). (C) SPR analysis of the RhoGDI–CDC42 interaction. Immobilized GST-tagged RhoGDI was titrated with increasing concentrations of WT (red) and R186C (black) CDC42GG proteins. No binding for the mutant protein was observed. RU, response unit (n = 1). (D) Representative WB visualizing pull-down of overexpressed FLAG-tagged WT and R186C CDC42 from COS-7 cell lysates by GST-fused effector proteins IQGAP1, PAK1, and WASP. The same amount of cell lysate was used as a loading control (tCDC42). Bar charts indicate the relative levels of GTP-bound WT and R186C CDC42 normalized to the levels of total CDC42. A strongly reduced and decreased binding of CDC42R186C to IQGAP1 and WASP was documented, respectively (mean ± SD, n = 3 independent experiments; *, P < 0.05; ****, P < 0.0001, one-way ANOVA with Sidak’s multiple comparison test). n.s., not significant; MW, molecular weight.
Figure 3.
Figure 3.
p.R186C leads to aberrant subcellular localization of CDC42. (A) CDC42R186C shows a Golgi apparatus–restricted localization. Immunofluorescence staining of FLAG-tagged CDC42 proteins (green) and GM130 (red), a marker of cis/medial-Golgi apparatus, in COS1 cells transiently transfected with mock DNA (empty vector [EV]), WT CDC42, or mutant alleles carrying different disease-causing mutations (Y23C, R68Q, S83P, A159V, E171K, and R186C). Composite colocalization images are shown in the right panels with nuclei in blue. At least 200 FLAG-tagged CDC42-expressing cells were analyzed for each sample. Representative image of three independent repeats. Scale bar, 20 µm (applicable to all other images shown). (B) Subcellular localization of CDC42 in YTS NK cell lines homozygous for the p.R186C mutation. CDC42R186C was found to be predominantly localized to the Golgi apparatus with reduced cytoplasmic signal. CDC42 signal intensity within the Golgi apparatus was quantified using giantin as a Golgi-specific marker relative to the cytoplasm and presented as a ratio. Representative images of three independent repeats are shown. The graph shows the mean + SD of three independent experiments with n = 38 cells for WT and n = 35 cells for R186C; **, P ≤ 0.01, unpaired two-tailed t test. Scale bar, 10 µm (applicable to all images shown). (C) Immunofluorescence staining of CDC42 (green), GM130 (red), and nuclei (blue) in primary fibroblasts expressing WT CDC42 (HD) or heterozygous for p.R186C (Pt 1). Visual composite colocalization images are shown in the merge panels. Colocalization (orange/yellow overlay) of CDC42 and cis-Golgi is detected in mutant CDC42–expressing cells. Images refer to representative pictures of three independent experiments. Using GM130 as a mask for cis/medial-Golgi, CDC42 fluorescence intensity was quantified as the ratio of Golgi to whole-cell staining using ImageJ software (mean ± SD, n = 3; **, P < 0.01, unpaired two-tailed t test). Scale bar, 20 µm (applicable to all images shown).
Figure 4.
Figure 4.
p.R186C is associated with defects in proliferation, migration, and formation of actin-based structures. (A) Proliferation of BM CD34+ cells from Pt 1 in response to stem cell factor (SCF/KITLG) or a cytokine mixture (MIX; n = 1). (B) Proliferation of primary fibroblasts from Pt 1 (n = 3) and Pt 2 (n = 3) at indicated time points of culture, and NIH-3T3 cells transiently expressing WT or mutant CDC42 or an empty vector (EV). (C) Migration assays of primary fibroblasts from Pt 1 (n = 3), transfected NIH-3T3 cells (n = 3; *, P < 0.05; **, P < 0.01; ****, P < 0.0001, two-way ANOVA with Sidak’s multiple comparisons), purified BM CD34+ sorted cells (n = 1), PBMCs (n = 2), and a YTS CRISPR/Cas9-modified cell line (n = 3; ****, P < 0.0001, unpaired two-tailed t test; mean ± SEM for CD34+/PBMCs and mean ± SD for NK cells, NIH-3T3 cell line, and primary fibroblasts). Migration was assayed using a wound-healing assay on primary fibroblasts and transfected NIH-3T3 cells and directed migration toward chemoattractant CXCL12 in BM CD34+ cells, PBMCs, and YTS NK cells. Decreased directed migration of all tested cell types was observed. FI, fold increase of migratory cells. (D) Cytoskeletal rearrangements of cells expressing CDC42R186C. Multipolarization and filopodia in primary fibroblasts from Pt 1 (n = 3) compared with fibroblasts from an HD. Immunofluorescence staining of CDC42 (red), F-actin (green), and nuclei (blue) in cells stimulated 3 h with 20% serum. In HD fibroblasts, CDC42 localizes to the front leading edge, whereas in Pt 1 fibroblasts, the protein mostly localizes to the perinuclear area. On the right of the panel, quantification of multipolar cells and number of cells with short and long filopodia length are shown. Cells bearing multiple F-actin flat protruding edges (butterfly shaped) were considered multipolar. While HD fibroblasts polarize showing a front (leading edge), a large proportion of Pt 1 fibroblasts show multiple protruding edges. Filopodia twofold longer than nuclei diameter were considered long filopodia. Filopodial length and number were notably increased in fibroblasts, suggesting a disruption of CDC42-dependent actin architecture. Scale bar, 20 µm (applicable to all images shown). (E) Filopodia dynamics of the YTS cells on an activating CD18/CD28 surface. Filopodia were imaged using SIM-TIRF microscopy with representative images showing decreased filopodia count (mean ± SD, n = 3; **, P < 0.01, unpaired two-tailed t test with Welch’s correction) in cells expressing CDC42R186C. Scale bar, 10 µm (applicable to all images shown). n.s., not significant.
Figure 5.
Figure 5.
p.R186C is associated with impaired NK cell cytotoxic function. (A) Assessment of NK cell cytotoxicity in Pt 2 and 3. Using NK cell cytotoxicity assays, Pt 2 at diagnosis had a decreased cytotoxic function compared with an HD at the shown E/T ratios at time points 2 h and 3 h. For Pt 3 at diagnosis, NK cells were stimulated with IL-2, and cytotoxicity was also decreased. (B) Functional characterization of YTS NK cell model. Standard Cr-51 release assay of YTS NK cell lines against 721.221 target cells. The mutant cell line showed a significant decrease in cytotoxicity (pooled mean ± SD, n = 3 independent repeats each with triplicates; ***, P < 0.001, Mann–Whitney U test). (C) Co-culture conjugation assay of YTS NK cell lines against 721.221 target cells. Compared with parental YTS NK cells, a reduced ability of the YTS NK cells expressing the mutant allele to form conjugates with 721.221 target cells was also observed. A representative figure is shown (n = 4).
Figure 6.
Figure 6.
p.R186C affects C. elegans vulval development. (A) Hypomorphic effect of the mutation on pathways controlling C. elegans vulval development. Compared with WT CDC-42, the K186C mutant induces a less penetrant Pvl phenotype and less efficiently rescues the Vul phenotype of animals carrying a hypomorphic let-23/EGFR allele, indicating a hypomorphic behavior on multiple signaling pathways. The R68Q and A159V mutants, representative of group I (substitutions characterized by impaired binding to regulators and effectors) and group II (gain-of-function changes) mutations, respectively, are shown for comparison. Error bars indicate SEM of three independent experiments. Asterisks specify significant differences between animals expressing WT CDC-42 and those expressing the empty vector (EV) or the let-23(sy1) allele (*, P < 0.05; ***, P < 1.2e-6; two-tailed Fisher’s exact test), and between animals expressing WT and mutant CDC-42 (*, P < 0.05 [Muv] or P < 0.005 [Pvl and Vul]; **, P < 0.00002 [Pvl] or P < 3.2e-6 [Vul]). Number of animals are reported in Table S4. (B) Representative images of C. elegans phenotypes. Scale bars, 20 µm.
Figure 7.
Figure 7.
p.R186C leads to disruption of certain hematopoietic compartments. (A) Flow cytometric analysis of monocyte and dendritic cell (DC) immunophenotype on whole lysed peripheral blood of Pt 1 (n = 1) and Pt 2 (n = 1) showing a severe reduction of monocytes and myeloid dendritic cells. Upper plots (Pt 1 and Pt 2) from left to right: after elimination of debris, we gated on CD14 or CD14, CD19, 7AAD SSClow cells to identify monocytes. In the CD14 SSClow population, we gated on CD11c+ cells for dendritic cell identification in Pt 1. In the CD14CD197AAD SSClow population, we gated on CD1c, CD141, or CD303 to distinct the dendritic cell major subtypes (MDC1, type 1 myeloid dendritic cell; MDC2, type 2 myeloid dendritic cell; PDC, plasmacytoid dendritic cell) in Pt 2. Numbers within the plots show the frequency of monocytes and dendritic cells in the total events displayed. SSC-A, SSC-area; FSC-A, FSC-area. (B) The ring chart shows absolute counts of distinct hematopoietic subpopulations on total CD45+ cells (indicated in the legend) in BM of pediatric HDs (n = 6) and Pt 1. The stacked bar graph on the left is a zoom on the absolute count of hematopoietic stem and progenitor cell subtypes within the LINCD34+ compartment. PreB/NK, B and NK cell progenitor; CMP, common myeloid progenitor; ETP, early T progenitor; GMP, granulocyte/monocyte progenitor; iPMN, immature polymorphonucleated cell; MEP, megakaryocyte/erythrocyte progenitor; MLP multi-lymphoid progenitor; MPP, multi-potent progenitor; NKt, NK T cell; PMN, polymorphonucleated cell.
Figure 8.
Figure 8.
p.R186C is associated with high production of inflammasome-related cytokines IL-1β and IL-18 in vivo and ex vivo. (A) HD (n = 3) and Pt 1 BM mononuclear cells were left unstimulated (US) or stimulated with LPS (10 µg/ml) for 5 h, with or without ATP (1 mM) for an additional 1 h. Compared with unstimulated HD cells, unstimulated Pt 1 cells release high levels of IL-1β and IL-18. In LPS-primed HD cells, ATP addition caused a marked increase in IL-1β and IL-18 release, while this is not observed in LPS-primed Pt 1 cells. IL-6 levels released in supernatants were also measured; no spontaneous release was observed. ND, not detectable. Secreted cytokines were measured by ELISA, and results obtained were normalized by the absolute number of monocytes per milliliter BM. (B) IL-1β and IL-18 levels were measured in plasma samples collected from Pt 1 and Pt 2 at different time points over the course of the disease. IL-1β and IL-18 levels were also measured in BM, and plasma samples were obtained from Pt 1 30 d before and after HSCT. For HDs, plasma n = 24 and BM n = 5. For Pt 1 and Pt 2, n = 1. Mean ± SD is indicated. (C) Plasma levels of IFN-γ, CXCL9, and IL-18 were measured in Pt 1 (squares) and Pt 2 (triangles) and correlated with ferritin levels, a typical marker of HLH activity. IFN-γ and CXCL9 levels, but not IL-18 levels, are significantly correlated with ferritin levels. Red squares and triangles indicate samples collected when Pt 1 and Pt 2 fulfilled at least five criteria required for HLH diagnosis.

References

    1. Aicart-Ramos C., Valero R.A., and Rodriguez-Crespo I.. 2011. Protein palmitoylation and subcellular trafficking. Biochimica et Biophysica Acta (BBA) -. Biomembranes. 1808:2981–2994. 10.1016/j.bbamem.2011.07.009 - DOI - PubMed
    1. Baschieri F., Confalonieri S., Bertalot G., Di Fiore P.P., Dietmaier W., Leist M., Crespo P., Macara I.G., and Farhan H.. 2014. Spatial control of Cdc42 signalling by a GM130-RasGRF complex regulates polarity and tumorigenesis. Nat. Commun. 5:4839 10.1038/ncomms5839 - DOI - PMC - PubMed
    1. Basso-Ricci L., Scala S., Milani R., Migliavacca M., Rovelli A., Bernardo M.E., Ciceri F., Aiuti A., and Biasco L.. 2017. Multiparametric Whole Blood Dissection: A one-shot comprehensive picture of the human hematopoietic system. Cytometry A. 91:952–965. 10.1002/cyto.a.23148 - DOI - PMC - PubMed
    1. Bauer C.K., Calligari P., Radio F.C., Caputo V., Dentici M.L., Falah N., High F., Pantaleoni F., Barresi S., Ciolfi A., et al. . 2018. Mutations in KCNK4 that Affect Gating Cause a Recognizable Neurodevelopmental Syndrome. Am. J. Hum. Genet. 103:621–630. 10.1016/j.ajhg.2018.09.001 - DOI - PMC - PubMed
    1. Bracaglia C., de Graaf K., Pires Marafon D., Guilhot F., Ferlin W., Prencipe G., Caiello I., Davì S., Schulert G., Ravelli A., et al. . 2017. Elevated circulating levels of interferon-γ and interferon-γ-induced chemokines characterise patients with macrophage activation syndrome complicating systemic juvenile idiopathic arthritis. Ann. Rheum. Dis. 76:166–172. 10.1136/annrheumdis-2015-209020 - DOI - PubMed

Publication types

MeSH terms

Substances

Associated data