. 2020 Jan 16;55(1):1900646.
doi: 10.1183/13993003.00646-2019. Print 2020 Jan.

A spatially restricted fibrotic niche in pulmonary fibrosis is sustained by M-CSF/M-CSFR signalling in monocyte-derived alveolar macrophages

Affiliations

A spatially restricted fibrotic niche in pulmonary fibrosis is sustained by M-CSF/M-CSFR signalling in monocyte-derived alveolar macrophages

Nikita Joshi et al. Eur Respir J. .

Abstract

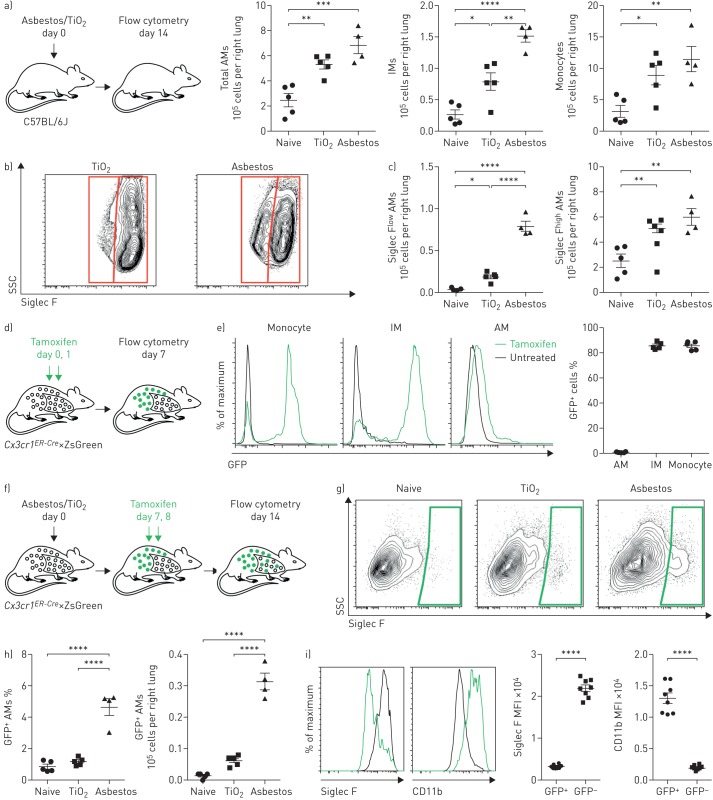
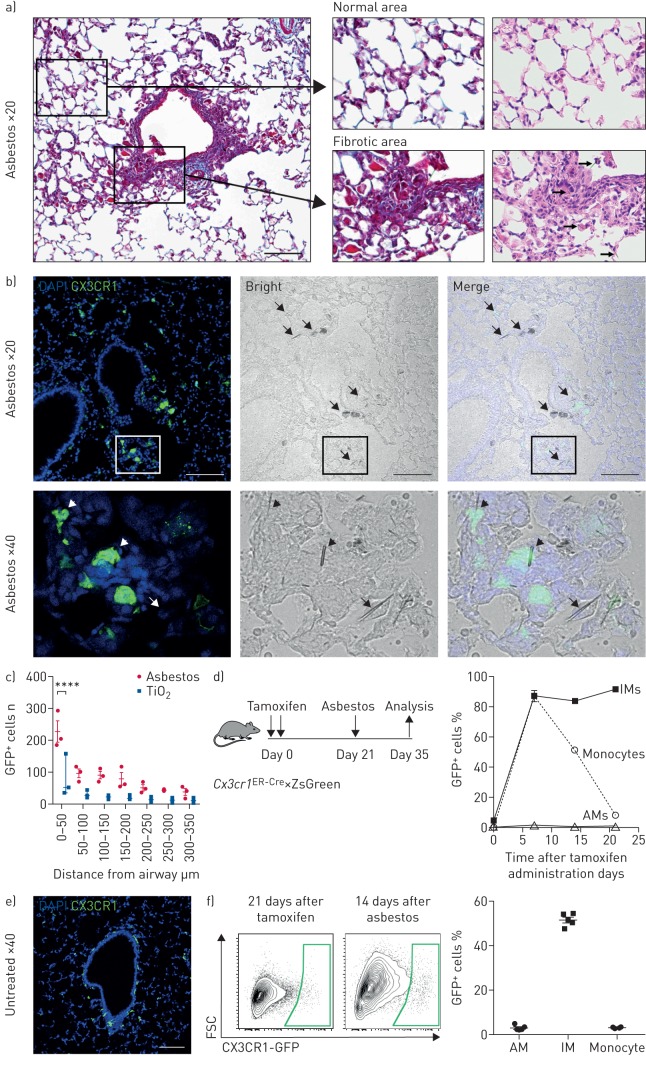
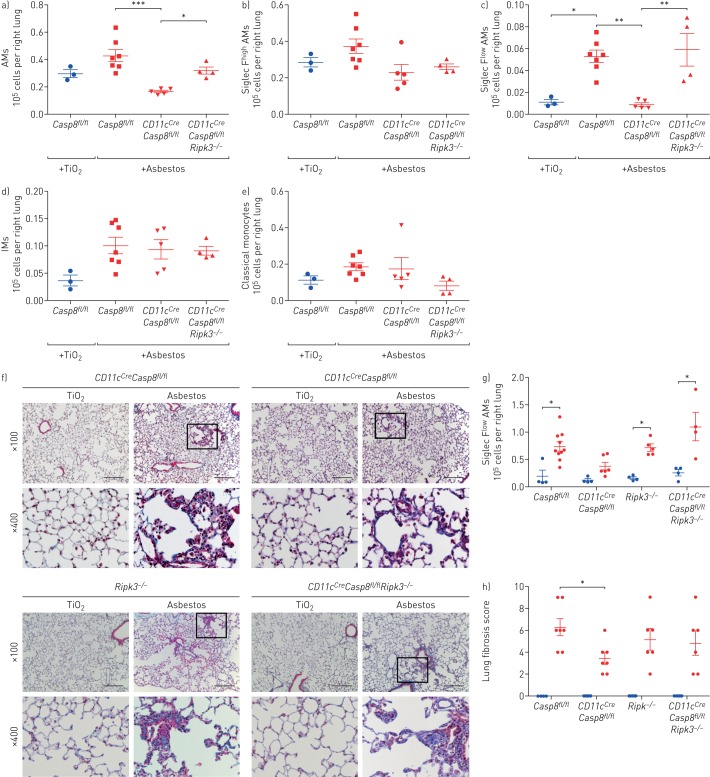
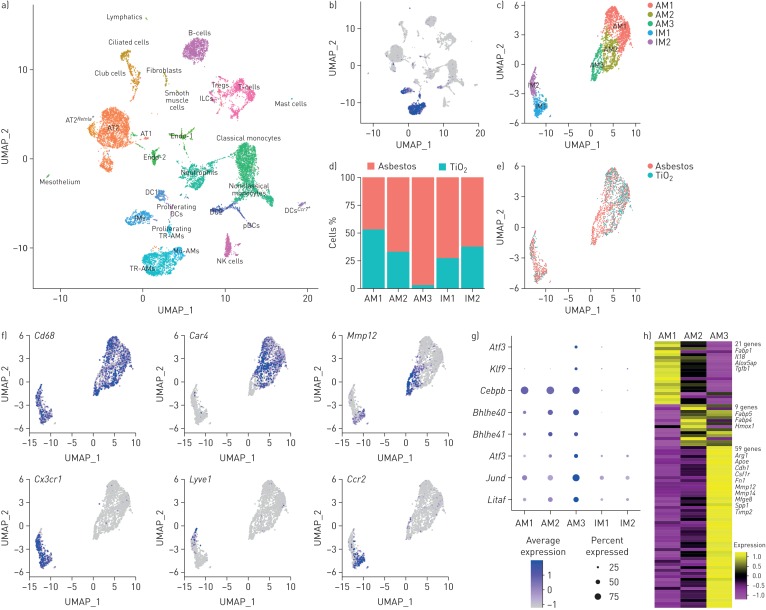
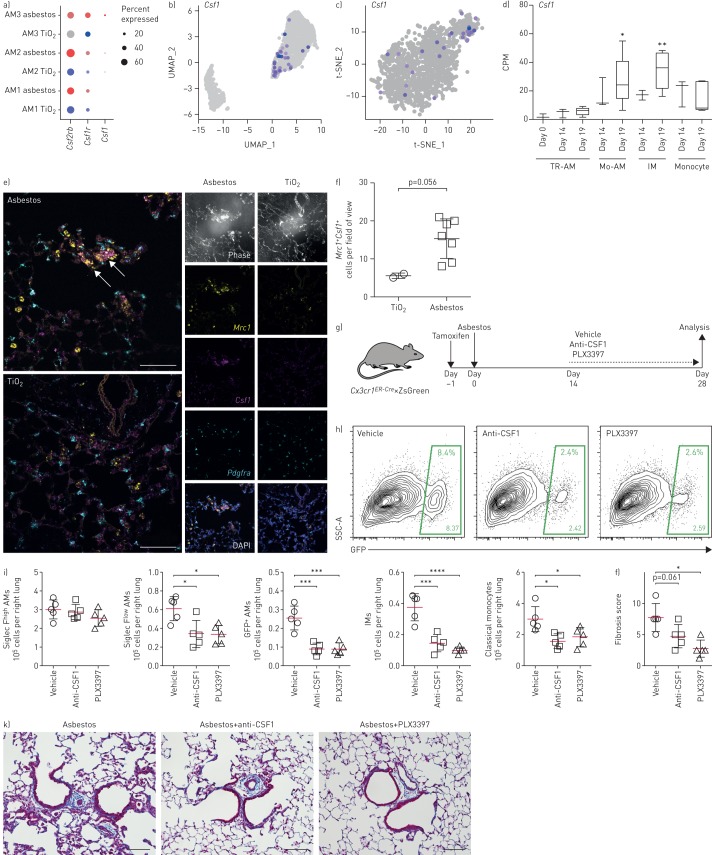
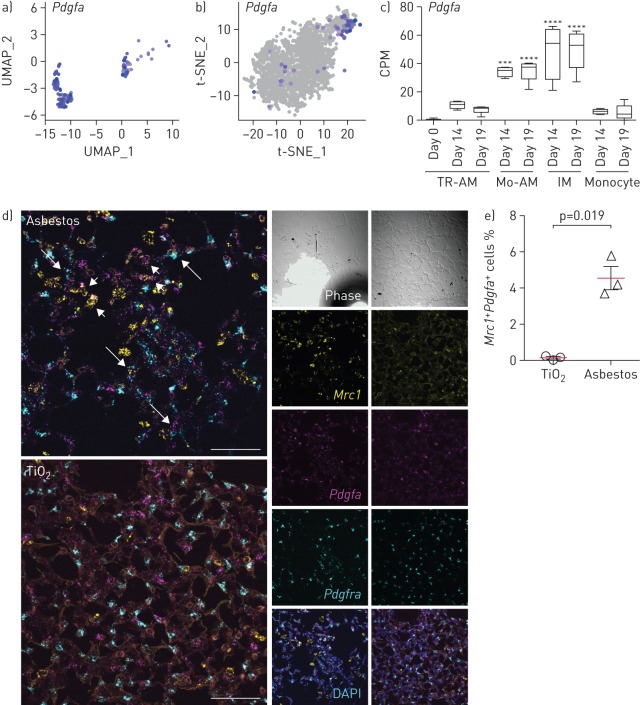
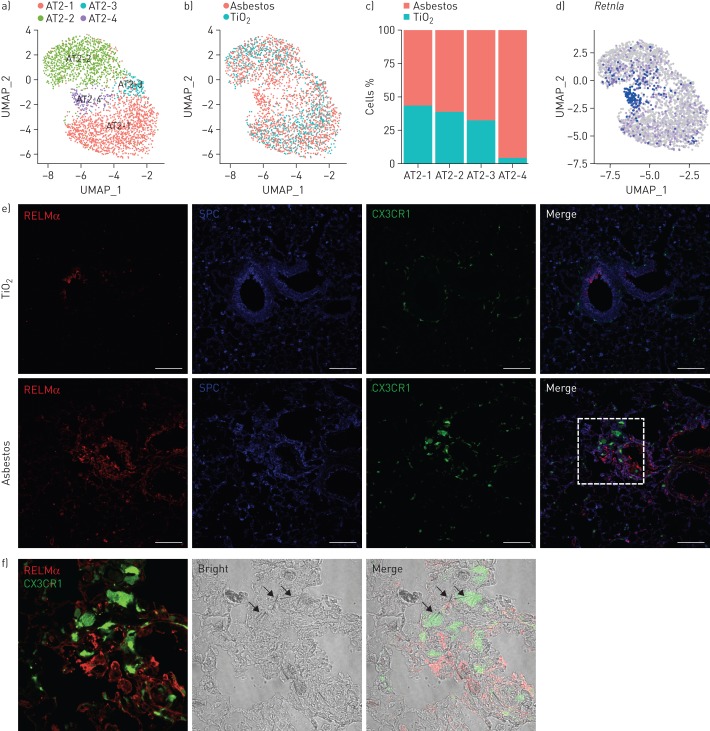
Ontologically distinct populations of macrophages differentially contribute to organ fibrosis through unknown mechanisms.We applied lineage tracing, single-cell RNA sequencing and single-molecule fluorescence in situ hybridisation to a spatially restricted model of asbestos-induced pulmonary fibrosis.We demonstrate that tissue-resident alveolar macrophages, tissue-resident peribronchial and perivascular interstitial macrophages, and monocyte-derived alveolar macrophages are present in the fibrotic niche. Deletion of monocyte-derived alveolar macrophages but not tissue-resident alveolar macrophages ameliorated asbestos-induced lung fibrosis. Monocyte-derived alveolar macrophages were specifically localised to fibrotic regions in the proximity of fibroblasts where they expressed molecules known to drive fibroblast proliferation, including platelet-derived growth factor subunit A. Using single-cell RNA sequencing and spatial transcriptomics in both humans and mice, we identified macrophage colony-stimulating factor receptor (M-CSFR) signalling as one of the novel druggable targets controlling self-maintenance and persistence of these pathogenic monocyte-derived alveolar macrophages. Pharmacological blockade of M-CSFR signalling led to the disappearance of monocyte-derived alveolar macrophages and ameliorated fibrosis.Our findings suggest that inhibition of M-CSFR signalling during fibrosis disrupts an essential fibrotic niche that includes monocyte-derived alveolar macrophages and fibroblasts during asbestos-induced fibrosis.


Conflict of interest statement

Conflict of interest: S. Watanabe has nothing to disclose. Conflict of interest: R. Verma has nothing to disclose. Conflict of interest: R.P. Jablonski has nothing to disclose. Conflict of interest: C-I Chen has nothing to disclose. Conflict of interest: P. Cheresh has nothing to disclose. Conflict of interest: N.S. Markov has nothing to disclose. Conflict of interest: P.A. Reyfman has nothing to disclose. Conflict of interest: A.C. McQuattie-Pimentel has nothing to disclose. Conflict of interest: L. Sichizya has nothing to disclose. Conflict of interest: Z. Lu has nothing to disclose. Conflict of interest: R. Piseaux-Aillon has nothing to disclose. Conflict of interest: D. Kirchenbuechler has nothing to disclose. Conflict of interest: A.S. Flozak has nothing to disclose. Conflict of interest: C.J. Gottardi has nothing to disclose. Conflict of interest: C.M. Cuda has nothing to disclose. Conflict of interest: H. Perlman has nothing to disclose. Conflict of interest: M. Jain has nothing to disclose. Conflict of interest: D.W. Kamp has nothing to disclose. Conflict of interest: G.R.S. Budinger has nothing to disclose. Conflict of interest: A.V. Misharin has nothing to disclose. Conflict of interest: N. Joshi has nothing to disclose.

Figures

FIGURE 1
FIGURE 1
Exposure to asbestos or TiO2 is distinguished by the recruitment of monocyte-derived alveolar macrophages (Mo-AMs) to the lung. IM: interstitial macrophage; SSC: side scatter; FSC: forward scatter; GFP: green fluorescent protein; MFI: median fluorescence intensity. a) Mice were administered crocidolite asbestos or TiO2 (both at 100 µg intratracheally), and monocyte and macrophage populations were quantified by flow cytometry 14 days later (see supplementary figure S1a and b for gating strategy and quantification of other myeloid cell populations). b) Representative contour plots gated on AMs (CD64+Siglec F+) from asbestos- or TiO2-treated animals. c) Quantification of Siglec Flow and Siglec Fhigh AMs from naive, TiO2- or asbestos-exposed animals according to gating in (b). d) Schematic of the experimental design for (e). e) Cx3cr1ER-Cre×ZsGreen mice were treated with tamoxifen, and the percentage of GFP+ classical monocytes, IMs and AMs was assessed by flow cytometry. Representative histograms showing GFP expression are shown. f) Schematic of the experimental design for (g) and (h): lineage tracing system to track the ontogeny of AMs after intratracheal administration of asbestos or TiO2. Cx3cr1ER-Cre×ZsGreen mice were treated with asbestos or TiO2 and tamoxifen was administered as two boluses at days 7 and 8. The number of GFP+ AMs was analysed 7 days later. g) Representative contour plots and h) quantification of GFP+ Mo-AMs after asbestos or TiO2 exposure. i) Representative histograms and MFI demonstrating expression of Siglec F and CD11b on Mo-AMs 14 days after exposure to asbestos. All data are presented as mean±sem. n=4–5 mice per group. One-way ANOVA with the Tukey–Kramer test for multiple comparisons. *: p<0.05; **: p<0.01; ***: p<0.001; ****: p<0.0001. Representative data from two independent experiments.
FIGURE 2
FIGURE 2
Recruitment of monocyte-derived alveolar macrophages (Mo-AMs) is spatially restricted to areas near asbestos fibres. DAPI: 4′,6-diamidino-2-phenylindole; GFP: green fluorescent protein; IM: interstitial macrophage; FSC: forward scatter. a) The intratracheal administration of asbestos fibres induces fibrosis near bronchoalveolar duct junctions where asbestos fibres lodge. Left panel: low-power image of a medium-sized airway (Mason's trichrome). Scale bar: 100 µm. Right panels: high-power images (Mason's trichrome and haematoxylin/eosin, respectively). Areas of fibrosis develop adjacent to the airway in which asbestos fibres can be observed (arrows, bottom right panel). In contrast, alveolar structures in the distal lung parenchyma are relatively preserved. b) Top panels: representative lung histology from Cx3cr1ER-Cre×ZsGreen mice treated with tamoxifen on day 14 and 15 (10 mg via oral gavage) and harvested 21 days after asbestos exposure. Scale bar: 100 µm. Bottom row panels correspond to areas outlined in the boxes. Left panels: monocyte-derived cells are GFP+; nuclei stained with DAPI. Middle panels: phase contrast images; asbestos fibres are indicated by arrows. Right panels: merge. Bottom panels: asbestos fibres are surrounded by GFP+ cells (short arrows) and GFP cells (arrow) with macrophage morphology. c) Quantification of GFP+ Mo-AMs in peribronchial regions in asbestos- and TiO2-treated mice. Two-way ANOVA with Tukey's multiple comparisons test. ****: p<0.0001. d) Schematic of the experimental design, and kinetics of GFP+ monocytes, tissue-resident IMs and tissue-resident AMs after tamoxifen pulse in naive Cx3cr1ER-Cre×ZsGreen mice. Percentage of GFP+ cells was assessed by flow cytometry. e) Representative fluorescent image showing GFP+ tissue-resident IMs 21 days after tamoxifen pulse in naive animals. f) Representative contour plots showing GFP expression gated on AMs from Cx3cr1ER-Cre×ZsGreen mice 21 days after tamoxifen and 14 days after asbestos instillation. Percentage of GFP+ classical monocytes, IMs and AMs was assessed by flow cytometry. All data are presented as mean±sem. n=3–5 mice per group or time-point.
FIGURE 3
FIGURE 3
Deletion of monocyte-derived alveolar macrophages (AMs) attenuates asbestos-induced pulmonary fibrosis. IM: interstitial macrophage. Casp8fl/fl, CD11cCreCasp8fl/fl, CD11cCreCasp8fl/flRipk3/and Ripk3/ mice were administered crocidolite asbestos or TiO2 (both at 100 µg intratracheally) and lungs were harvested 28 days later. a–e) Lungs were analysed using flow cytometry to quantify monocyte and macrophage populations. f) Representative histological images (Mason's trichrome). Scale bar: 100 µm. g) Quantification of soluble collagen in lung homogenates. h) Lung fibrosis score: blinded scoring of a single longitudinal section from each mouse. Blue circles: TiO2 treatment; red symbols: asbestos administration. All data are presented as mean±sem. n=3–7 mice per group. One-way ANOVA with the Tukey–Kramer test for multiple comparisons. *: p<0.05; **: p<0.01; ***: p<0.001.
FIGURE 4
FIGURE 4
Single-cell RNA sequencing reveals pro-fibrotic monocyte-derived alveolar macrophages (Mo-AMs) during asbestos-induced pulmonary fibrosis. UMAP: uniform manifold approximation and projection; Treg: regulatory T-cell; AT1: alveolar epithelial type I cell; AT2: alveolar epithelial type II cell; Endo: endothelial cell; DC: dendritic cell; IM: interstitial macrophage; pDC: plasmacytoid DC; TR-AM: tissue-resident AM. a) UMAP plot demonstrating 26 cell clusters from 15 452 cells identified by single-cell RNA sequencing 14 days after asbestos or TiO2 exposure (one mouse per condition). b) Macrophages were identified using canonical lineage-restricted markers, such as Mrc1, as shown on the UMAP plot. c) Clusters of cells expressing Mrc1 were subset from the main dataset and re-clustered, revealing two subclusters of tissue-resident lung IMs (IM1 and IM2) and three subclusters of AMs (AM1, AM2 and AM3). d) Bar plot and e) feature plot demonstrating the composition of macrophage subclusters in cells from asbestos- and TiO2-exposed animals. f) Feature plots demonstrating expression of cluster-specific genes: Cd68 as a pan-macrophage marker, Car4 as a marker of mature TR-AMs (AM1 and AM2) and Mmp12 as a marker of Mo-AMs (AM3). Tissue-resident IMs are characterised by expression of Cx3cr1, and can be further subdivided into perivascular (Lyve1) and peribronchial (Ccr2) IMs. g) Dot plot demonstrating the expression of transcription factors differentially expressed in Mo-AMs (AM3). h) Heatmap of 93 genes overlapping between AMs and pulmonary fibrosis-associated genes from the Comparative Toxicogenomic Database (947 genes as of February 2019). Selected genes characterising clusters are shown; see supplementary figure S4e for the full list of genes. Interactive plots are available for exploration at www.nupulmonary.org/resources.
FIGURE 5
FIGURE 5
Autocrine macrophage colony-stimulating factor (M-CSF) signalling is required for maintenance of monocyte-derived alveolar macrophages (Mo-AMs) within fibrotic niches. UMAP: uniform manifold approximation and projection; t-SNE: t-distributed stochastic neighbour embedding; TR-AM: tissue-resident AM; IM: interstitial macrophage; SSC: side scatter; GFP: green fluorescent protein. a) Dot plot showing expression of Csf2rb, Csf1r and Csf1 in subclusters of AMs after TiO2 and asbestos exposure. b, c) Feature plots showing expression of Csf1 in subcluster AM3 after b) asbestos and c) bleomycin exposure. d) Box and whisker plot shows expression of Csf1 in flow-sorted AMs during the course of bleomycin-induced pulmonary fibrosis (data from Misharin et al. [9]). Box plot centre lines are median, box limits are upper and lower quartiles, and whiskers are minimal and maximal values. One-way ANOVA with Bonferroni correction for multiple comparisons. e) In situ RNA hybridisation confirms expression of Csf1 in AMs during asbestos-induced pulmonary fibrosis. Analysis performed on day 28 after TiO2 or asbestos exposure. Macrophages were identified as Mrc1+ cells and fibroblasts were identified as Pdgfra+ cells. Arrows indicate Mrc1+Csf1+ AMs. Scale bar: 50 µm. f) The number of Mrc1+Csf1+ AMs is increased after asbestos exposure. Data are from one mouse per condition. Mean±sd. Mann–Whitney test. g) Schematic of experimental design. Cx3cr1ER-Cre×ZsGreen mice received a pulse of tamoxifen via oral gavage 1 day prior to administration of crocidolite asbestos (100 µg intratracheally). Starting at day 14 mice were treated with anti-CSF1 antibody (0.5 mg intraperitoneally, every 5 days) or PLX3397 (40 mg·kg−1 orally, every day) and harvested at day 28. Numbers of monocytes and macrophages were measured by flow cytometry and the fibrosis score was analysed by histology at day 28. h) Representative flow cytometry plots gated on CD64+Siglec F+ AMs. i) Number of TR-AMs, Mo-AMs, IMs and classical monocytes from asbestos-exposed animals. j) Fibrosis score 28 days after asbestos exposure. k) Representative histological findings. Mason's trichrome. Scale bar 100 µm. Data are presented as mean±sem. n=5 mice per group. One-way ANOVA with the Tukey–Kramer test for multiple comparisons. *: p<0.05; **: p<0.01; ***: p<0.001; ****: p<0.0001.
FIGURE 6
FIGURE 6
Monocyte-derived alveolar macrophages (Mo-AMs) express Pdgfa which is required for fibroblast proliferation. UMAP: uniform manifold approximation and projection; t-SNE: t-distributed stochastic neighbour embedding; TR-AM: tissue-resident AM; IM: interstitial macrophage. a, b) UMAP and t-SNE plots showing expression of Pdgfa in AMs after a) asbestos and b) bleomycin exposure. c) Bar plot showing expression of Pdgfa in flow-sorted AMs during the course of bleomycin-induced pulmonary fibrosis. Data from Misharin et al. [9]. Box plot centre lines are median, box limits are upper and lower quartiles, and whiskers are minimal and maximal values. One-way ANOVA with Bonferroni correction for multiple comparisons. ***: p<0.001; ****: p<0.0001. d) In situ RNA hybridisation confirms expression of Pdgfa in AMs during pulmonary fibrosis. Analysis performed on day 28 after TiO2 or asbestos exposure. Macrophages were identified as Mrc1+ cells and fibroblasts were identified as Pdgfra+ cells. Short arrows indicate Mrc1+Pdgfa+ macrophages and long arrows indicate Pdgfra+ fibroblasts adjacent to Mrc1+Pdgfa+ macrophages. Scale bar: 50 µm. e) The percentage of Mrc1+Pdgfa+ AMs is increased after asbestos exposure. Data are from three mice per condition. Mean±sd. Mann–Whitney test.
FIGURE 7
FIGURE 7
Expression of resistin-like molecule-α (RELMα) is restricted to epithelial cells located in the areas of fibrosis. UMAP: uniform manifold approximation and projection; SPC: surfactant protein C. a) UMAP plot demonstrating subclusters of alveolar type II cells. b) UMAP plot and c) bar plot demonstrating composition of the alveolar type II cell subclusters. d) Feature plot demonstrating increased expression of Retnla in alveolar type II cells 14 days after asbestos exposure. e) Cx3cr1ER-Cre×ZsGreen mice were administered with asbestos intratracheally and treated with tamoxifen at days 14 and 15 after exposure; lungs were harvested for analysis at day 21. Representative fluorescent images showing expression of RELMα (red), SPC (blue) and CX3CR1–green fluorescent protein (green) in lungs from TiO2- or asbestos-treated animals at day 21 post-exposure. RELMα is detected in the airway epithelial cells and alveolar type II cells in the fibrotic regions in the asbestos model, but not in alveolar type II cells after TiO2 exposure. Scale bar: 100 µm. f) Enlargement of the box in (e): RELMα-positive epithelial cells (red) and monocyte-derived alveolar macrophages (green) are co-localised with asbestos fibres. Experimental design same as in (e).

References

    1. Raghu G, Remy-Jardin M, Myers JL, et al. . Diagnosis of idiopathic pulmonary fibrosis. An official ATS/ERS/JRS/ALAT clinical practice guideline. Am J Respir Crit Care Med 2018; 198: e44–e68. doi:10.1164/rccm.201807-1255ST - DOI - PubMed
    1. Reyfman PA, Walter JM, Joshi N, et al. . Single-cell transcriptomic analysis of human lung provides insights into the pathobiology of pulmonary fibrosis. Am J Respir Crit Care Med 2019; 199: 1517–1536. doi:10.1164/rccm.201712-2410OC - DOI - PMC - PubMed
    1. Cugell DW, Kamp DW. Asbestos and the pleura: a review. Chest 2004; 125: 1103–1117. doi:10.1378/chest.125.3.1103 - DOI - PubMed
    1. Adamson IY, Bowden DH. Response of mouse lung to crocidolite asbestos. 2. Pulmonary fibrosis after long fibres. J Pathol 1987; 152: 109–117. doi:10.1002/path.1711520207 - DOI - PubMed
    1. Adamson IY, Bowden DH. Response of mouse lung to crocidolite asbestos. 1. Minimal fibrotic reaction to short fibres. J Pathol 1987; 152: 99–107. doi:10.1002/path.1711520206 - DOI - PubMed

Publication types

Substances