. 2019 Oct 10;10(1):4601.
doi: 10.1038/s41467-019-12484-z.

Human placental trophoblast cells contribute to maternal-fetal tolerance through expressing IL-35 and mediating iTR35 conversion

Affiliations

Human placental trophoblast cells contribute to maternal-fetal tolerance through expressing IL-35 and mediating iTR35 conversion

Jia Liu et al. Nat Commun. .

Abstract

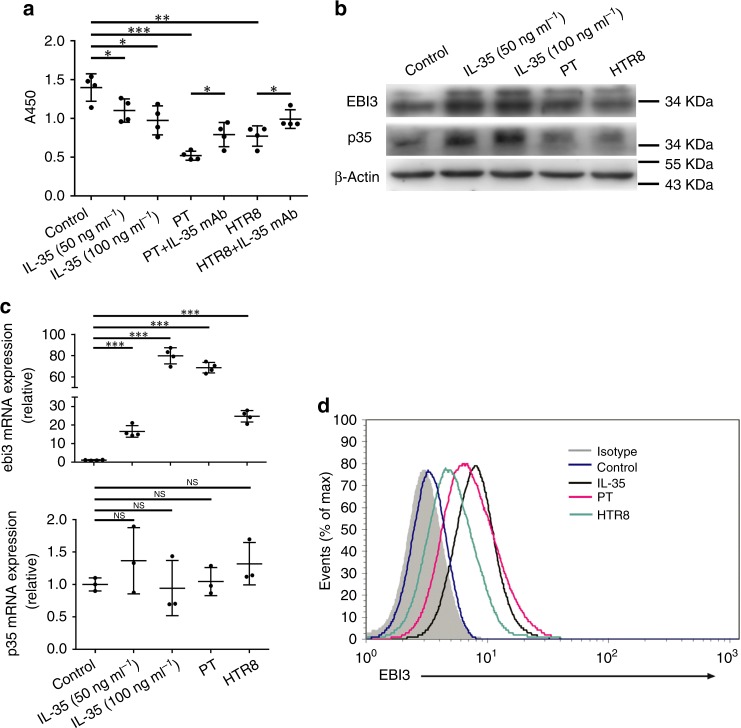
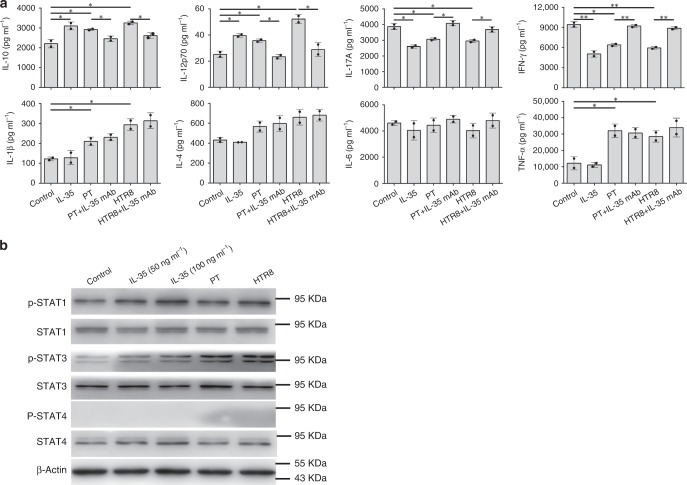
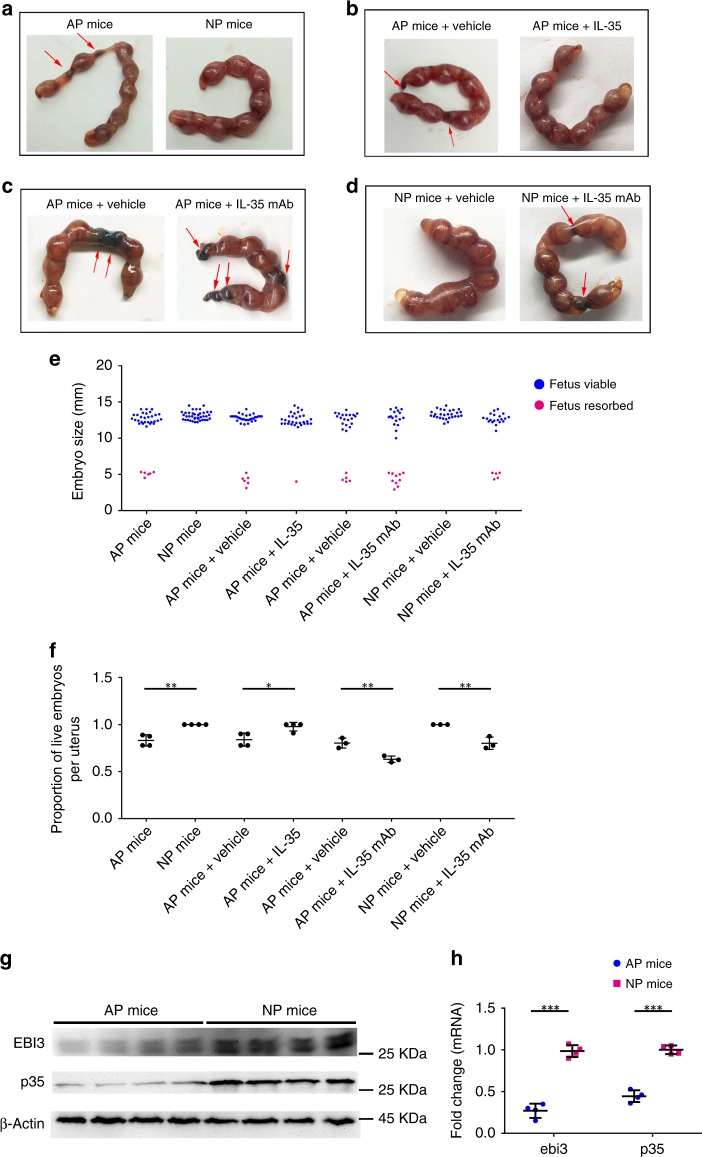
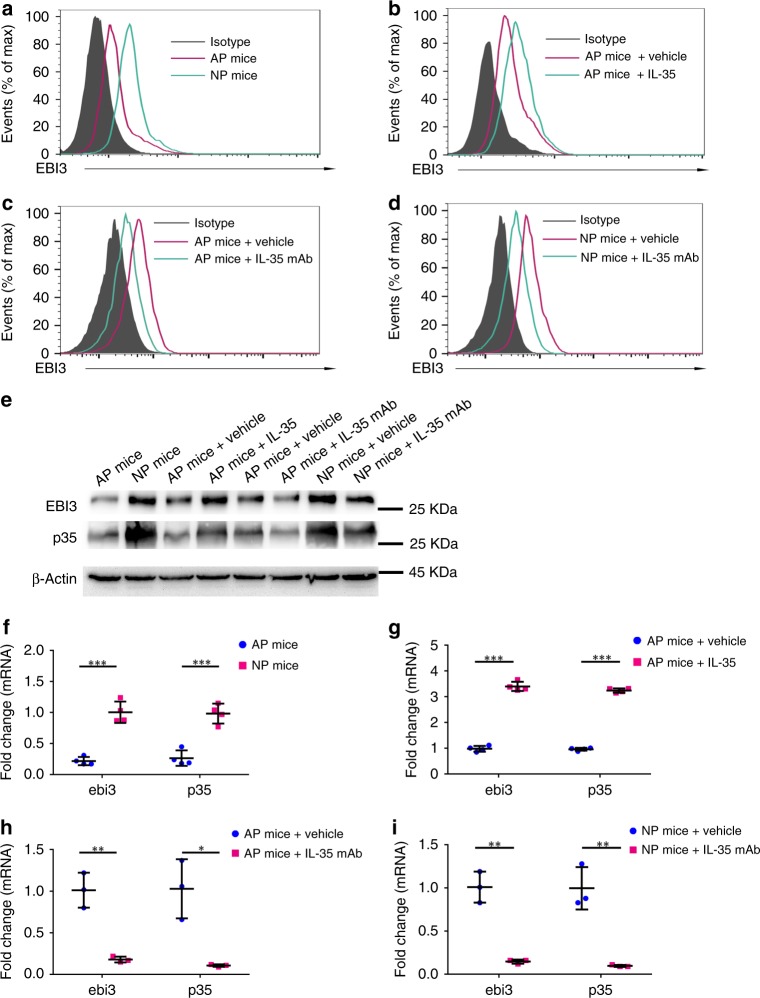
During pregnancy, trophoblast cells sustain the maternal-fetal tolerance via expressing and secreting various chemokines and cytokines. Our previous study revealed the expression of interleukin-35 (IL-35) in human first-trimester trophoblasts. Here we show that IL-35 is expressed in both human first-trimester primary trophoblast cells and a trophoblast cell line. Trophoblast cells inhibit the proliferation of human naive conventional T cells (Tconv cells) and convert suppressed Tconv cells into iTR35 in an IL-35-dependent manner. Mechanistically, trophoblast cell derived IL-35 mediates its function through phosphorylation of STAT1 and STAT3. In vivo studies confirm that mice with immunologically spontaneous abortion have lower levels of IL-35 and iTR35 cells at the maternal-fetal interface, and neutralizing anti-IL-35 mAb enhances abortion rates. Meanwhile, exogenous IL-35 induces iTR35 and prevents immunological abortion. Our findings thus suggest that trophoblast cells have a critical function in preserving maternal-fetal tolerance via secreting IL-35 during pregnancy.


Conflict of interest statement

The authors declare no competing interests.

Figures

Fig. 1
Fig. 1
IL-35 is present in the human serum and trophoblast cells. a The serum from early pregnant women (left, n = 17) and age matched non-pregnant women (right, n = 13) were collected and IL-35 level was measured by ELISA. The detection range of IL-35 was 62.5–4000 pg ml−1. b The mRNA level of the two subunits of IL-35 (ebi3 and p35) in primary trophoblasts (PT) and HTR8 cells were detected by quantitative real-time RT-PCR analysis. The results were normalized to endogenous control (GAPDH) (n = 2). c ELISA of IL-35 content in the supernatant of HTR8 cells (n = 3). d Immunocytochemical staining of EBI3 and p35 in PT and HTR8 cells. Scale bar: 50 μm. e Immunofluorescence staining of EBI3 (red) and p35 (green) in HTR8 cells. Scale bar: 20 μm. Data in 1a were represented as median with interquartile range. Significance was determined by Mann–Whitney U-test. Data in 1b and 1c were represented as mean ± SD. Significance was determined by Student’s t test analysis. ***P < 0.001
Fig. 2
Fig. 2
Trophoblast cells inhibit the proliferation of Tconv and mediate its conversion via secreting IL-35. Tconv cells were cultured in medium (control) alone, or with human r-sc-IL-35 (IL-35) (50 ng ml−1 or 100 ng ml−1), or with trophoblast cells supernatant (with or without neutralizing anti-IL-35 mAb) in presence of anti-CD3/anti-CD28 beads and IL-2 for 5 days. a Then, the proliferation of Tconv cells was evaluated by CCK8 assay (n = 4). b The protein levels of EBI3 and p35 in treated Tconv cells were determined by western blot (n = 3). c The mRNA levels of ebi3 (n = 4) and p35 (n = 3) in Tconv cells were detected by quantitative real-time RT-PCR. The results were normalized to endogenous control (GAPDH). d Flow cytometric analysis of EBI3 in treated Tconv cells. Cells were harvested and stained with anti-EBI3 or isotype-matched control antibody (Isotype) after activated with Cell Activation Cocktail (n = 3). Data were represented as mean ± SD. Significance was determined by Student’s t test analysis. *P < 0.05, **P < 0.01, and ***P < 0.001
Fig. 3
Fig. 3
Inhibitory phenotypic analysis of trophoblast cells-induced iTR35 cells. Tconv cells were cultured in medium alone, or with IL-35 or supernatant from trophoblast cells for 5 days. Then cells were harvested for flow cytometry analysis to detect the surface molecules including CTLA-4, CD73, and LAG-3. Density plots showing percentages of CTLA-4+, CD73+, and LAG-3+ cells among Tconv cells (left) and the corresponding statistical analysis (right) (n = 3). Data were represented as mean ± SD. Significance was determined by paired Student’s t test analysis. *P < 0.05
Fig. 4
Fig. 4
Cytokines secretion profile evaluation of Tconv cells induced by trophoblast cells-derived IL-35 and the related transcription factors which mediate the conversion. a Tconv cells were cultured in medium (control) alone, or with human r-sc-IL-35 (IL-35) (50 ng ml−1), or with trophoblast cells supernatant (with or without neutralizing anti-IL-35 mAb) for 5 days. Then the supernatants of activated Tconv cells were collected for cytokines secretion profile evaluation using Bio-Plex Protein Array system. In Tconv cells co-cultured with supernatant from PT or HTR8 cells, final results of cytokines concentration were normalized to the initial supernatant from PT or HTR8 cells, respectively, which were used as inner control (n = 2). b Tconv cells were cultured in medium (control), or with human r-sc-IL-35 (IL-35) (50 ng ml−1 or 100 ng ml−1), or with trophoblast cells (PT and HTR8) supernatant for 1 h. Then, Tconv cells were collected and the protein levels of phosphorylated (p) and total STAT1, STAT3, and STAT4 were determined by western blot (n = 3). Data were represented as mean ± SD. Significance was determined by Student’s t-test. *P < 0.05 and **P < 0.01
Fig. 5
Fig. 5
Phenotype of fetuses from NP mice and AP mice and the expression of IL-35 in the placenta. Pregnant CBA/J female mice were euthanized on Day 13.5 of pregnancy. ad Representative pictures showing the embryos and live fetuses per uterus from different treated AP and NP mice. Red arrows: aborted embryos. e Embryos size were measured. From left to right: n = 35 embryos from four separate mothers (AP mice), n = 39 embryos from four separate mothers (NP mice), n = 38 embryos from four separate mothers (AP mice + vehicle), n = 31 embryos from four separate mothers (AP mice + IL-35), n = 25 embryos from three separate mothers (AP mice + vehicle), n = 27 embryos from three separate mothers (AP mice + IL-35 mAb), n = 28 embryos from three separate mothers (NP mice + vehicle) and n = 25 embryos from three separate mothers (NP mice + IL-35 mAb). f Proportion of live embryos per uterus was calculated with following formula: Proportion of live embryos per uterus = (Number of live embryos per uterus)/(Number of total embryos per uterus). gh Pregnant CBA/J female mice were euthanized on Day 13.5 of pregnancy and the placenta was isolated and teased apart. Then the protein and mRNA were extracted from the tissue. The protein levels of EBI3 and p35 in placenta were determined by western blot (n = 4) (g). Quantitative real-time RT-PCR analysis was applied to compare the expression of ebi3 and p35 in the placenta of NP and AP females (n = 4) (h). Data were represented as mean ± SD. Significance was determined by Student’s t-test. *P < 0.05, **P < 0.01, and ***P < 0.001
Fig. 6
Fig. 6
IL-35 expression pattern in Tconv cells from different treated NP or AP mice. Pregnant CBA/J female mice were euthanized on Day 13.5 of pregnancy, the decidua was isolated and teased apart. ad Tconv cells were isolated from the decidua and stained with anti-EBI3 or isotype-matched control antibody (Isotype) for flow cytometry analysis. e The protein levels of EBI3 and p35 in Tconv cells were determined by western blot. fi The mRNA level of ebi3 and p35 in decidual Tconv cells were analyzed using quantitative real-time RT-PCR analysis. The results were normalized to endogenous control (GAPDH). f n = 4 for AP mice group, n = 4 for NP mice group. g n = 4 for AP mice + vehicle group, n = 4 for AP mice + IL-35 group. h n = 3 for AP mice + vehicle group, n = 3 for AP mice + IL-35 mAb group. i n = 3 for NP mice + vehicle group, n = 3 for NP mice + IL-35 mAb group. Data were represented as mean ± SD. Significance was determined by Student’s t-test. *P < 0.05, **P < 0.01, and ***P < 0.001

References

    1. Cui Y, et al. Role of corin in trophoblast invasion and uterine spiral artery remodelling in pregnancy. Nature. 2012;484:246. doi: 10.1038/nature10897. - DOI - PMC - PubMed
    1. Chen SJ, Liu YL, Sytwu HK. Immunologic regulation in pregnancy: from mechanism to therapeutic strategy for immunomodulation. Clin. Dev. Immunol. 2012;2012:258391. - PMC - PubMed
    1. Prabhudas M, et al. Immune mechanisms at the maternal–fetal interface: perspectives and challenges. Nat. Immunol. 2015;16:328–334. doi: 10.1038/ni.3131. - DOI - PMC - PubMed
    1. Du MR, et al. Embryonic trophoblasts induce decidual regulatory T cell differentiation and maternal–fetal tolerance through thymic stromal lymphopoietin instructing dendritic cells. J. Immunol. 2014;192:1502–1511. doi: 10.4049/jimmunol.1203425. - DOI - PMC - PubMed
    1. Ramhorst R, et al. Modulation and recruitment of inducible regulatory t cells by first trimester trophoblast cells. Am. J. Reprod. Immunol. 2012;67:17. doi: 10.1111/j.1600-0897.2011.01056.x. - DOI - PMC - PubMed

Publication types

MeSH terms