. 2019 Oct 10;9(1):14647.
doi: 10.1038/s41598-019-50690-3.

Experimental validation of force inference in epithelia from cell to tissue scale

Affiliations

Experimental validation of force inference in epithelia from cell to tissue scale

Weiyuan Kong et al. Sci Rep. .

Abstract

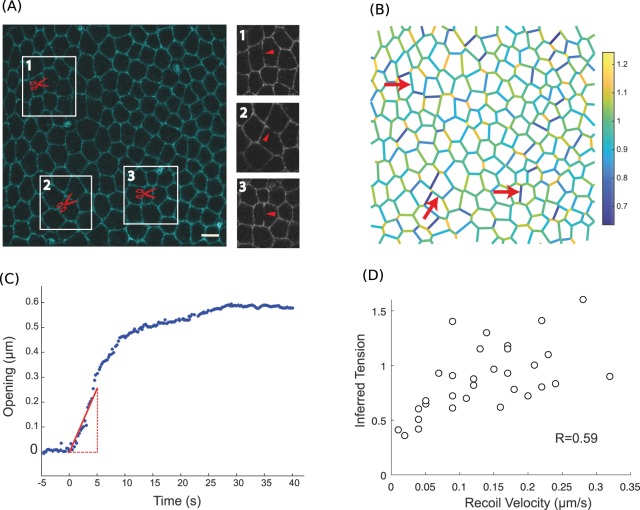
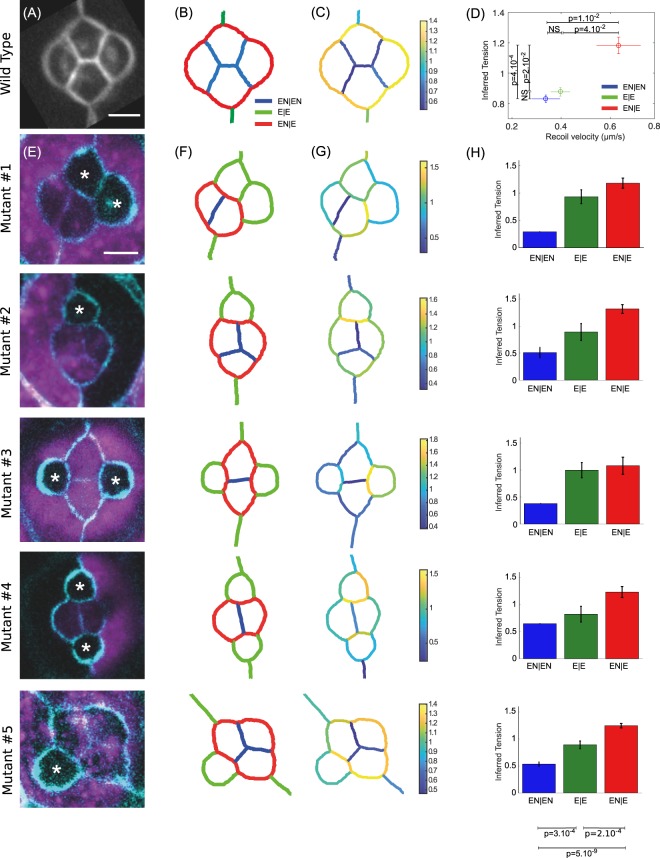
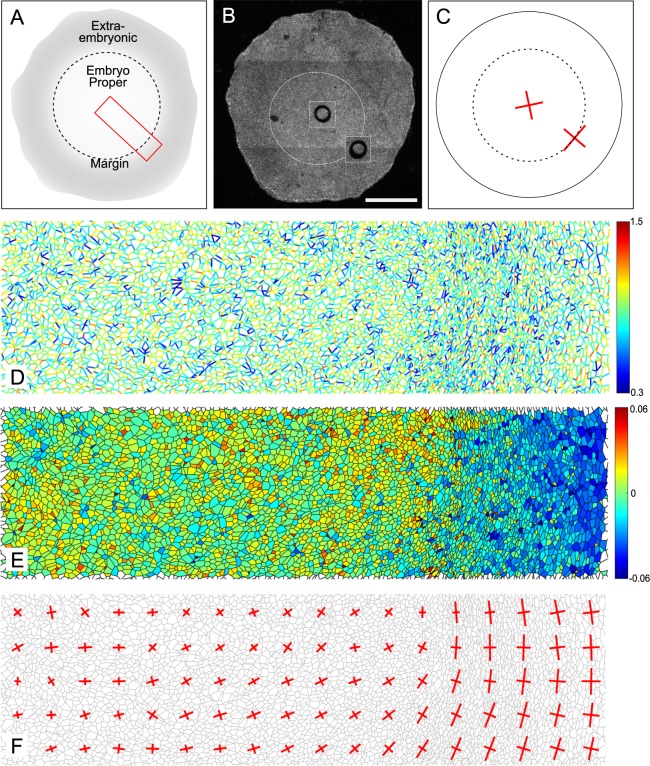
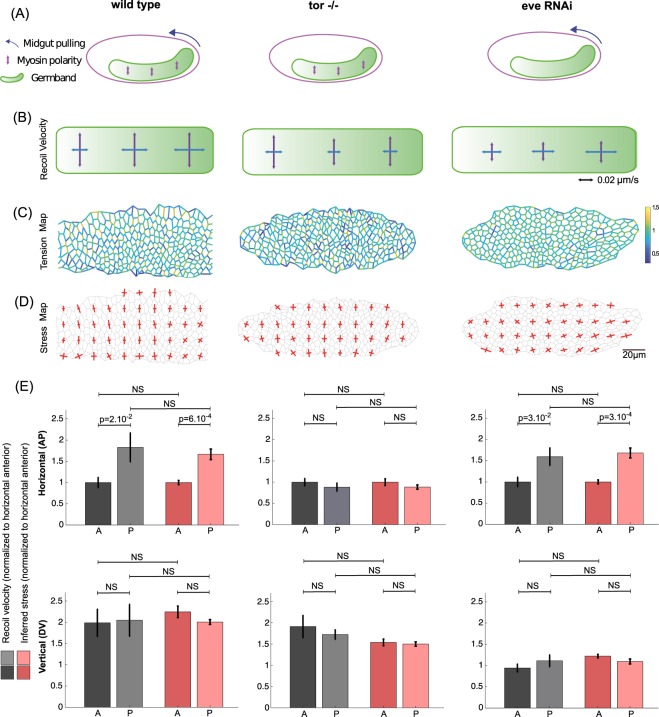
Morphogenesis relies on the active generation of forces, and the transmission of these forces to surrounding cells and tissues. Hence measuring forces directly in developing embryos is an essential task to study the mechanics of development. Among the experimental techniques that have emerged to measure forces in epithelial tissues, force inference is particularly appealing. Indeed it only requires a snapshot of the tissue, as it relies on the topology and geometry of cell contacts, assuming that forces are balanced at each vertex. However, establishing force inference as a reliable technique requires thorough validation in multiple conditions. Here we performed systematic comparisons of force inference with laser ablation experiments in four epithelial tissues from two animals, the fruit fly and the quail. We show that force inference accurately predicts single junction tension, tension patterns in stereotyped groups of cells, and tissue-scale stress patterns, in wild type and mutant conditions. We emphasize its ability to capture the distribution of forces at different scales from a single image, which gives it a critical advantage over perturbative techniques such as laser ablation. Overall, our results demonstrate that force inference is a reliable and efficient method to quantify the mechanical state of epithelia during morphogenesis, especially at larger scales when inferred tensions and pressures are binned into a coarse-grained stress tensor.


Conflict of interest statement

The authors declare no competing interests.

Figures

Figure 1
Figure 1
Force inference at the single junction scale in the Drosophila notum. (A) Subregion of the Drosophila notum 21 h after pupa formation. Scissors show ablation spots where recoil velocities will be measured. Insets show post-ablation snapshots of the considered junctions. Scale bar: 5 μm. (B) Inferred tension map of the tissue region in (A) before the ablations. Red arrows indicate the location of ablations, where inferred tensions are extracted and compared to experimental recoil velocities. (C) Opening dynamics and initial recoil velocity. The red line shows a linear fit of the first 5 seconds, which is used to determine the initial recoil velocity. (D) Inferred tension vs. opening velocity (N = 31 laser cuts from 10 pupae). Pearson’s correlation coefficient is 0.59. Spearman’s correlation coefficient is 0.63.
Figure 2
Figure 2
Force inference in the Drosophila retina. (A) The four cone cells of a WT ommatidium. The image results from an average over N = 51 ommatidia. Scale bar: 5 μm. (B) Segmented version of (A), and nomenclature of the junction types: EN|EN junctions in blue, E|E in green, and EN|E in red. (C) Map of inferred tensions. (D) Mean inferred tension vs. mean recoil velocity for each junction type (EN|EN: N = 19, E|E: N = 16, EN|E: N = 22). (E) Five different mutant configurations generated from the mosaic experiments. WT cells are in purple. Starred cells do not express N-Cad. This only affects cone cells, as surrounding cells do not express N-Cad. Scale bar: 5 μm. (F) Pattern of junction types for each configuration. (G) Map of inferred tension in a single ommatidium for each configuration. (H) Average inferred tension for each junction type in each configuration (statistical tests at the bottom pull the five mutant configurations together).
Figure 3
Figure 3
Tissue-scale force inference in the quail embryo. (A) Schematics of the embryonic and extra-embryonic territories. The red box shows the radial region analyzed with force inference. (B) Typical regions used for ablations in the embryonic region and in the posterior margin region. Images 2 minutes after a cut are superimposed on the original image. Scale bar: 1 mm (C) Strain measured in the embryonic and margin regions 2 minutes after the cut (N = 7 from 4 embryos). Red crosses show the principal directions and amplitudes of tissue strain measured 2 minutes after the cuts. (D) Map of inferred tensions. (E) Map of inferred pressures. (F) Map of inferred stress. Red crosses show the principal directions and amplitudes of the stress tensor.
Figure 4
Figure 4
Tissue scale force inference in the Drosophila germband. (A) Scheme of stress sources in the germband. In the WT condition (left), Myo-II polarity generates stress along the DV axis, and posterior midgut invagination pulls on the germband from its posterior side. In the Tor−/− condition (middle), posterior midgut invagination is abolished, and Myo-II polarity is preserved. In the Eve RNAi condition (right), posterior midgut invagination is preserved, and Myo-II polarity is abolished. (B) Recoil velocities measured with PIV for each condition in the anterior, middle and posterior regions of the germband. Vertical arrows correspond to opening velocities along the DV axis (cuts along the AP axis), and horizontal arrows correspond to opening velocities along the AP axis (cuts along the DV axis). Each arrow results from an average over N = 7 to N = 34 experiments. (C) Map of inferred tension, in a representative germband for each condition. (D) Map of inferred stress. Red crosses show the principal directions and amplitudes of the stress tensor. (E) Bar plots of normalized recoil velocity and inferred stress in the horizontal direction (top row) and in the vertical direction (bottom row) for each condition. A stands for anterior, P for posterior. Anterior (resp. posterior) inferred stress is computed as an average over the three most anterior (resp. posterior) columns of (D).

References

    1. Heisenberg, C. P. & Bellaïche, Y. Forces in tissue morphogenesis and patterning. Cell153 (2013). - PubMed
    1. Bertet C, Sulak L, Lecuit T. Myosin-dependent junction remodelling controls planar cell intercalation and axis elongation. Nature. 2004;429:667–71. doi: 10.1038/nature02590. - DOI - PubMed
    1. Rauzi M, Verant P, Lecuit T, Lenne P-F. Nature and anisotropy of cortical forces orienting Drosophila tissue morphogenesis. Nat. Cell Biol. 2008;10:1401–10. doi: 10.1038/ncb1798. - DOI - PubMed
    1. Fernandez-Gonzalez R, et al. Myosin II Dynamics Are Regulated by Tension in Intercalating Cells. Dev. Cell. 2009;17:736–743. doi: 10.1016/j.devcel.2009.09.003. - DOI - PMC - PubMed
    1. Lye CM, et al. Mechanical Coupling between Endoderm Invagination and Axis Extension in Drosophila. PLoS Biol. 2015;13:1–27. doi: 10.1371/journal.pbio.1002292. - DOI - PMC - PubMed

Publication types

LinkOut - more resources