

SMRT sequencing of full-length transcriptome of seagrasses Zostera japonica
- PMID: 31601990
- PMCID: PMC6787188
- DOI: 10.1038/s41598-019-51176-y
SMRT sequencing of full-length transcriptome of seagrasses Zostera japonica
Abstract
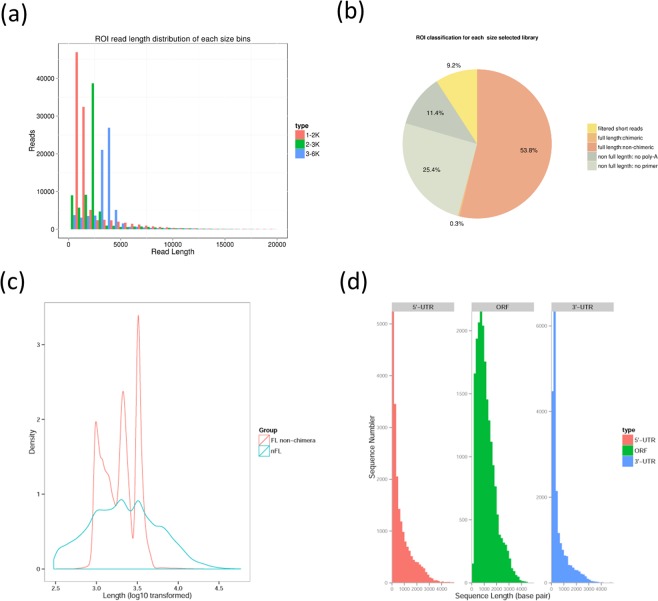
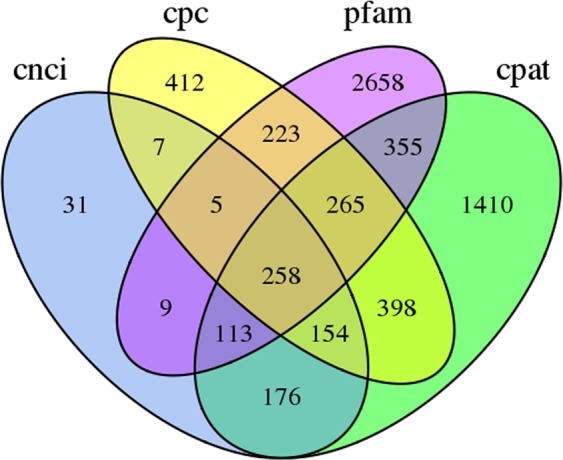
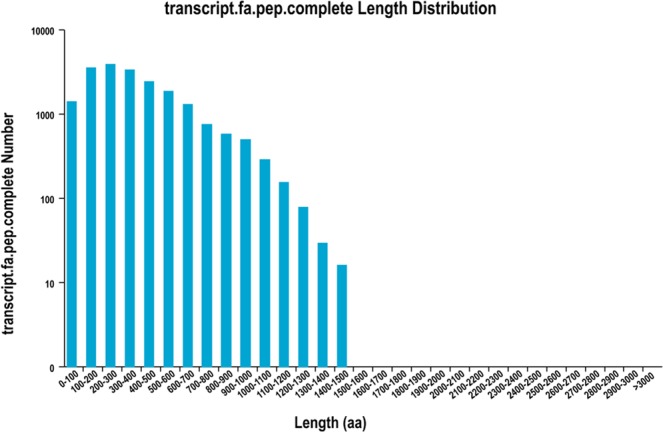
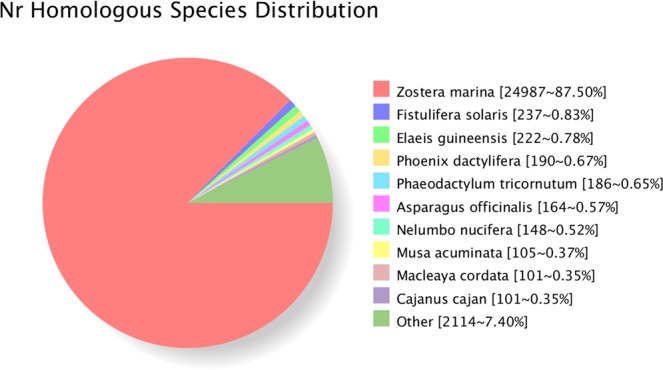
Seagrass meadows are among the four most productive marine ecosystems in the world. Zostera japonica (Z. japonica) is the most widely distributed species of seagrass in China. However, there is no reference genome or transcriptome available for Z. japonica, impeding progress in functional genomic and molecular ecology studies in this species. Temperature is the main factor that controls the distribution and growth of seagrass around the world, yet how seagrass responds to heat stress remains poorly understood due to the lack of genomic and transcriptomic data. In this study, we applied a combination of second- and third-generation sequencing technologies to sequence full-length transcriptomes of Z. japonica. In total, we obtained 58,134 uniform transcripts, which included 46,070 high-quality full-length transcript sequences. We identified 15,411 simple sequence repeats, 258 long non-coding RNAs and 28,038 open reading frames. Exposure to heat elicited a complex transcriptional response in genes involved in posttranslational modification, protein turnover and chaperones. Overall, our study provides the first large-scale full-length trascriptome in Zostera japonica, allowing for structural, functional and comparative genomics studies in this important seagrass species. Although previous studies have focused specifically on heat shock proteins, we found that examination of other heat stress related genes is important for studying response to heat stress in seagrass. This study provides a genetic resource for the discovery of genes related to heat stress tolerance in this species. Our transcriptome can be further utilized in future studies to understand the molecular adaptation to heat stress in Zostera japonica.
Conflict of interest statement
The authors declare no competing interests.
Figures
Similar articles
-
Heat-stress induced expression of stress-inducible nucleotide exchange factor Fes1 in seagrass Zostera japonica.Ecotoxicology. 2020 Sep;29(7):932-940. doi: 10.1007/s10646-020-02185-5. Epub 2020 Mar 11. Ecotoxicology. 2020. PMID: 32162033
-
Genome-wide transcriptomic responses of the seagrasses Zostera marina and Nanozostera noltii under a simulated heatwave confirm functional types.Mar Genomics. 2014 Jun;15:65-73. doi: 10.1016/j.margen.2014.03.004. Epub 2014 Apr 3. Mar Genomics. 2014. PMID: 24703884
-
Effects of salinity and temperature on seed germination and seedling establishment in the endangered seagrass Zostera japonica Asch. & Graebn. in northern China.Mar Pollut Bull. 2019 Sep;146:848-856. doi: 10.1016/j.marpolbul.2019.07.037. Epub 2019 Jul 24. Mar Pollut Bull. 2019. PMID: 31426227
-
Understanding trends in Zostera research, stressors, and response variables: a global systematic review of the seagrass genus.PeerJ. 2025 Apr 17;13:e19209. doi: 10.7717/peerj.19209. eCollection 2025. PeerJ. 2025. PMID: 40256742 Free PMC article.
-
Trends in seagrass research in the 21st century - are we there yet?Mar Environ Res. 2025 Aug;209:107198. doi: 10.1016/j.marenvres.2025.107198. Epub 2025 Apr 29. Mar Environ Res. 2025. PMID: 40334330 Review.
Cited by
-
Overexpression of seagrass DnaJ gene ZjDjB1 enhances the thermotolerance of transgenic arabidopsis thaliana.Physiol Mol Biol Plants. 2021 Sep;27(9):2043-2055. doi: 10.1007/s12298-021-01063-6. Epub 2021 Sep 18. Physiol Mol Biol Plants. 2021. PMID: 34629777 Free PMC article.
-
Full-Length Transcriptome Maps of Reef-Building Coral Illuminate the Molecular Basis of Calcification, Symbiosis, and Circadian Genes.Int J Mol Sci. 2022 Sep 22;23(19):11135. doi: 10.3390/ijms231911135. Int J Mol Sci. 2022. PMID: 36232445 Free PMC article.
-
RNA Transcript Diversity in Neuromuscular Research.J Neuromuscul Dis. 2023;10(4):473-482. doi: 10.3233/JND-221601. J Neuromuscul Dis. 2023. PMID: 37182892 Free PMC article. Review.
-
Single-molecule real-time sequencing of the full-length transcriptome of Halophila beccarii.Sci Rep. 2022 Sep 30;12(1):16444. doi: 10.1038/s41598-022-20988-w. Sci Rep. 2022. PMID: 36180578 Free PMC article.
-
SMRT Sequencing Reveals Candidate Genes and Pathways With Medicinal Value in Cipangopaludina chinensis.Front Genet. 2022 Jun 16;13:881952. doi: 10.3389/fgene.2022.881952. eCollection 2022. Front Genet. 2022. PMID: 35783279 Free PMC article.
References
-
- Eid J, et al. Real-time DNA sequencing from single polymerase molecules. Science. 2010;472:431–455. - PubMed
-
- Janetos AC. Climate Change 1995: Impacts, Adaptations and Mitigation of Climate Change: Scientific-Technical Analyses. The Quarterly Review of Biology. 1998;78:465–477.
Publication types
MeSH terms
Substances
LinkOut - more resources
Full Text Sources
