. 2019 Oct 4:2:360.
doi: 10.1038/s42003-019-0599-8. eCollection 2019.

3D mapping reveals network-specific amyloid progression and subcortical susceptibility in mice

Affiliations

3D mapping reveals network-specific amyloid progression and subcortical susceptibility in mice

Rebecca Gail Canter et al. Commun Biol. .

Abstract

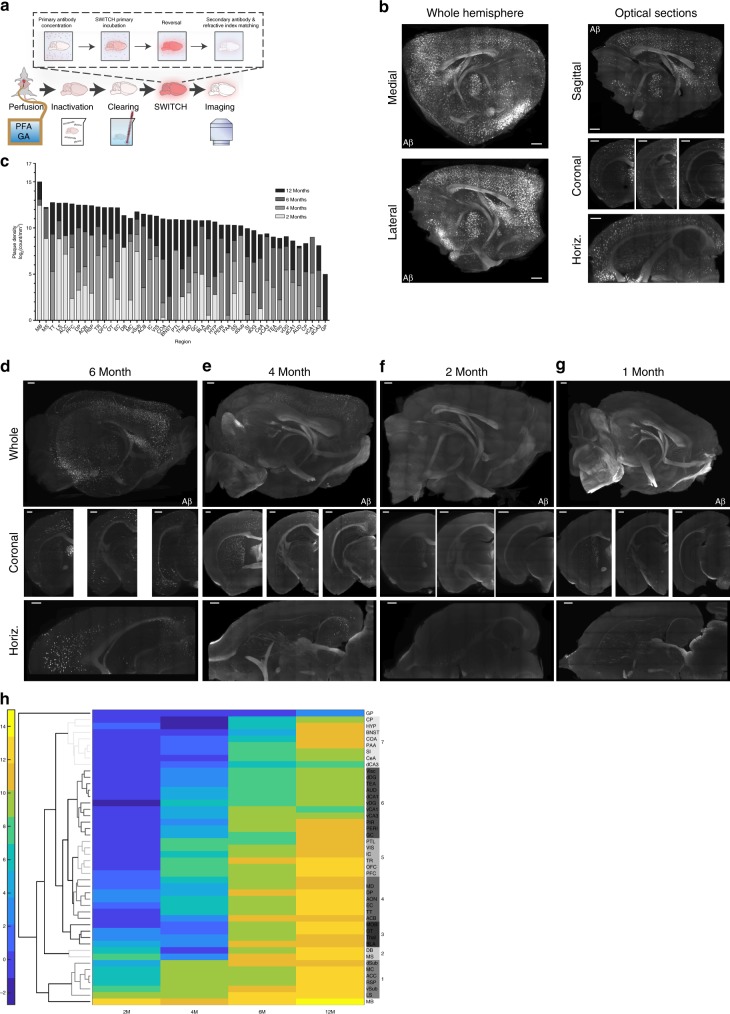
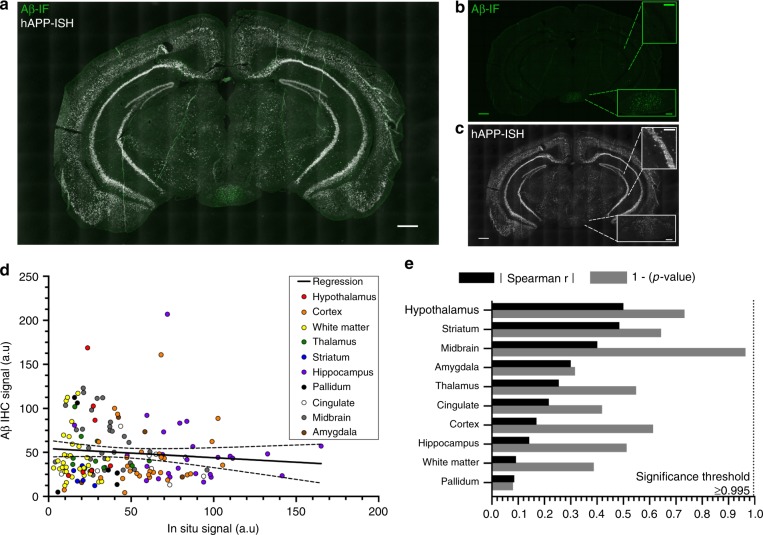
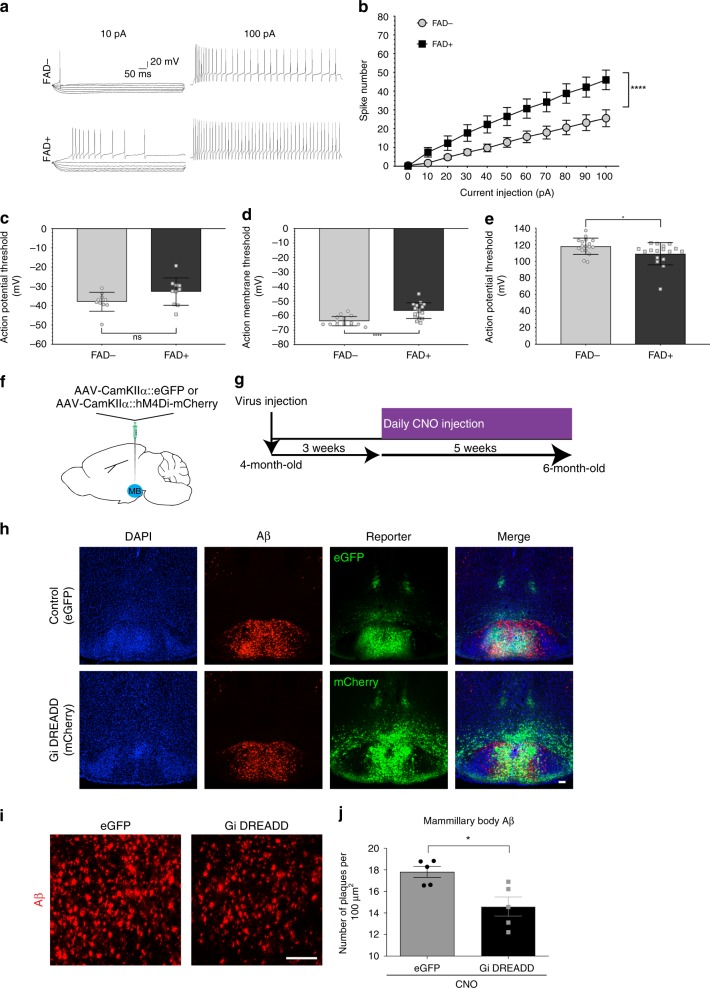
Alzheimer's disease (AD) is a progressive, neurodegenerative dementia with no cure. Prominent hypotheses suggest accumulation of beta-amyloid (Aβ) contributes to neurodegeneration and memory loss, however identifying brain regions with early susceptibility to Aβ remains elusive. Using SWITCH to immunolabel intact brain, we created a spatiotemporal map of Aβ deposition in the 5XFAD mouse. We report that subcortical memory structures show primary susceptibility to Aβ and that aggregates develop in increasingly complex networks with age. The densest early Aβ occurs in the mammillary body, septum, and subiculum- core regions of the Papez memory circuit. Previously, early mammillary body dysfunction in AD had not been established. We also show that Aβ in the mammillary body correlates with neuronal hyper-excitability and that modulation using a pharmacogenetic approach reduces Aβ deposition. Our data demonstrate large-tissue volume processing techniques can enhance biological discovery and suggest that subcortical susceptibility may underlie early brain alterations in AD.

Keywords: Alzheimer's disease; Neural circuits.


Conflict of interest statement

Competing interestsThe authors declare no competing interests.

Figures

Fig. 1
Fig. 1
SWITCH labeling reveals Papez circuit vulnerability and network propagation of amyloid pathology. a Schematic of the System-Wide Control of Interaction Time and kinetics of Chemicals (SWITCH) protocol. b Representative images of amyloid labeling in a brain from a 12-month-old mouse. Whole hemisphere 2D images of the 3D-rendered brain from the medial and lateral view. Additional representative optical sections showing the sagittal distribution, horizontal distribution, and three coronal sections. Scale bars 1000 μm. c Amyloid density plot of average amyloid density for each age time point. N = 2 or 3/group. Log2-transformed deposit count/mm3of tissue. The data plotted in rank-order of 12-month animal density. Six-, 4-, and 2-month data overlaid on top of 12 M data for comparison. N = 1 (4 M); N = 2 (2 M, 6 M), N = 3 (12 M) independent biological samples. dg Representative images of amyloid labeling in brains from (d) 6-, (e) 4-, (f) 2-, (g) 1-month-old mice. Scale bars 500 μm. d There is significant amyloid deposition in cortex, as well as aggregates in the hippocampus, amygdala, and other limbic structures in 6-month-old brains. e Representative images from 4-month-old brains show significant accumulation in the default-mode-related frontal cortex, and regions that are part of the Papez circuit (e.g., septum, subiculum, mammillary body). f Optical sections from 2-month-old brains showing sparse amyloid labeling, except for accumulation in the mammillary body, septum, and subiculum. g In 1-month-old brains, only a few small deposits can be seen in the subiculum and mammillary body. h Hierarchical clustering of log2-transformed average density data by region. Euclidean distance, average linkage. Scale bar is not symmetric around 0. Optimal leaf order enabled, which plots most similar groups nearest each other in the graph. Colored branches represent groups labeled on right y-axis
Fig. 2
Fig. 2
Progression patterns cannot be described by transgenic mRNA expression. a Representative merged image of amyloid immunofluorescent labeling (green) and APP mRNA in situ hybridization (white). Scale bar 500 μm. b Unmerged image of amyloid immunofluorescence signal. Scale bar 500 μm. Insets show mammillary body area with significant Aβ accumulation and hippocampus with very little Aβ accumulation. Inset scale bars 150 μm. c Unmerged image of APP in situ hybridization. Scale bar 500 μm. Mammillary body area shows lower hAPP mRNA expression than the hippocampus. Inset scale bars 150 μm. d Correlation between amyloid-IF signal and APP in situ. Colored dots represent separately quantified regions. Linear regression and correlation analyses carried out on the combined data. Linear regression: Y = −0.1027*x + 54.28; F(1,157) = 1.333, p = 0.2501. No significant deviation from zero. Spearman r = −0.07284; p = 0.3616. e Spearman correlation for in situ hybridization–immunofluorescence data by region. Black bars represent Spearman rho, gray bar represents 1−p-value of Spearman correlation. Significance threshold alpha = 0.05 with Bonferonni correction for ten regions
Fig. 3
Fig. 3
MB shows significant functional alterations in young 5XFAD mice. a Representative traces of neuronal patch-clamp recordings from mammillary body slices from 5XFAD + (FAD + ) and 5 × FAD- (FAD-) at 10 pA and 100 pA. b Excitability curve showing the spike number from 5XFAD + and 5XFAD− mammillary body neurons at each current injection step from 0 to 100 pA. Repeated measures ANOVA. Genotype: F(1,31) = 7.166, p = 0.0118; current injection: F(10,310) = 94.22, p < 0.0001; interaction: F(10,310) = 6.855, p < 0.0001. N = 17 cells/group. Graph reports mean ± standard error. c Action potential threshold in mammillary body neurons is not significantly different between 5XFAD + and 5XFAD−. Unpaired Student’s t test; t(18) = 1.924, p = 0.0704. Each dot represents a single cell. Graph reports group mean ± standard deviation. d Resting membrane potential is significantly depolarized in 5XFAD mammillary body neurons compared with 5XFAD−. Difference between means = 7.24 mV. Unpaired Student’s t test; t(29) = 4.509, p < 0.0001. Each dot represents a single cell. Graph reports group mean ± standard deviation. e Action potential amplitude is significantly decreased in 5XFAD + mammillary body neurons compared with 5XFAD−. D’Agostino and Pearson normality test, FAD-: K2 = 0.6008, p = 0.7405, passed normality = yes; FAD + : K2 = 20.61, p < 0.0001, passed normality = no; Mann–Whitney U; U = 77, p = 0.0196. Each dot represents a single cell. Graph reports group mean ± standard deviation. f Cartoon illustrating the injection of AAV-CamKIIα::eGFP or AAV-CamKIIα::hM4Di-mCherry (Gi DREADD). g Diagram illustrating the time course of virus and CNO injections in the 5XFAD mice. h Images of the mammillary body in AAV-CamKIIα-EGFP or AAV-CamKIIα-hM4Di-mCherry (Gi DREADD) injected 5XFAD mice. DAPI (blue), Aβ (red), and reporter (green: EGFP or mCherry. Scale bar 100 μm. iJ Images (i) and quantification (j) of Aβ plaque (red) in the mammillary body of control and Gi DREADD mice. Scale bar 100 μm. Unpaired Student’s t test; t(8) = 3.137, p = 0.0139. *p < 0.05. N = 5 mice per group. Graph reports mean ± standard error

References

    1. Hurd MD, Martorell P, Delavande A, Mullen KJ, Langa KM. Monetary costs of dementia in the United States. N. Engl. J. Med. 2013;368:1326–1334. doi: 10.1056/NEJMsa1204629. - DOI - PMC - PubMed
    1. Hardy J, Higgins G. Alzheimer’s disease: the amyloid cascade hypothesis. Science. 1992;256:184–185. doi: 10.1126/science.1566067. - DOI - PubMed
    1. Musiek, E. S. & Holtzman, D. M. Three dimensions of the amyloid hypothesis: time, space and ‘ wingmen’. Nat. Neurosci. 18, 800 (2015). - PMC - PubMed
    1. Jack CR, et al. NIA-AA research framework: toward a biological definition of Alzheimer’s disease. Alzheimer’s. Dement. 2018;14:535–562. doi: 10.1016/j.jalz.2018.02.018. - DOI - PMC - PubMed
    1. Mutations | AlzForum. Available at: http://www.alzforum.org/mutations/ (Accessed October 20, 2016).

Publication types

Substances