. 2019 Nov 13;19(11):7957-7964.
doi: 10.1021/acs.nanolett.9b03134. Epub 2019 Oct 18.

Label-Free Detection of Post-translational Modifications with a Nanopore

Affiliations

Label-Free Detection of Post-translational Modifications with a Nanopore

Laura Restrepo-Pérez et al. Nano Lett. .

Abstract

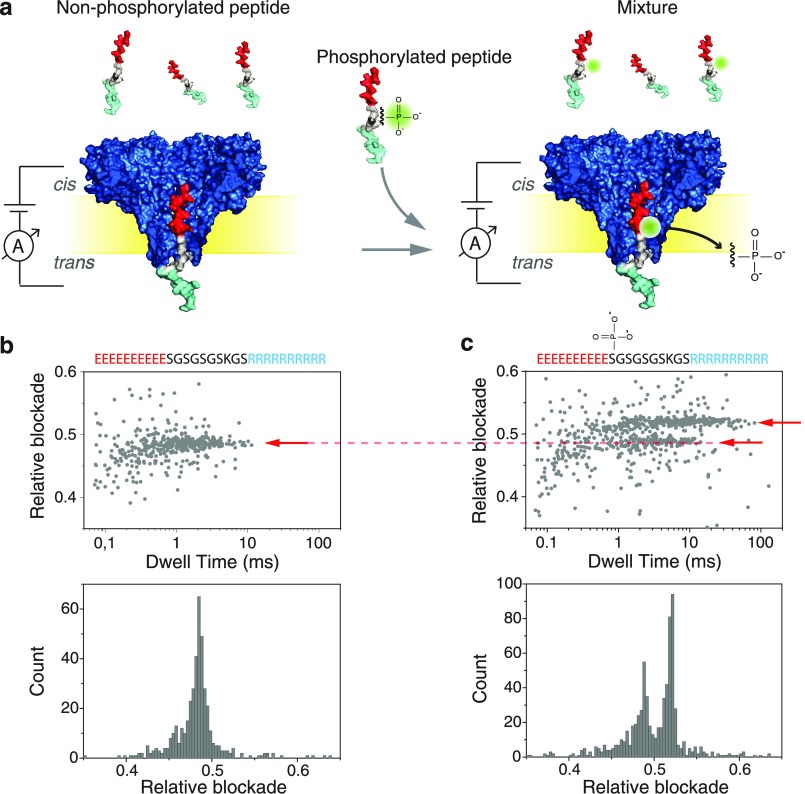
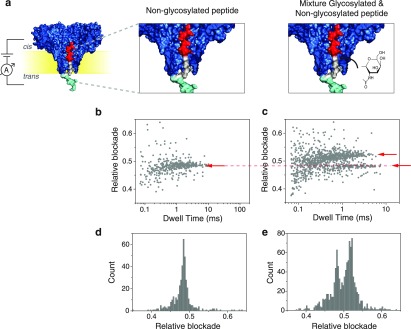
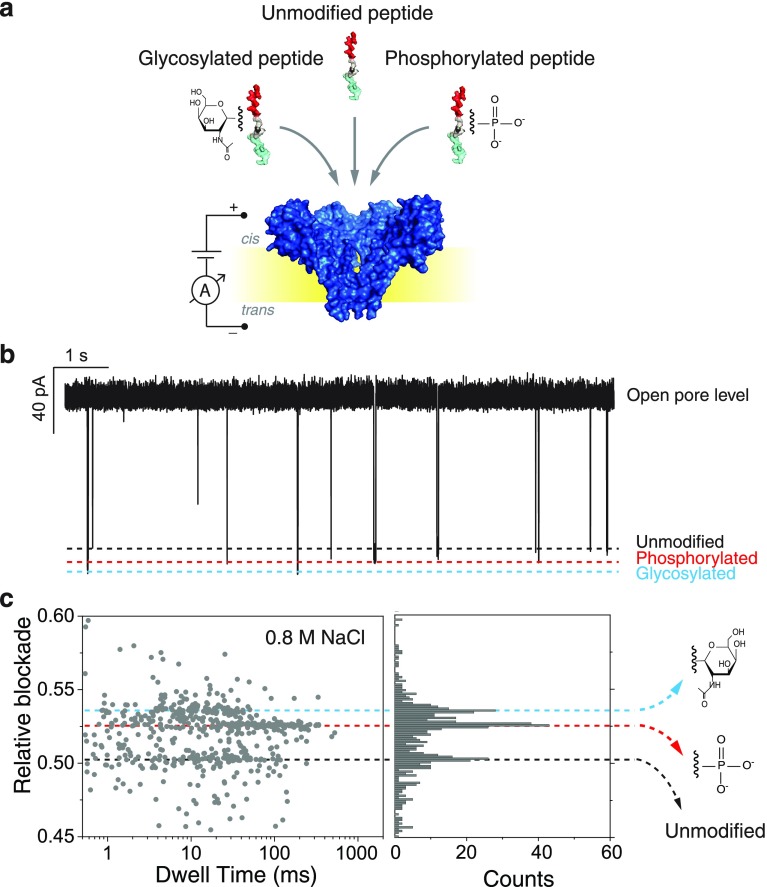
Post-translational modifications (PTMs) of proteins play key roles in cellular processes. Hence, PTM identification is crucial for elucidating the mechanism of complex cellular processes and disease. Here we present a method for PTM detection at the single-molecule level using FraC biological nanopores. We focus on two major PTMs, phosphorylation and glycosylation, that mutually compete for protein modification sites, an important regulatory process that has been implicated in the pathogenic pathways of many diseases. We show that phosphorylated and glycosylated peptides can be clearly differentiated from nonmodified peptides by differences in the relative current blockade and dwell time in nanopore translocations. Furthermore, we show that these PTM modifications can be mutually differentiated, demonstrating the identification of phosphorylation and glycosylation in a label-free manner. The results represent an important step for the single-molecule, label-free identification of proteoforms, which have tremendous potential for disease diagnosis and cell biology.

Keywords: Nanopores; glycosylation; label-free detection; phosphorylation; post-translational modifications.


Conflict of interest statement

The authors declare the following competing financial interest(s): L.R.P., C.D., and C.J. are co-founders and shareholders of Bluemics, a company engaged in the development of nanopore sensors for protein analysis.

Figures

Figure 1
Figure 1
(a) Schematic representation of the measurement setup, where peptides are driven through a FraC nanopore. Experiments were done with a nonphosphorylated peptide (left) and with an equimolar-concentration mixture of phosphorylated and nonphosphorylated peptides (right). (b) Scatter plot of relative blockade versus dwell time (top), and relative-blockade histogram (bottom) for the nonphosphorylated peptide. (c) Scatter plot of relative blockade versus dwell time for the mixture of phosphorylated and nonphosphorylated peptides. A second population with higher relative blockade is now visible, as shown by the arrows.
Figure 2
Figure 2
(a) Schematic representation of the measurements for the non-glycosylated peptides (left) and for an equimolar concentration mixture of glycosylated and non-glycosylated peptides (right). (b) Scatter plot of relative blockade versus dwell time for the non-glycosylated peptide. (c) Scatter plot of relative blockade versus dwell time for the mixture of glycosylated and non-glycosylated peptides. A second population with higher relative blockade is visible as shown by the arrows. (d) Relative blockade histogram of the non-glycosylated peptide. (e) Relative blockade histogram of the mixture of non-glycosylated and glycosylated peptide.
Figure 3
Figure 3
Dwell time histograms for the unmodified peptide (top), the glycosylated peptide (middle), and the phosphorylated peptide (bottom).
Figure 4
Figure 4
(a) Schematic representation of the measurement approach and (b) an example current trace obtained for a measurement on a mixture of the three peptides: the unmodified control peptide, the phosphorylated peptide and the glycosylated peptide. Data are taken at 0.8 M NaCl with pH 7.5. (c) Scatter plot of relative blockade vs dwell time and a relative blockade histogram of the mixture of the three peptides. Three different current blockade levels are observed. The first peak has a mean value of 0.502 (sd = 0.004), the second peak has a mean value of 0.526 (sd = 0.002), and the third peak has a mean value of 0.536 (sd = 0.003).

References

    1. Alberts; Johnson; Lewis; Raff; Roberts; Walter. Molecular Biology of the Cell; Garland Science, 2002. 10.1091/mbc.E14-10-1437 - DOI
    1. Aebersold R.; Agar J. N.; Amster I. J.; Baker M. S.; Bertozzi C. R.; Boja E. S.; Costello C. E.; Cravatt B. F.; Fenselau C.; Garcia B. A. How many human proteoforms are there?. Nat. Chem. Biol. 2018, 14 (3), 206–214. 10.1038/nchembio.2576. - DOI - PMC - PubMed
    1. Ponomarenko E. A. ; Poverennaya E. V.; Ilgisonis E. V.; Pyatnitskiy M. A.; Kopylov A. T.; Zgoda V. G.; Lisitsa A. V.; Archakov A. I. The Size of the Human Proteome: The Width and Depth. Int. J. Anal. Chem. 2016, 2016, 1–6. 10.1155/2016/7436849. - DOI - PMC - PubMed
    1. Duan G.; Walther D. The Roles of Post-translational Modifications in the Context of Protein Interaction Networks. PLoS Comput. Biol. 2015, 11, e100404910.1371/journal.pcbi.1004049. - DOI - PMC - PubMed
    1. Knorre D. G.; Kudryashova N. V.; Godovikova T. S. Chemical and functional aspects of posttranslational modification of proteins. Acta Naturae 2009, 1, 29–51. 10.32607/20758251-2009-1-3-29-51. - DOI - PMC - PubMed

Publication types