
Deep Neural Networks Improve Radiologists' Performance in Breast Cancer Screening

Nan Wu et al. IEEE Trans Med Imaging. 2020 Apr.

Abstract

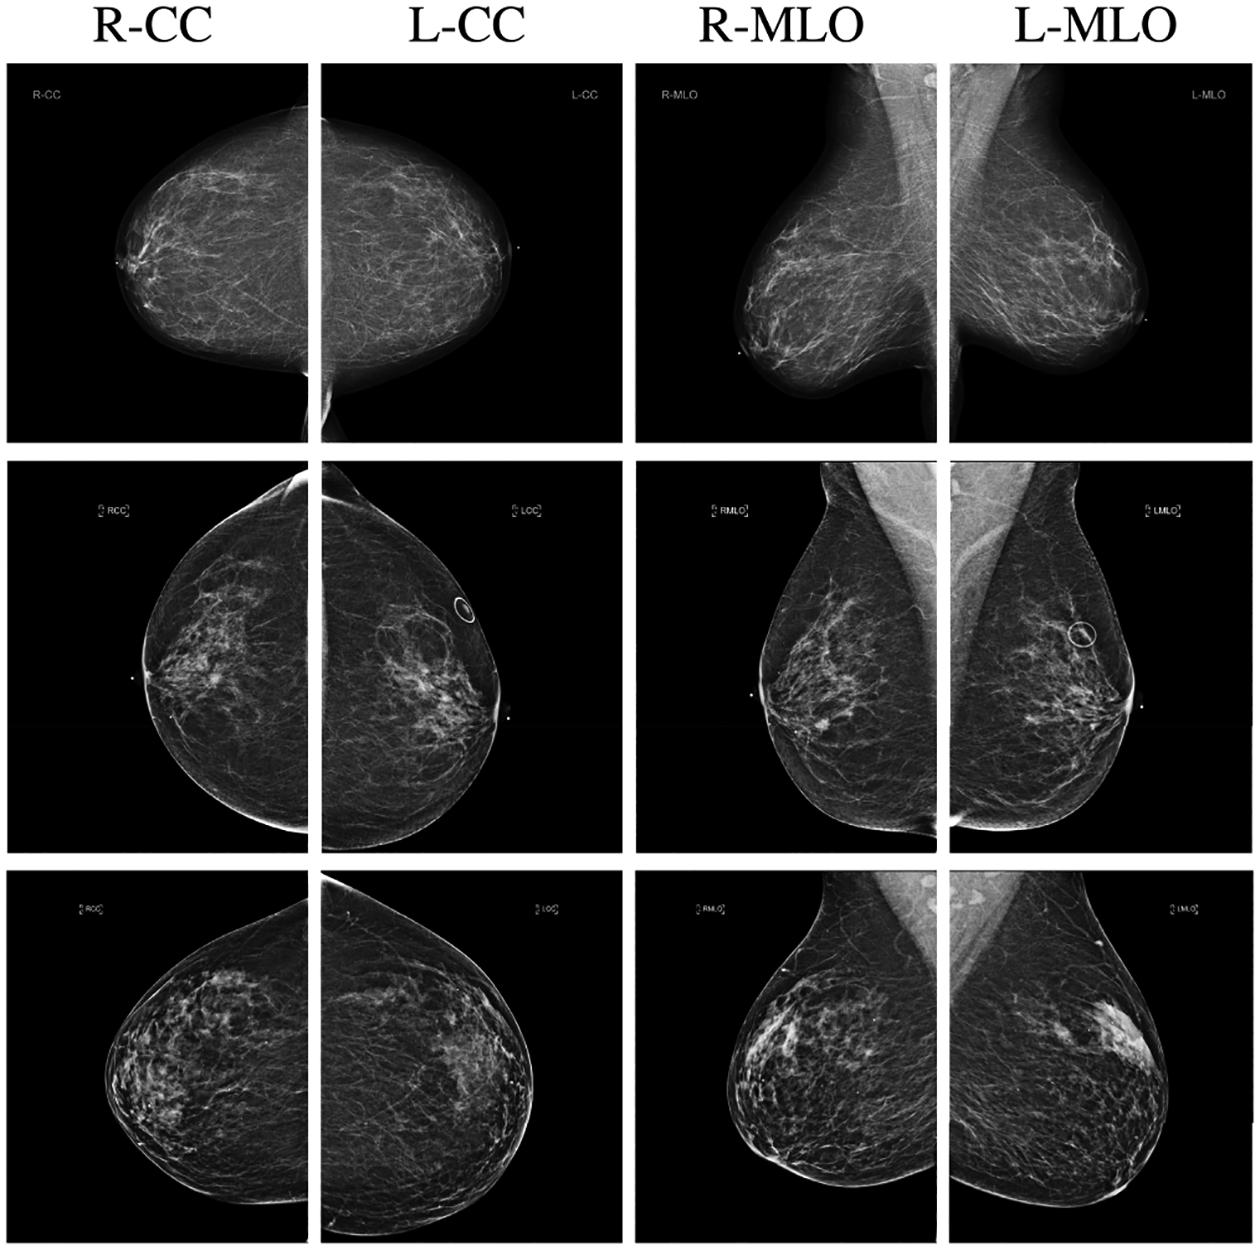
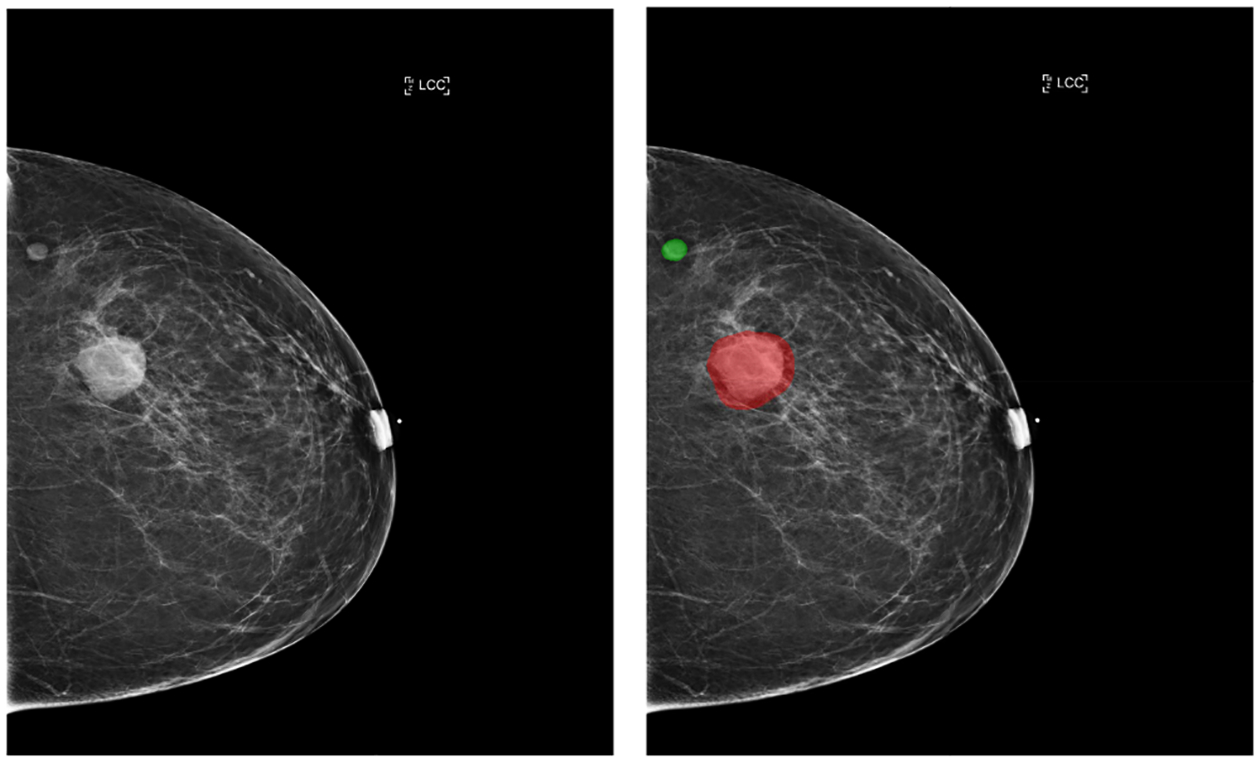
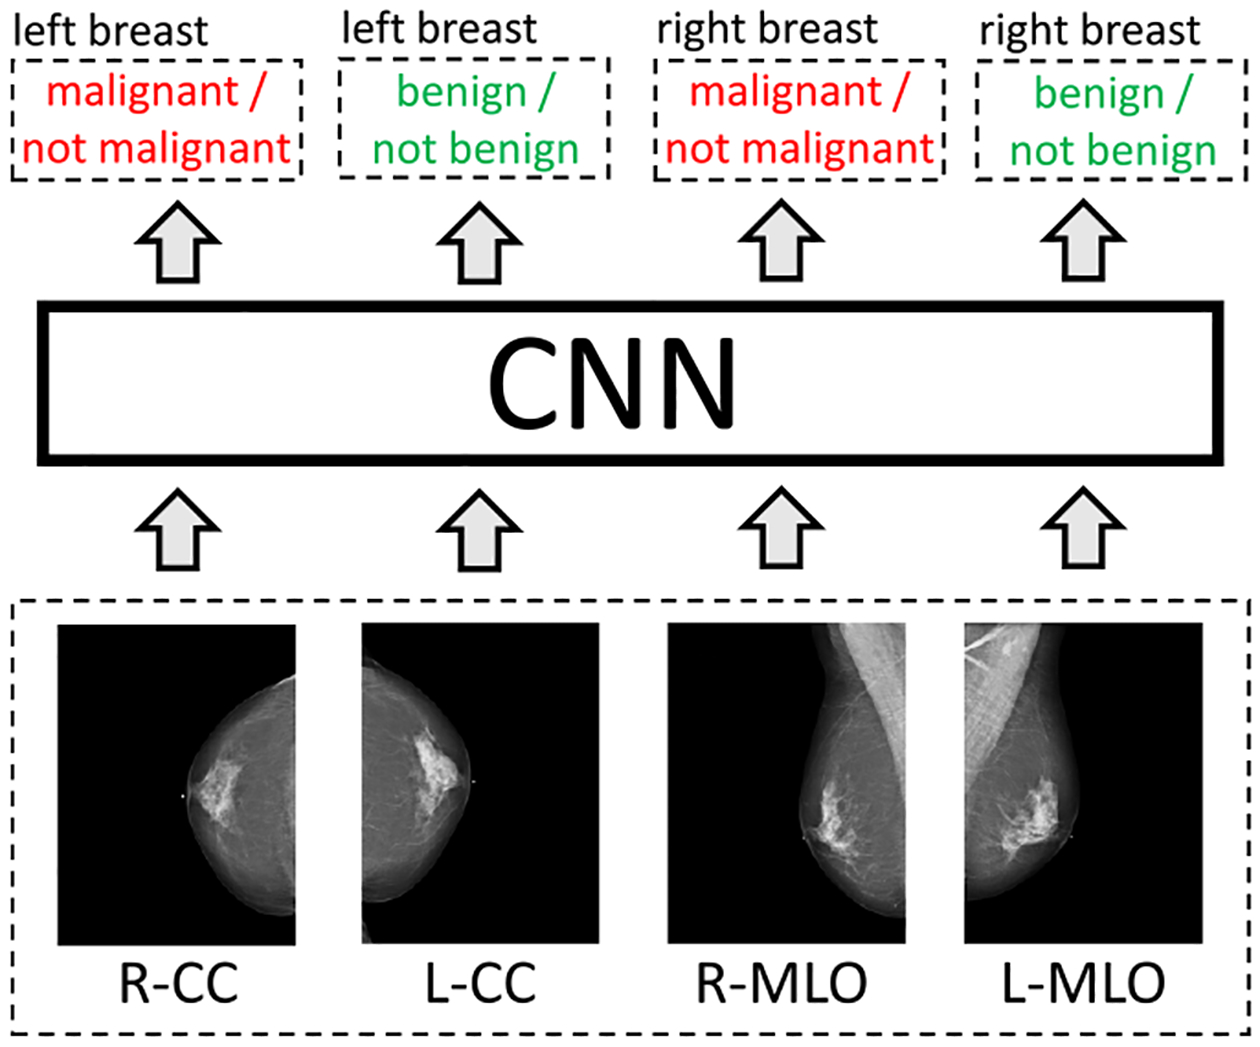
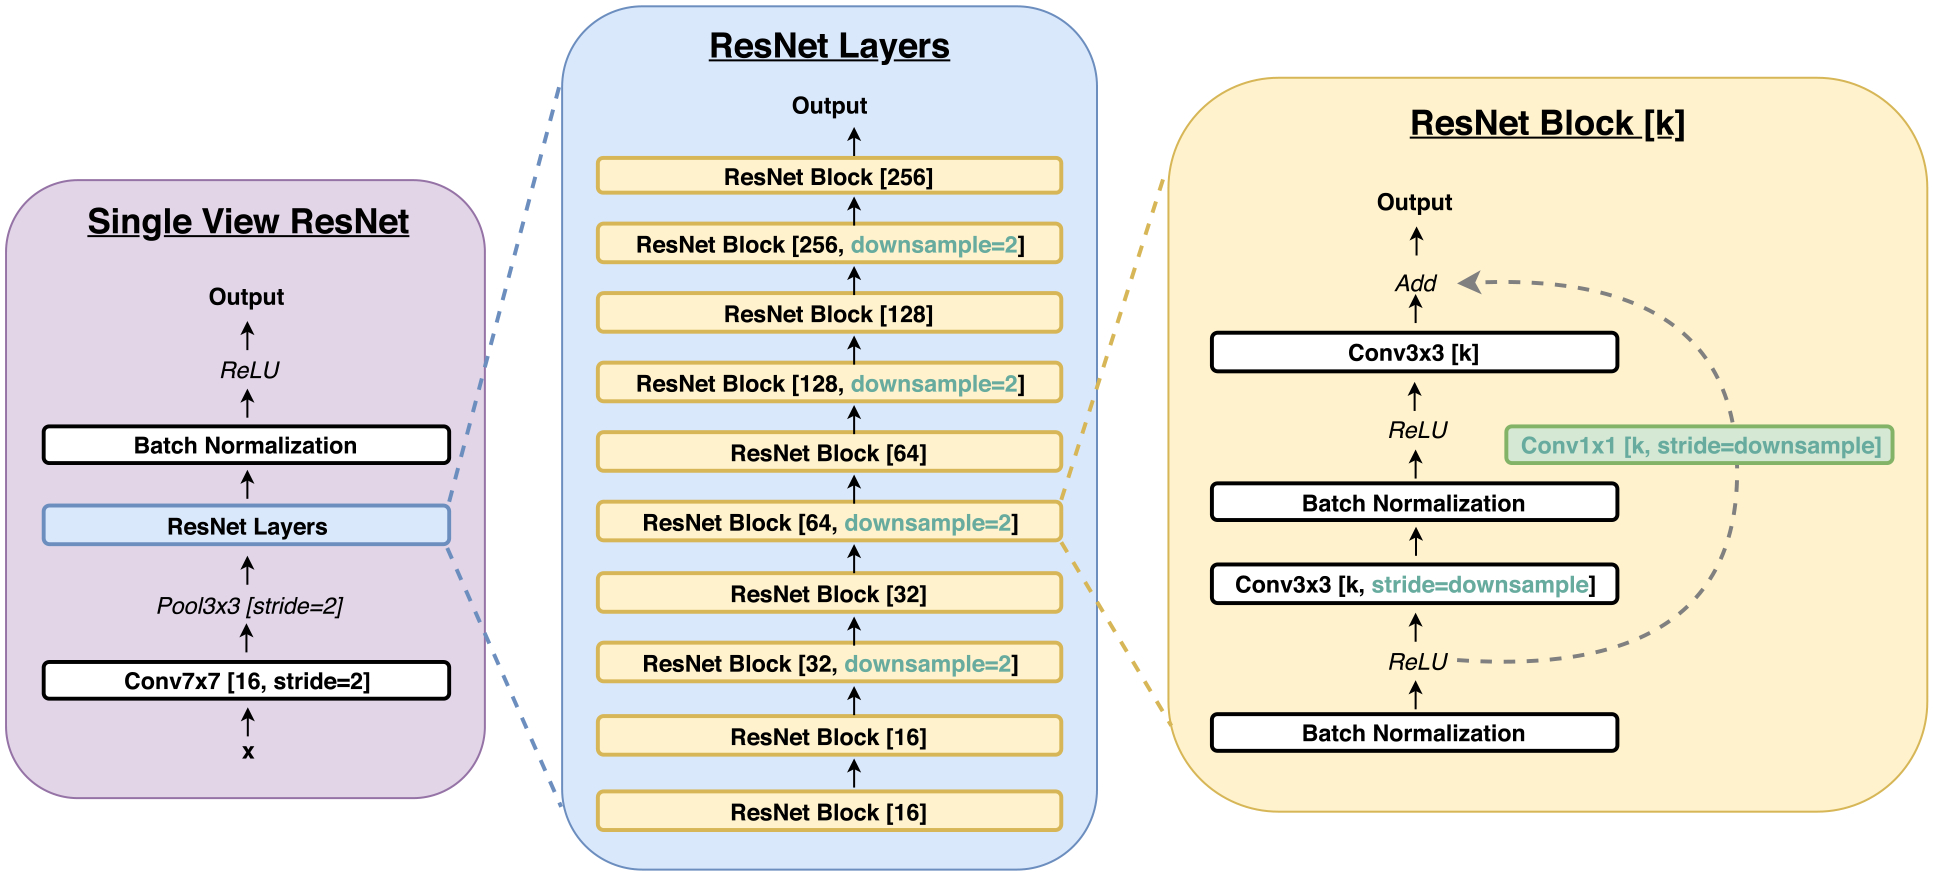
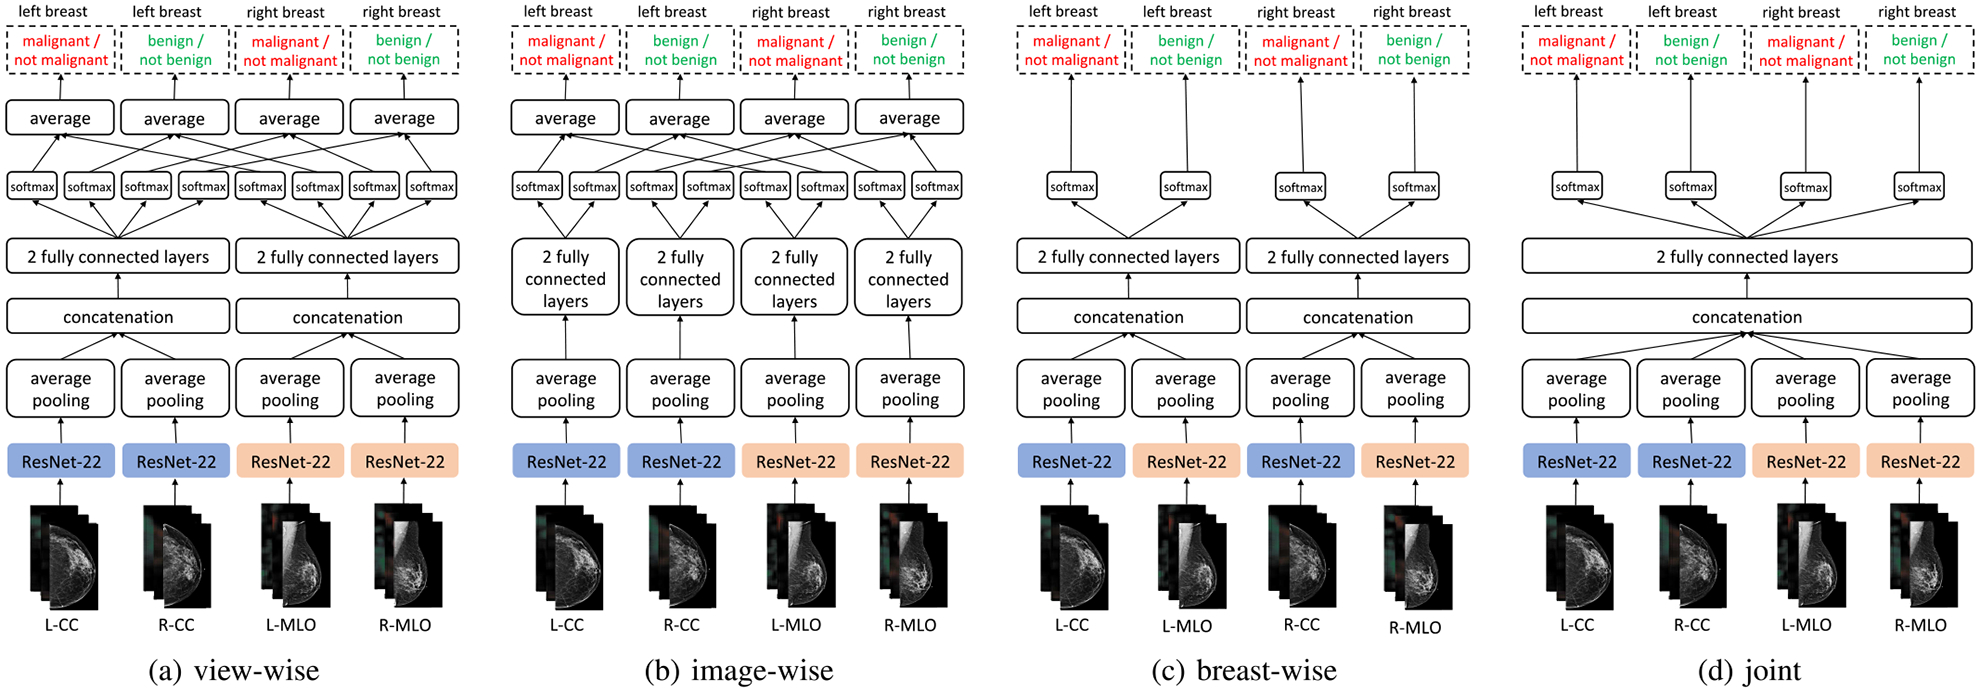
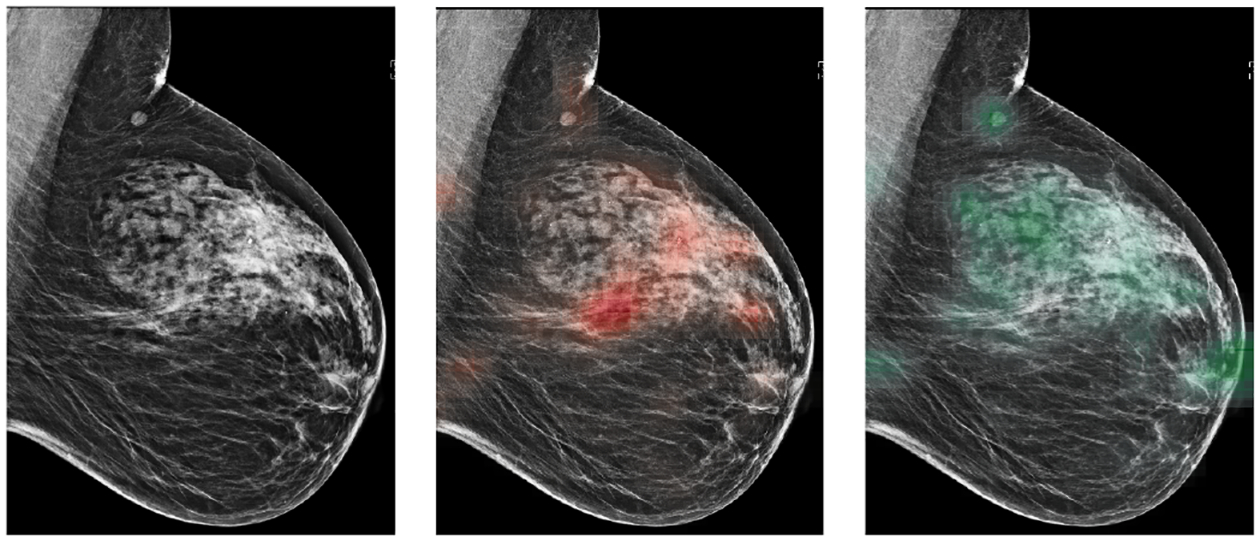
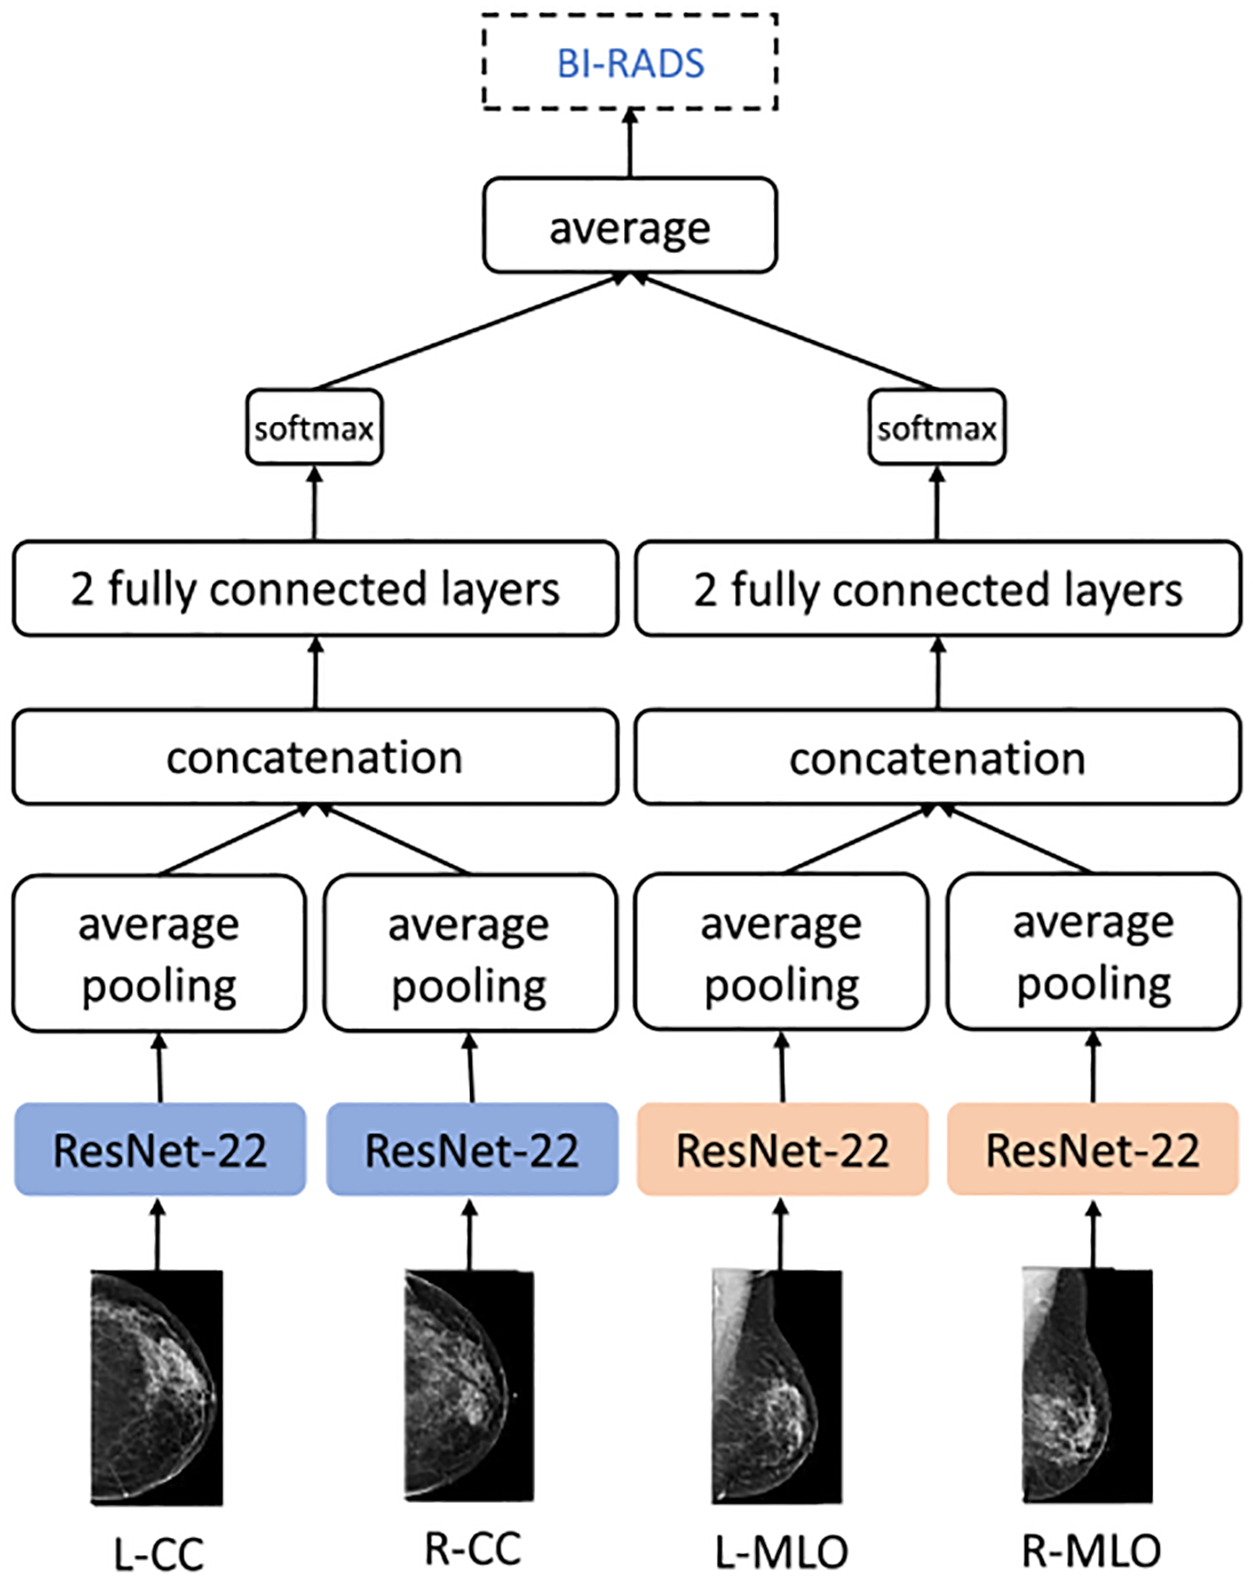
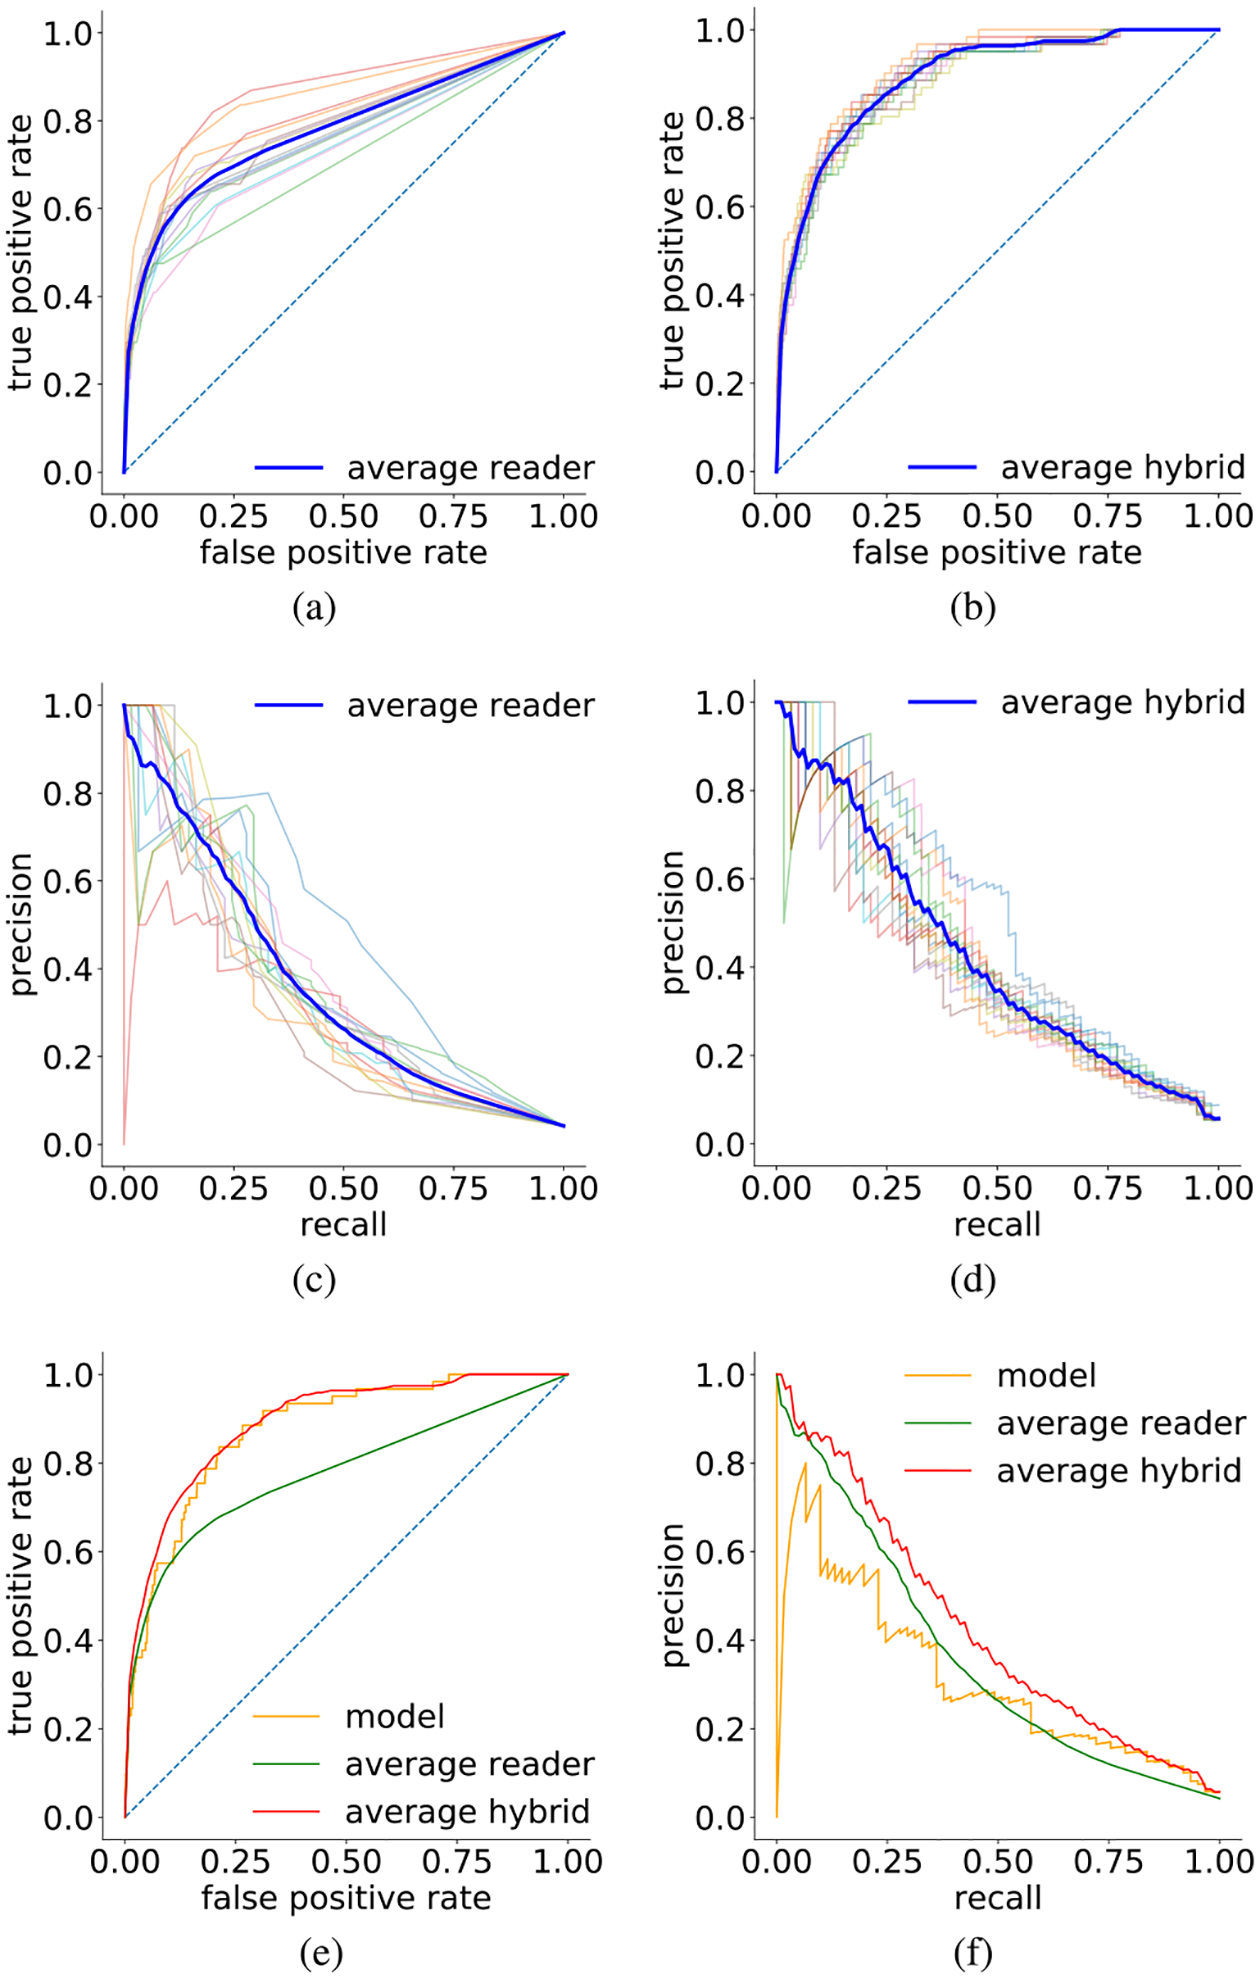
We present a deep convolutional neural network for breast cancer screening exam classification, trained, and evaluated on over 200000 exams (over 1000000 images). Our network achieves an AUC of 0.895 in predicting the presence of cancer in the breast, when tested on the screening population. We attribute the high accuracy to a few technical advances. 1) Our network's novel two-stage architecture and training procedure, which allows us to use a high-capacity patch-level network to learn from pixel-level labels alongside a network learning from macroscopic breast-level labels. 2) A custom ResNet-based network used as a building block of our model, whose balance of depth and width is optimized for high-resolution medical images. 3) Pretraining the network on screening BI-RADS classification, a related task with more noisy labels. 4) Combining multiple input views in an optimal way among a number of possible choices. To validate our model, we conducted a reader study with 14 readers, each reading 720 screening mammogram exams, and show that our model is as accurate as experienced radiologists when presented with the same data. We also show that a hybrid model, averaging the probability of malignancy predicted by a radiologist with a prediction of our neural network, is more accurate than either of the two separately. To further understand our results, we conduct a thorough analysis of our network's performance on different subpopulations of the screening population, the model's design, training procedure, errors, and properties of its internal representations. Our best models are publicly available at https://github.com/nyukat/breast_cancer_classifier.


Figures

Fig. 1.
Fig. 1.
Examples of breast cancer screening exams. First row: both breasts without any findings; second row: left breast with no findings and right breast with a malignant finding; third row: left breast with a benign finding and right breast with no findings.
Fig. 2.
Fig. 2.
An example of a segmentation performed by a radiologist. Left: the original image. Right: the image with lesions requiring a biopsy highlighted. The malignant finding is highlighted with red and benign finding with green.
Fig. 3.
Fig. 3.
A schematic representation of how we formulated breast cancer exam classification as a learning task. The main task that we intend the model to learn is malignant/not malignant classification. The task of benign/not benign classification is used as an auxiliary task regularizing the network.
Fig. 4.
Fig. 4.
Architecture of single-view ResNet-22. The numbers in square brackets indicate the number of output channels, unless otherwise specified. Left: Overview of the single-view ResNet-22, which consists of a set of ResNet layers. Center: ResNet layers consist of a sequence of ResNet blocks with different downsampling and output channels. Right: ResNet blocks consist of two 3 × 3 convolutional layers, with interleaving ReLU and batch normalization operations, and a residual connection between input and output. Where no downsampling factor is specified for a ResNet block, the first 3 × 3 convolution layer has a stride of 1, and the 1 × 1 convolution operation for the residual is omitted.
Fig. 5.
Fig. 5.
Four model variants for incorporating information across the four screening mammography views in an exam. All variants are constrained to have a total of 1,024 hidden activations between fully connected layers. The ‘view-wise’ model, which is the primary model used in our experiments, contains separate model branches for CC and MLO views–we average the predictions across both branches. The ‘image-wise’ model has a model branch for each image, and we similarly average the predictions. The ‘breast-wise’ model has separate branches per breast (left and right). The ‘joint’ model only has a single branch, operating on the concatenated representations of all four images. Average pooling in all models is averaging globally across spatial dimensions in all feature maps. When heatmaps (cf. Section IV-B) are added as additional channels to corresponding inputs, the first layers of the columns are modified accordingly.
Fig. 6.
Fig. 6.
The original image (left), the ‘malignant’ heatmap over the image (middle) and the ‘benign’ heatmap over the image (right).
Fig. 7.
Fig. 7.
BI-RADS classification model architecture. The architecture is largely similar to the ‘view-wise’ cancer classification model variant, except that the output is a set of probability estimates over the three output classes. The model consists of four ResNet-22 columns, with weights shared within CC and MLO branches of the model.
Fig. 8.
Fig. 8.
ROC curves [(a), (b), and (e)] and Precision-Recall curves [(c), (d), and (f)] on the subset of the test set used for the reader study. (a) and (c) curves for all 14 readers. Their average performance are highlighted in blue. (b) and (d) curves for hybrid of the image-andheatmaps ensemble with each single reader. Curve highlighted in blue indicates the average performance of all hybrids. (e) and (f) comparison among the image-and-heatmaps ensemble, average reader and average hybrid.
Fig. 9.
Fig. 9.
AUC (left) and PRAUC (right) as a function of λ ∈ [0, 1) for hybrids between each reader and our image-and-heatmaps ensemble. Each hybrid achieves the highest AUC/PRAUC for a different λ (marked with ◇).
Fig. 10.
Fig. 10.
Two-dimensional UMAP projection of the activations computed by the network for the exams in the reader study. We visualize two sets of activations: (left) concatenated activations from the last layer of each of the four image-specific columns, and (right) concatenated activations from the first fully connected layer in both CC and MLO model branches. Each point represents one exam. Color and size of each point reflect the same information: probability of malignancy predicted by the readers (averaged over the two breasts and the 14 readers).

References

    1. Siegel RL, Miller KD, and Jemal A, “Cancer statistics, 2015,” CA, Cancer J. Clinicians, vol. 65, no. 1, pp. 5–29, 2015. - PubMed
    1. Duffy SW et al., “The impact of organized mammography service screening on breast carcinoma mortality in seven Swedish counties: A collaborative evaluation,” Cancer, vol. 95, no. 3, pp. 458–469, 2002. - PubMed
    1. Kopans DB, “Beyond randomized controlled trials: Organized mammographic screening substantially reduces breast carcinoma mortality,” Cancer, vol. 94, no. 2, pp. 580–581, 2002. - PubMed
    1. Duffy SW, Tabár L, and Smith RA, “The mammographic screening trials: Commentary on the recent work by Olsen and Gøtzsche,” CA, Cancer J. Clinicians, vol. 52, no. 2, pp. 68–71, 2002. - PubMed
    1. Kopans DB, “An open letter to panels that are deciding guidelines for breast cancer screening,” Breast Cancer Res Treat, vol. 151, no. 1, pp. 19–25, 2015. - PubMed

Publication types