. 2019 Oct 11;17(10):e3000511.
doi: 10.1371/journal.pbio.3000511. eCollection 2019 Oct.

Walking enhances peripheral visual processing in humans

Affiliations

Walking enhances peripheral visual processing in humans

Liyu Cao et al. PLoS Biol. .

Abstract

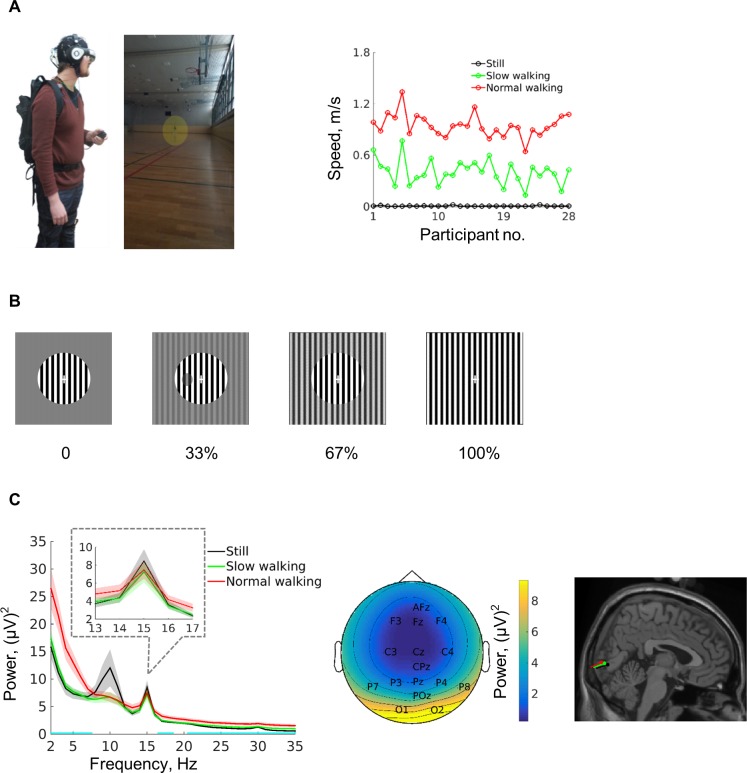
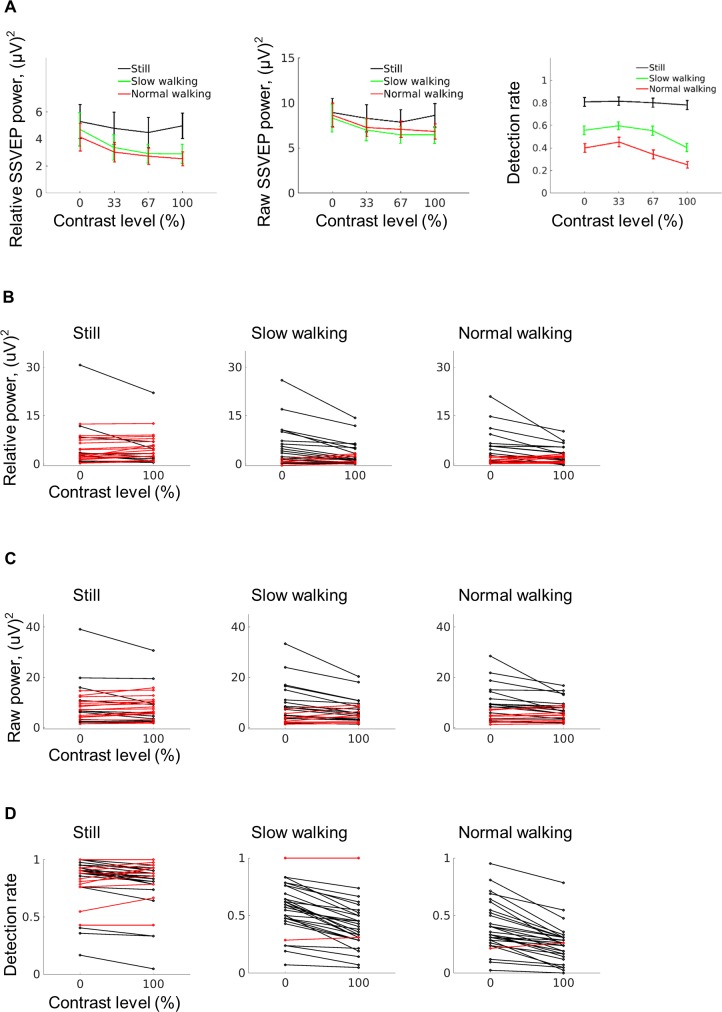
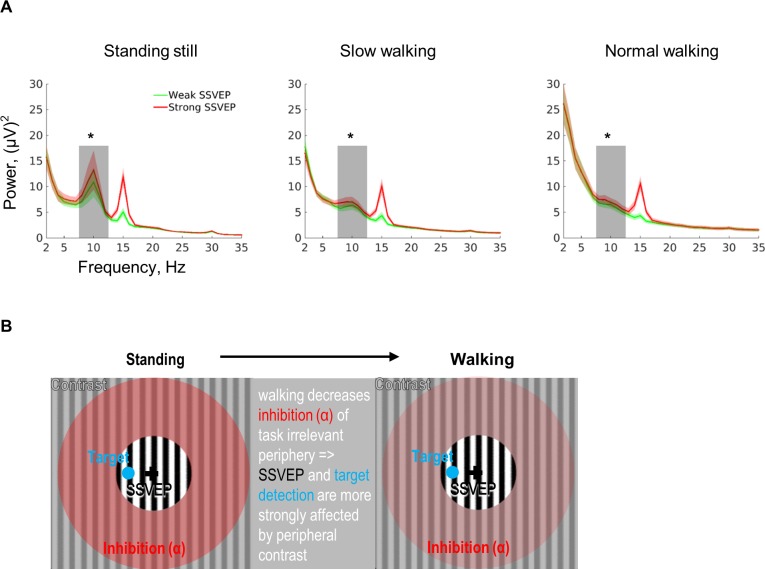
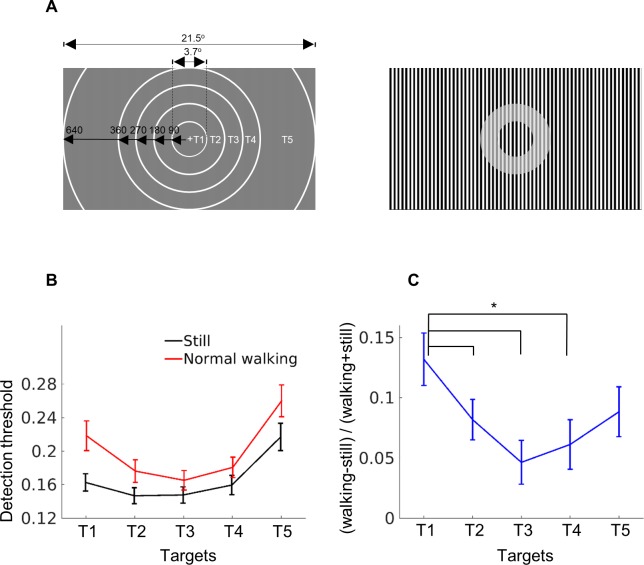
Cognitive processes are almost exclusively investigated under highly controlled settings during which voluntary body movements are suppressed. However, recent animal work suggests differences in sensory processing between movement states by showing drastically changed neural responses in early visual areas between locomotion and stillness. Does locomotion also modulate visual cortical activity in humans, and what are the perceptual consequences? Our study shows that walking increased the contrast-dependent influence of peripheral visual input on central visual input. This increase is prevalent in stimulus-locked electroencephalogram (EEG) responses (steady-state visual evoked potential [SSVEP]) alongside perceptual performance. Ongoing alpha oscillations (approximately 10 Hz) further positively correlated with the walking-induced changes of SSVEP amplitude, indicating the involvement of an altered inhibitory process during walking. The results predicted that walking leads to an increased processing of peripheral visual input. A second study indeed showed an increased contrast sensitivity for peripheral compared to central stimuli when subjects were walking. Our work shows complementary neurophysiological and behavioural evidence corroborating animal findings that walking leads to a change in early visual neuronal activity in humans. That neuronal modulation due to walking is indeed linked to specific perceptual changes extends the existing animal work.


Conflict of interest statement

The authors have declared that no competing interests exist.

Figures

Fig 1
Fig 1. Experimental setup and SSVEP responses.
(A) Participants carried all experimental equipment and walked freely in a 45 × 27 metre sports hall (the participant is marked with a yellow circle). Walking speed for the different walking conditions is shown on the right. (B) Illustration of the central flickering grating (visual angle: 6.1°) at four different levels of surround contrast (visual angle: 21.5°). An example contrast change (target) is shown in the second row. (C) Raw power spectrum of EEG responses in different walking conditions (left). Inset shows power responses around the SSVEP frequency of 15 Hz. Cyan lines mark the frequencies that showed power differences between walking conditions (p < 0.05, FDR-adjusted). Note that the power difference actually extends far beyond 35 Hz. Shading indicates ±1 standard error, n = 25 participants. Scalp topography of the average SSVEP response from all conditions is shown in the middle, and the source of the SSVEP response is estimated to be in the primary visual cortex in all conditions with dipole fitting (right). The original data are available from https://doi.org/10.6084/m9.figshare.9094742.v1. EEG, electroencephalogram; FDR, false discovery rate; SSVEP, steady-state visual evoked potential.
Fig 2
Fig 2. Influence of surround contrast depends on movement state.
(A) SSVEP responses (left: referenced SSVEP power; middle: raw SSVEP power) and detection rates (right) significantly decreased with higher surround contrast levels during walking but not during standing still. Vertical lines indicate ±1 standard error, n = 25 (SSVEP); n = 30 (detection rate). Refer to S1 Table for break-down statistics. (B,C) Individual data from contrast level 0% and 100% for referenced SSVEP power and raw SSVEP power. Red lines indicate participants whose data patterns do not conform to suppression (detection rate at 100% contrast larger or equal to 0% contrast). (D) Same as B but showing the individual detection rate. The original data are available from https://doi.org/10.6084/m9.figshare.9094742.v1. SSVEP, steady-state visual evoked potential.
Fig 3
Fig 3. Interaction between SSVEP power and alpha power and the proposed mechanism of interaction.
(A) In all three walking conditions, stronger SSVEP power was associated with stronger alpha power. No significant differences in other frequency bands were found. Shading indicates ±1 standard error. Grey bars indicate the alpha band (8–12 Hz), and asterisks indicate significant differences, n = 25 participants. (B) The diagram illustrates the suggested mechanistic influence of walking. Compared to standing still, walking leads to a decrease in inhibition indicated by alpha power (red area). This decreased inhibition gives a processing advantage to the peripheral visual field. In our specific stimulus, the peripheral visual field inhibits the central area (the strength depends on the background contrast). If the periphery is processed more strongly, the contrast of the background poses stronger influence on the central area. Consequently, SSVEP and behavioural detection rate (both exclusively probed and introduced in the central part of the visual field marked by the black circle) will decrease. The original data are available from https://doi.org/10.6084/m9.figshare.9094742.v1. SSVEP, steady-state visual evoked potential.
Fig 4
Fig 4. Walking leads to a processing advantage of peripheral stimuli.
(A) Schematic illustration of the stimulus. Left, the size and position of all five targets (T1–T5) of contrast change are marked by circular white lines (not visible for the participant), corresponding to the ratio of real stimulus presentation. Stimulus size is given in pixel and visual angle. Right, an example of a T2 contrast change is shown. Note that the grating background was constantly at 100% contrast. (B) Detection threshold for all targets in both standing still and normal walking condition. (C) The relative detection threshold difference between normal walking and standing still for all targets. Each connected pair showed a significant difference (post hoc t test with FDR-adjusted p-values for multiple comparisons, p < 0.05). Vertical lines indicate ±1 standard error, n = 27 participants. The original data are available from https://doi.org/10.6084/m9.figshare.9094742.v1. FDR, false discovery rate.

References

    1. Keller GB, Bonhoeffer T, Hubener M. Sensorimotor mismatch signals in primary visual cortex of the behaving mouse. Neuron. 2012;74(5):809–15. 10.1016/j.neuron.2012.03.040 - DOI - PubMed
    1. Saleem AB, Ayaz A, Jeffery KJ, Harris KD, Carandini M. Integration of visual motion and locomotion in mouse visual cortex. Nat Neurosci. 2013;16(12):1864–9. 10.1038/nn.3567 - DOI - PMC - PubMed
    1. Fu Y, Tucciarone JM, Espinosa JS, Sheng N, Darcy DP, Nicoll RA, et al. A cortical circuit for gain control by behavioral state. Cell. 2014;156(6):1139–52. 10.1016/j.cell.2014.01.050 - DOI - PMC - PubMed
    1. Lee AM, Hoy JL, Bonci A, Wilbrecht L, Stryker MP, Niell CM. Identification of a brainstem circuit regulating visual cortical state in parallel with locomotion. Neuron. 2014;83(2):455–66. 10.1016/j.neuron.2014.06.031 - DOI - PMC - PubMed
    1. Niell CM, Stryker MP. Modulation of visual responses by behavioral state in mouse visual cortex. Neuron. 2010;65(4):472–9. 10.1016/j.neuron.2010.01.033 - DOI - PMC - PubMed

Publication types