. 2019 Sep 27;365(6460):eaav7188.
doi: 10.1126/science.aav7188.

Multiple sclerosis genomic map implicates peripheral immune cells and microglia in susceptibility

Collaborators

Multiple sclerosis genomic map implicates peripheral immune cells and microglia in susceptibility

International Multiple Sclerosis Genetics Consortium. Science. .

Abstract

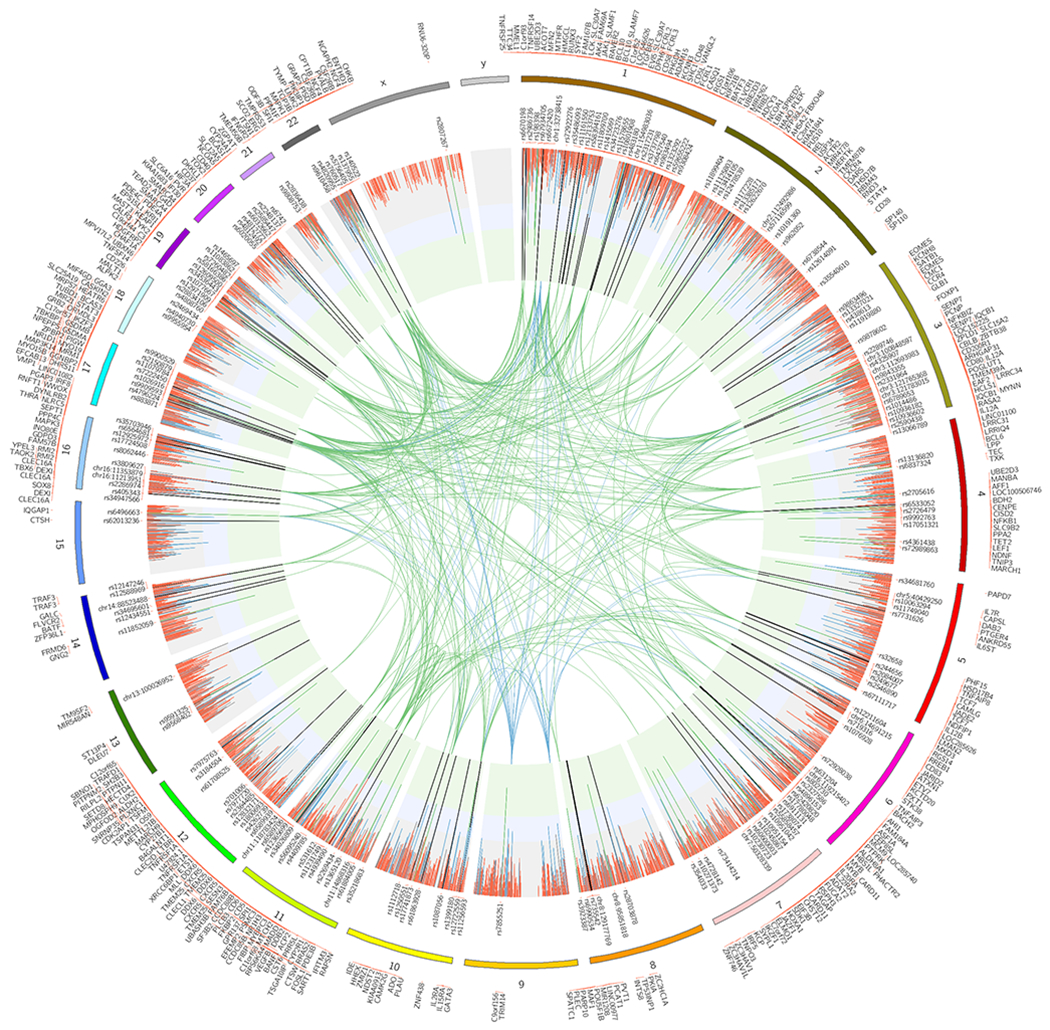
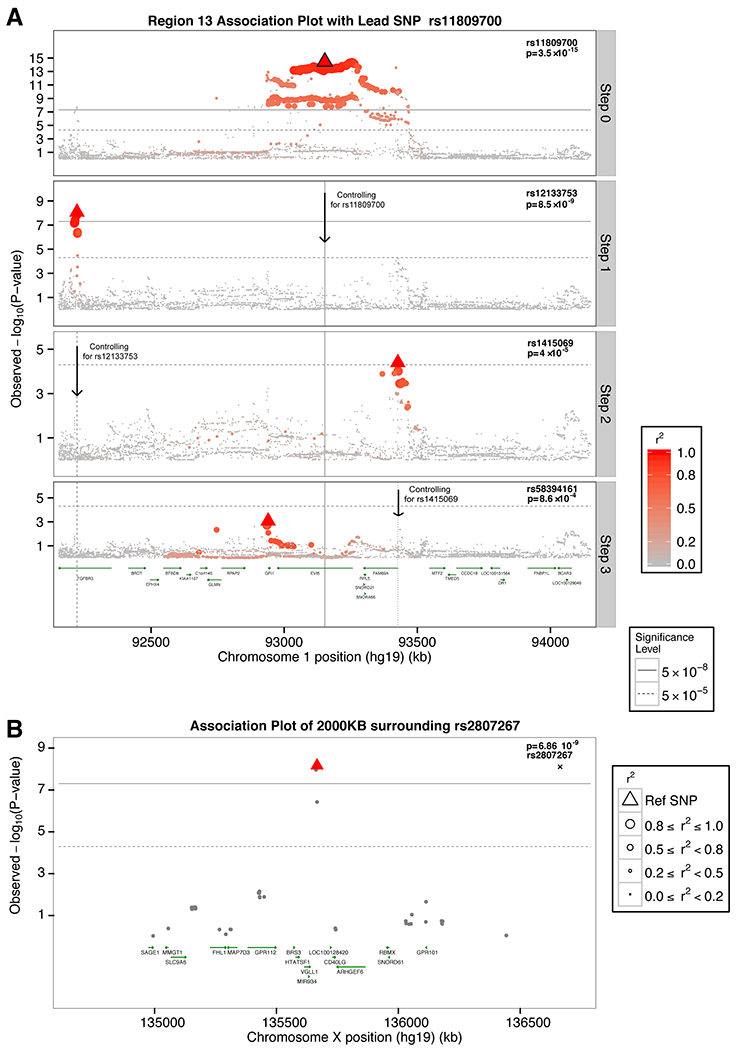
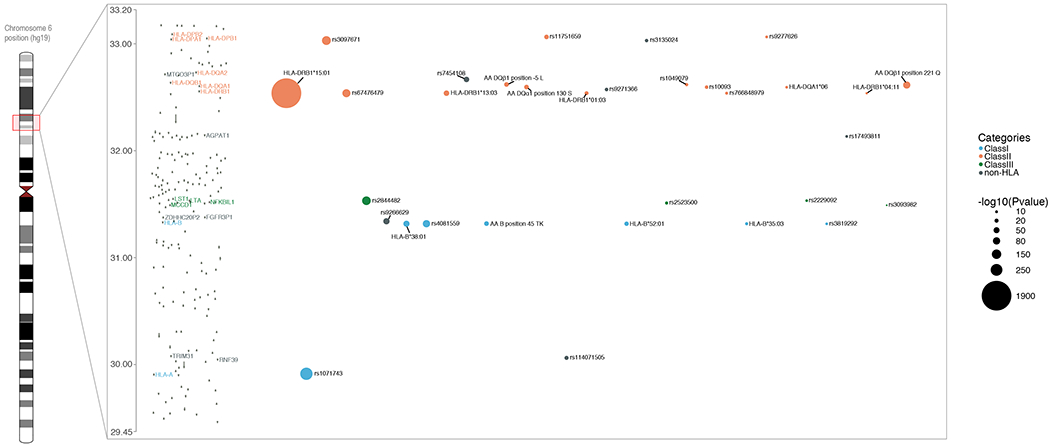
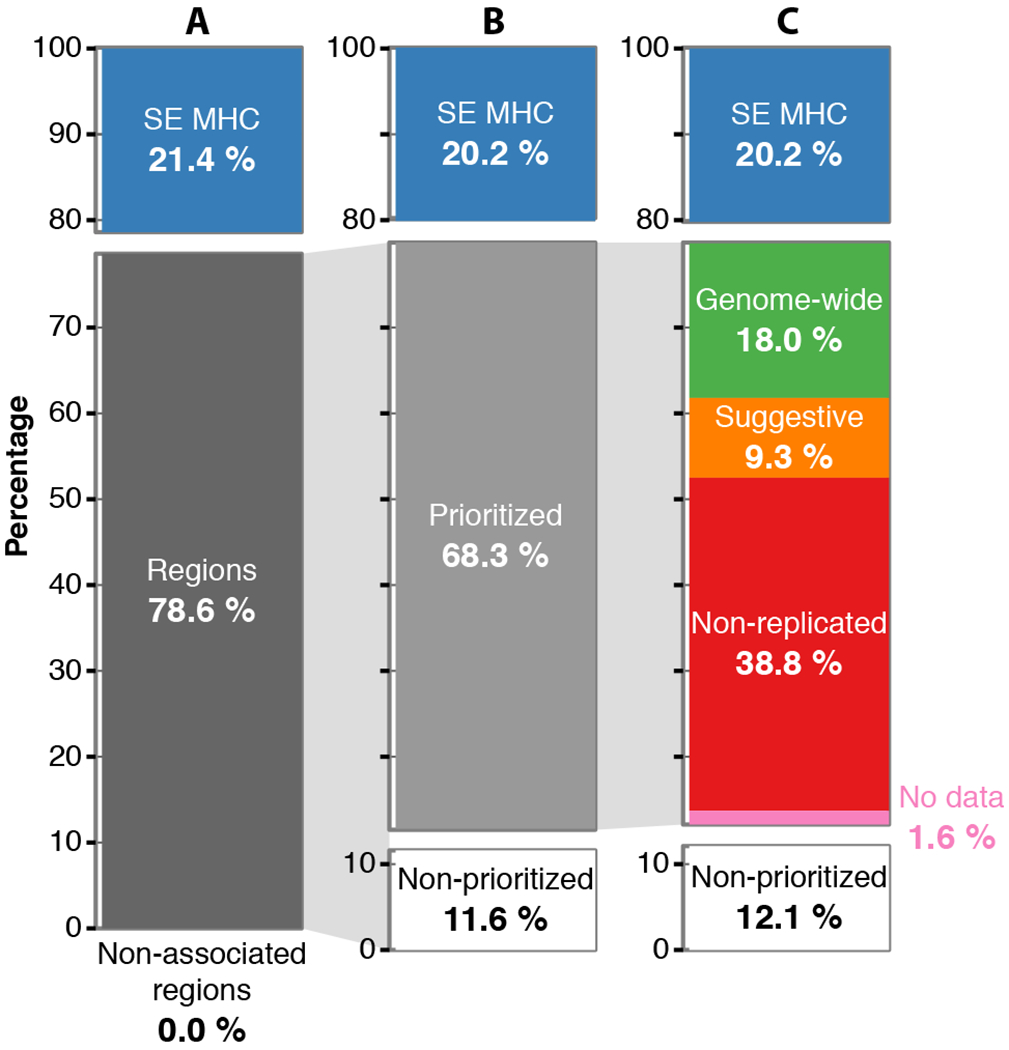
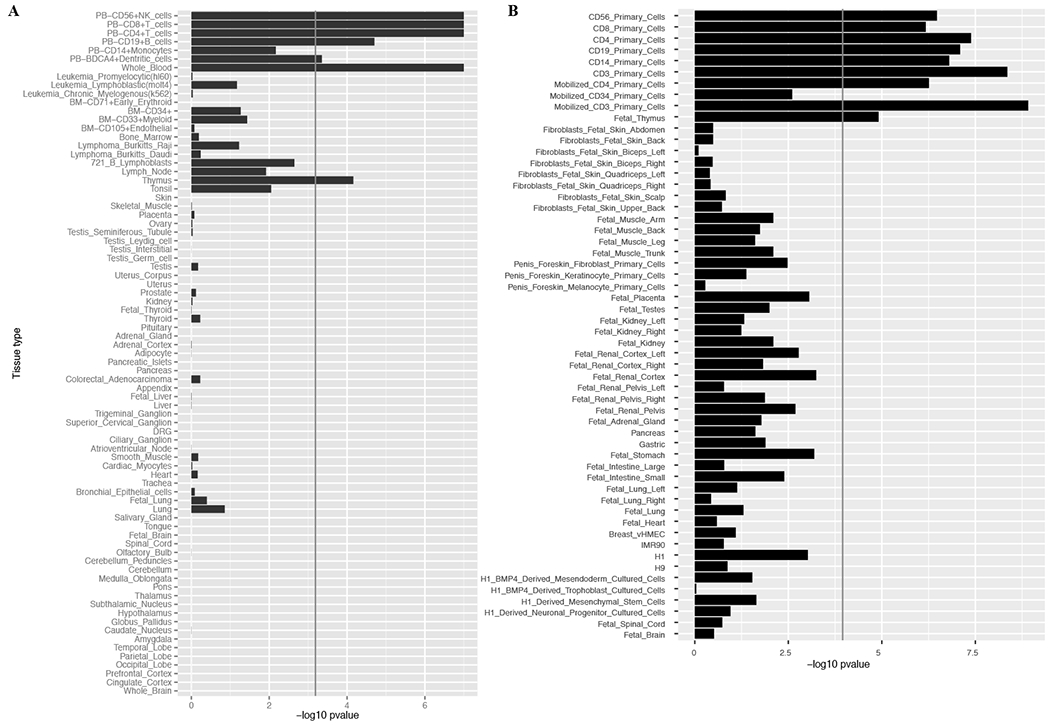
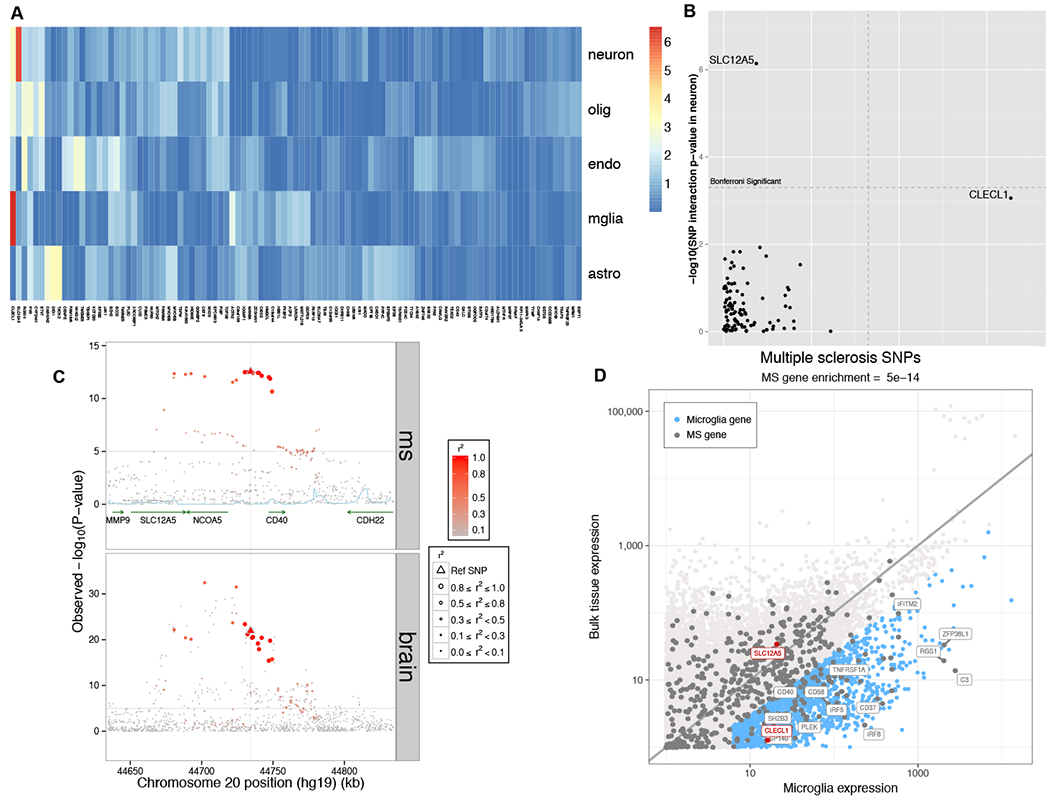
We analyzed genetic data of 47,429 multiple sclerosis (MS) and 68,374 control subjects and established a reference map of the genetic architecture of MS that includes 200 autosomal susceptibility variants outside the major histocompatibility complex (MHC), one chromosome X variant, and 32 variants within the extended MHC. We used an ensemble of methods to prioritize 551 putative susceptibility genes that implicate multiple innate and adaptive pathways distributed across the cellular components of the immune system. Using expression profiles from purified human microglia, we observed enrichment for MS genes in these brain-resident immune cells, suggesting that these may have a role in targeting an autoimmune process to the central nervous system, although MS is most likely initially triggered by perturbation of peripheral immune responses.


Conflict of interest statement

Competing interests: The authors declare no competing interests

Figures

Fig. 1.
Fig. 1.. The genetic map of multiple sclerosis.
The circos plot displays the 4,842 prioritized autosomal non-MHC effects and the associations in chromosome X. Joint analysis (discovery and replication) p-values are plotted as lines (fixed effects inverse-variance meta-analysis). The green inner layer displays genome-wide significance (p-value<5×10⁻⁸), the blue inner layer suggestive p-values (1×10⁻⁵<p-value>5×10⁻⁸), and the grey p-values > 1×10⁻⁵. Each line in the inner layers represents one effect. 200 autosomal non-MHC and one in chromosome X genome-wide effects are listed. The vertical lines in the inner layers represent one effect and the respective color displays the replication status (see main text and Online Methods): green (genome-wide), blue (potentially replicated), red (non-replicated). 551 prioritized genes are plotted on the outer surface. The inner circle space includes protein-protein interactions (PPI) between genome-wide genes (green), and genome-wide genes and potentially replicated genes (blue) that are identified as candidates using protein-protein interaction networks (see main text) (9).
Fig. 2.
Fig. 2.. Multiple independent effects in the EVI5 locus and chromosome X associations.
A) Regional association plot of the EVI5 locus. Discovery p-values (fixed effects inverse-variance meta-analysis) are displayed. The layer tagged “Marginal” plots the associations of the marginal analysis, with most statistically significant SNP being rs11809700 (ORT=1.16; p-value= 3.51×10⁻¹⁵). The “Step 1” plots the associations conditioning on rs11809700; rs12133753 is the most statistically significant SNP (ORC=1.14; p-value= 8.53×10−09). “Step 2” plots the results conditioning on rs11809700 and rs12133753, with rs1415069 displaying the lowest p-value (ORG=1.10; p-value= 4.01×10⁻⁵). Finally, “Step 3” plots the associations conditioning on rs11809700, rs12133753, and rs1415069, identifying rs58394161 as the most-statistically significant SNP (ORC=1.10; p-value= 8.63×10⁻⁴). All 4 SNPs reached genome-wide significance in the respective joint, discovery plus replication, analyses (Table S7). Each of the independent 4 SNPs, i.e. lead SNPs, are highlighted using a triangle in the respective layer. B) Regional association plot for the genome-wide chromosome X variant. Joint analysis p-values (fixed effects inverse-variance meta-analysis) are displayed. Linkage disequilibrium, in terms of r2 based on the 1000 Genomes European panel, is indicated using a combination of color grade and symbol size (see legend for details). All positions are in human genome 19.
Fig. 3.
Fig. 3.. Independent associations in the major histocompatibility locus.
Regional association plot in the MHC locus. Only genome-wide statistically independent effects are listed. The order of variants in the X-axis represents the order these were identified. The size of the circle represents different values of −log10(p-value) (fixed effects inverse-variance meta-analysis). Different colors are used to depict class I, II, III, and non-HLA effects. Y-axis displays million base pairs.
Fig. 4.
Fig. 4.. Heritability partitioning.
Proportion of the overall narrow-sense heritability under the liability model (~19.2%) explained by different genetic components. (A) The overall heritability is partitioned in the super extended MHC (SE MHC), the 1,962 Regions that include all SNPs with p-value<0.05 (Regions; fixed effects inverse-variance meta-analysis), and the rest of genome with p-values>0.05 (Non-associated regions). (B) The Regions are further partitioned to the seemingly statistically independent effects (Prioritized) and the residual (Non-prioritized). (C) The Prioritized component is partitioned based on the replication knowledge to genome-wide effects (GW), suggestive (S), non-replicated (ND), and no data (ND). The lines connecting the pie charts depict the component that is partitioned. All values are estimated using the discovery data-sets (n= 4,802 cases and 26,703 controls).
Fig. 5.
Fig. 5.. Tissue and cell type enrichment analyses.
(A) Gene Atlas tissues and cell types gene expression enrichment. (B) DNA hypersensitivity sites (DHS) enrichment for tissues and cell types from the NIH Epigenetic Roadmap. Rows are sorted from immune cells/tissues to central nervous system related ones. Both X axes display −log10 of Benjamini & Hochberg p-values (false discovery rate).
Fig. 6.
Fig. 6.. Dissection of cortical RNAseq data.
In (A), we present a heatmap of the results of our analysis assessing whether a cortical eQTL is likely to come from one of the component cell types of the cortex: neurons, oligodendrocytes, endothelial cells, microglia and astrocytes (in rows). Each column presents results for one of the MS brain eQTLs. The color scheme relates to the p-value of the interaction term (linear regression), with red denoting a more extreme result. (B) We present the same results in a different form, comparing results of assessing for interaction with neuronal proportion (y axis) and microglial proportion (x-axis): the SLC12A5 eQTL is significantly stronger when accounting for neuronal proportion, and CLECL1 is significantly stronger when accounting for microglia. The Bonferroni-corrected threshold of significance is highlighted by the dashed line. (C) Locus view of the SLC12A5/CD40 locus, illustrating the distribution of MS susceptibility and the SLC12A5 brain eQTL in a segment of chromosome 20 (x axis); the y axis presents the p-value of association with MS susceptibility (top panel; fixed effects inverse-variance meta-analysis) or SLC12A5 RNA expression (bottom panel; linear regression). The lead MS SNP is denoted by a triangle, other SNPs are circles, with the intensity of the red color denoting the strength of LD with the lead MS SNP in both panels. (D) Here we plot the level of expression, transcriptome-wide, for each measured gene in our cortical RNAseq dataset (n=455)(y-axis) and purified human microglia (n=10)(x-axis) from the same cortical region. In blue, we highlight those genes with > 4 fold increased expression in microglia relative to bulk cortical tissue and are expressed at a reasonable level in microglia. Each dot is one gene. Gray dots denote the 551 putative MS genes from our integrated analysis. SLC12A5 and CLECL1 are highlighted in red; in blue, we highlight a selected subset of the MS genes – many of them well-validated – which are enriched in microglia. For clarity, we did not include all of the MS genes that fall in this category.

Comment in

References

    1. International Multiple Sclerosis Genetics Consortium et al., Risk alleles for multiple sclerosis identified by a genomewide study. N Engl J Med 357, 851–862 (2007). - PubMed
    1. De Jager PL et al., Meta-analysis of genome scans and replication identify CD6, IRF8 and TNFRSF1A as new multiple sclerosis susceptibility loci. Nat Genet 41, 776–782 (2009). - PMC - PubMed
    1. International Multiple Sclerosis Genetics Consortium et al., Analysis of immune-related loci identifies 48 new susceptibility variants for multiple sclerosis. Nat Genet 45, 1353–1360 (2013). - PMC - PubMed
    1. International Multiple Sclerosis Genetics Consortium et al., Genetic risk and a primary role for cell-mediated immune mechanisms in multiple sclerosis. Nature 476, 214–219 (2011). - PMC - PubMed
    1. Patsopoulos NA et al., Genome-wide meta-analysis identifies novel multiple sclerosis susceptibility loci. Ann Neurol 70, 897–912 (2011). - PMC - PubMed

Publication types