. 2019 Sep 27;365(6460):1428-1434.
doi: 10.1126/science.aaw3134.

The intestinal microbiota programs diurnal rhythms in host metabolism through histone deacetylase 3

Affiliations

The intestinal microbiota programs diurnal rhythms in host metabolism through histone deacetylase 3

Zheng Kuang et al. Science. .

Abstract

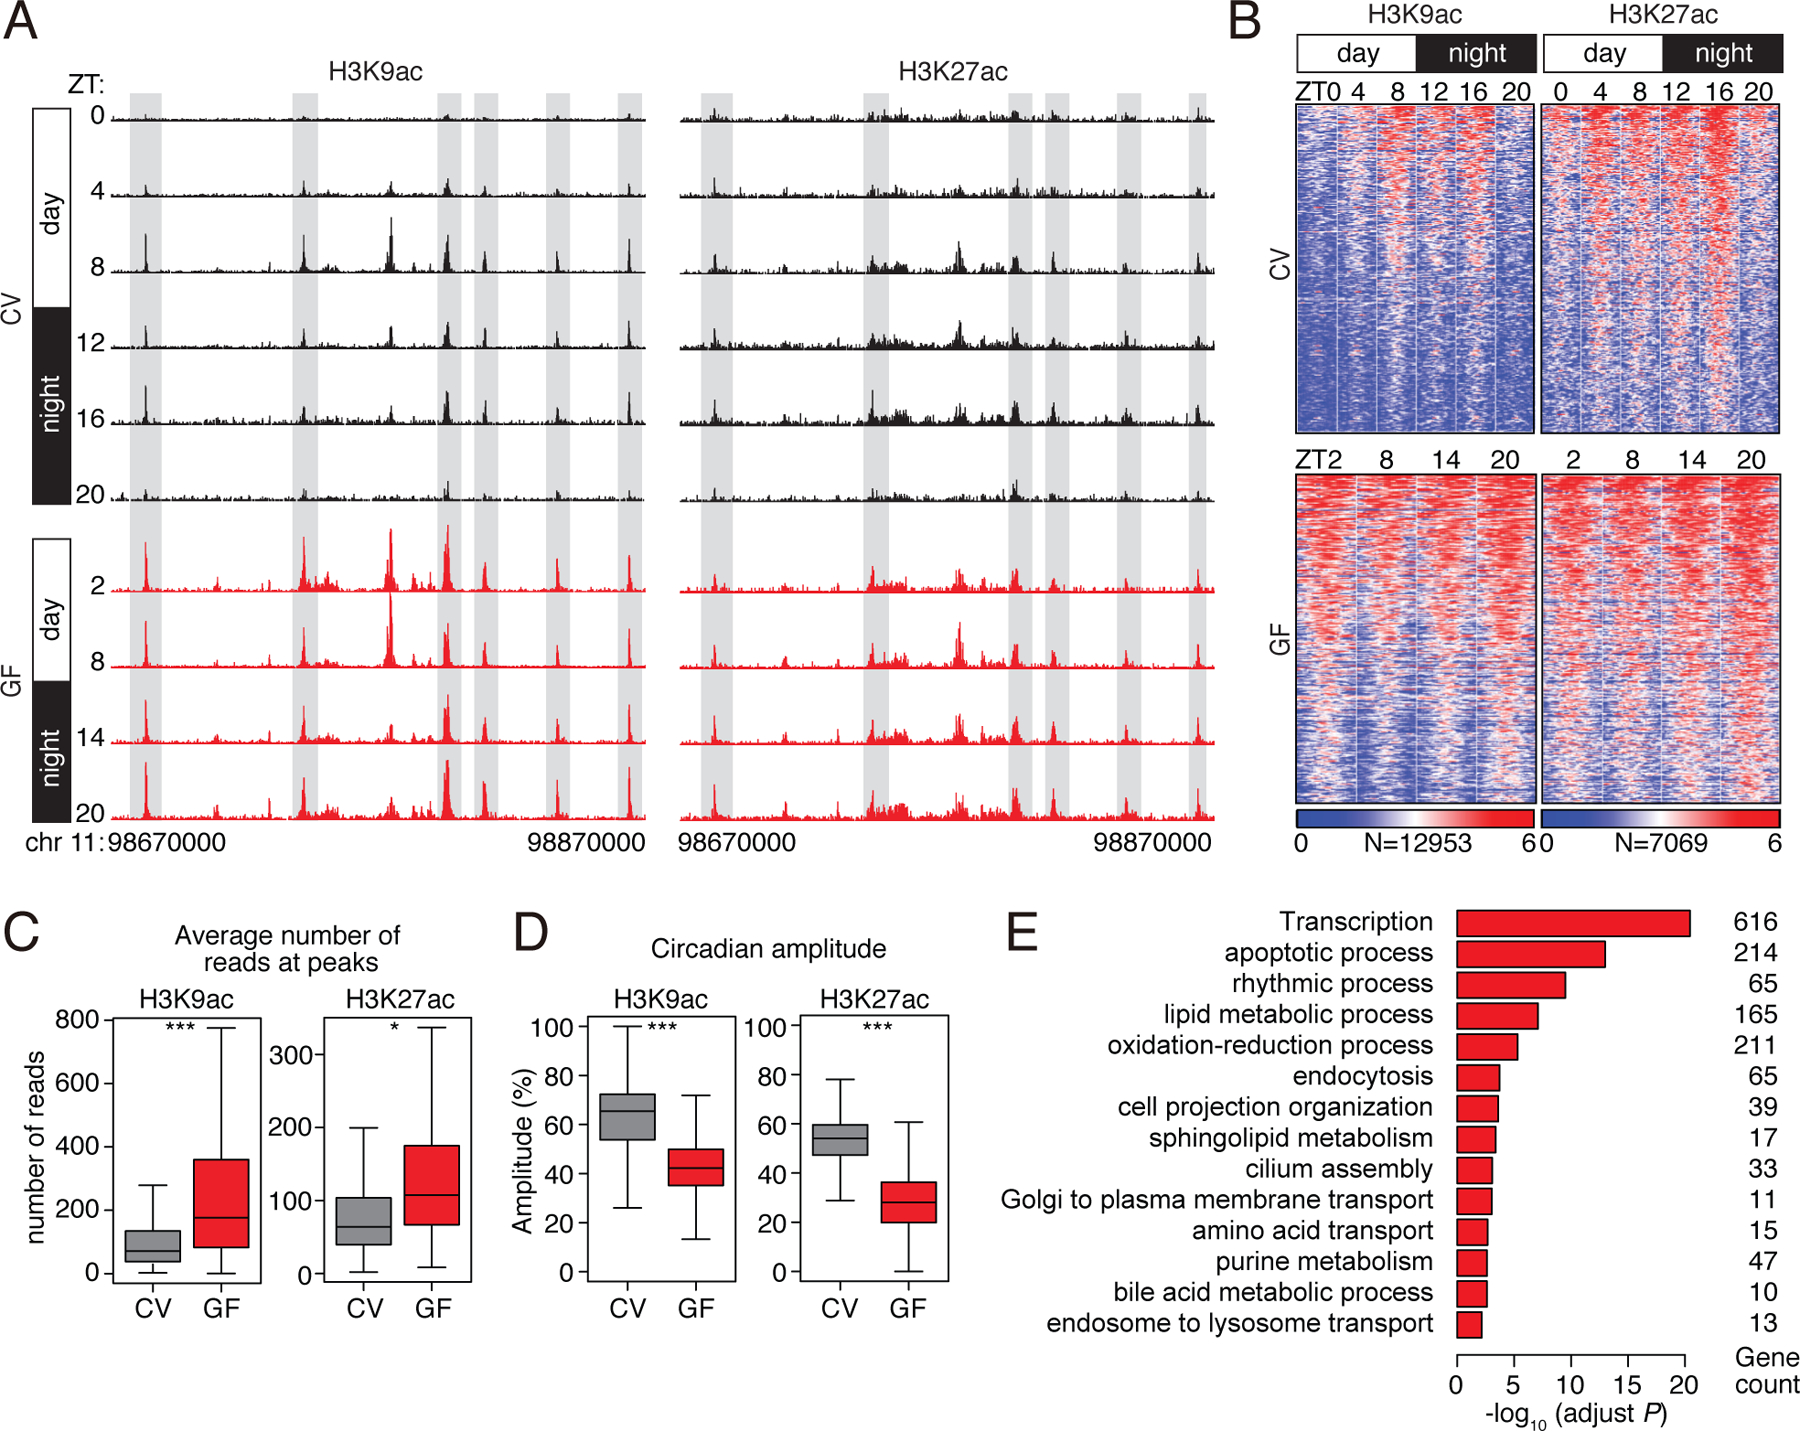
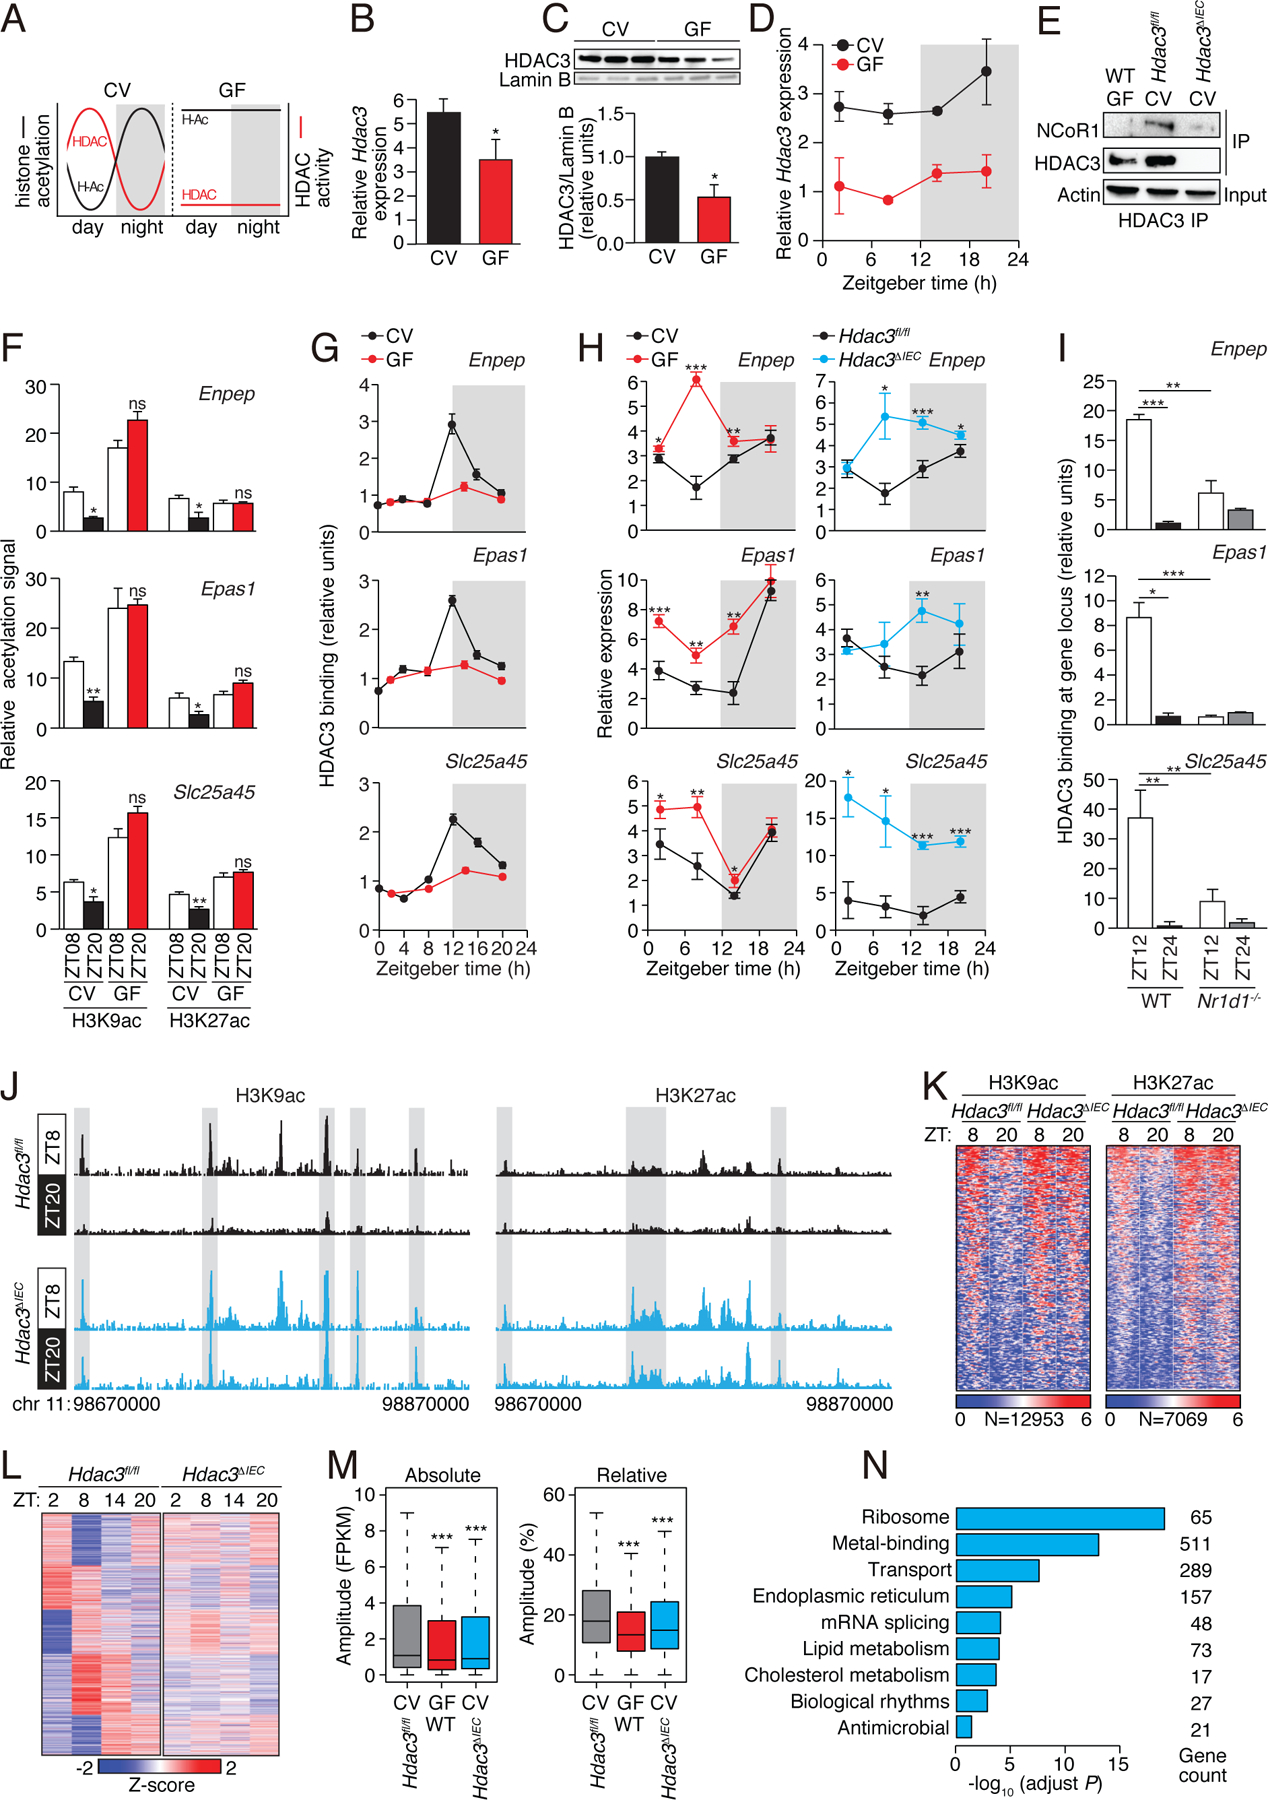
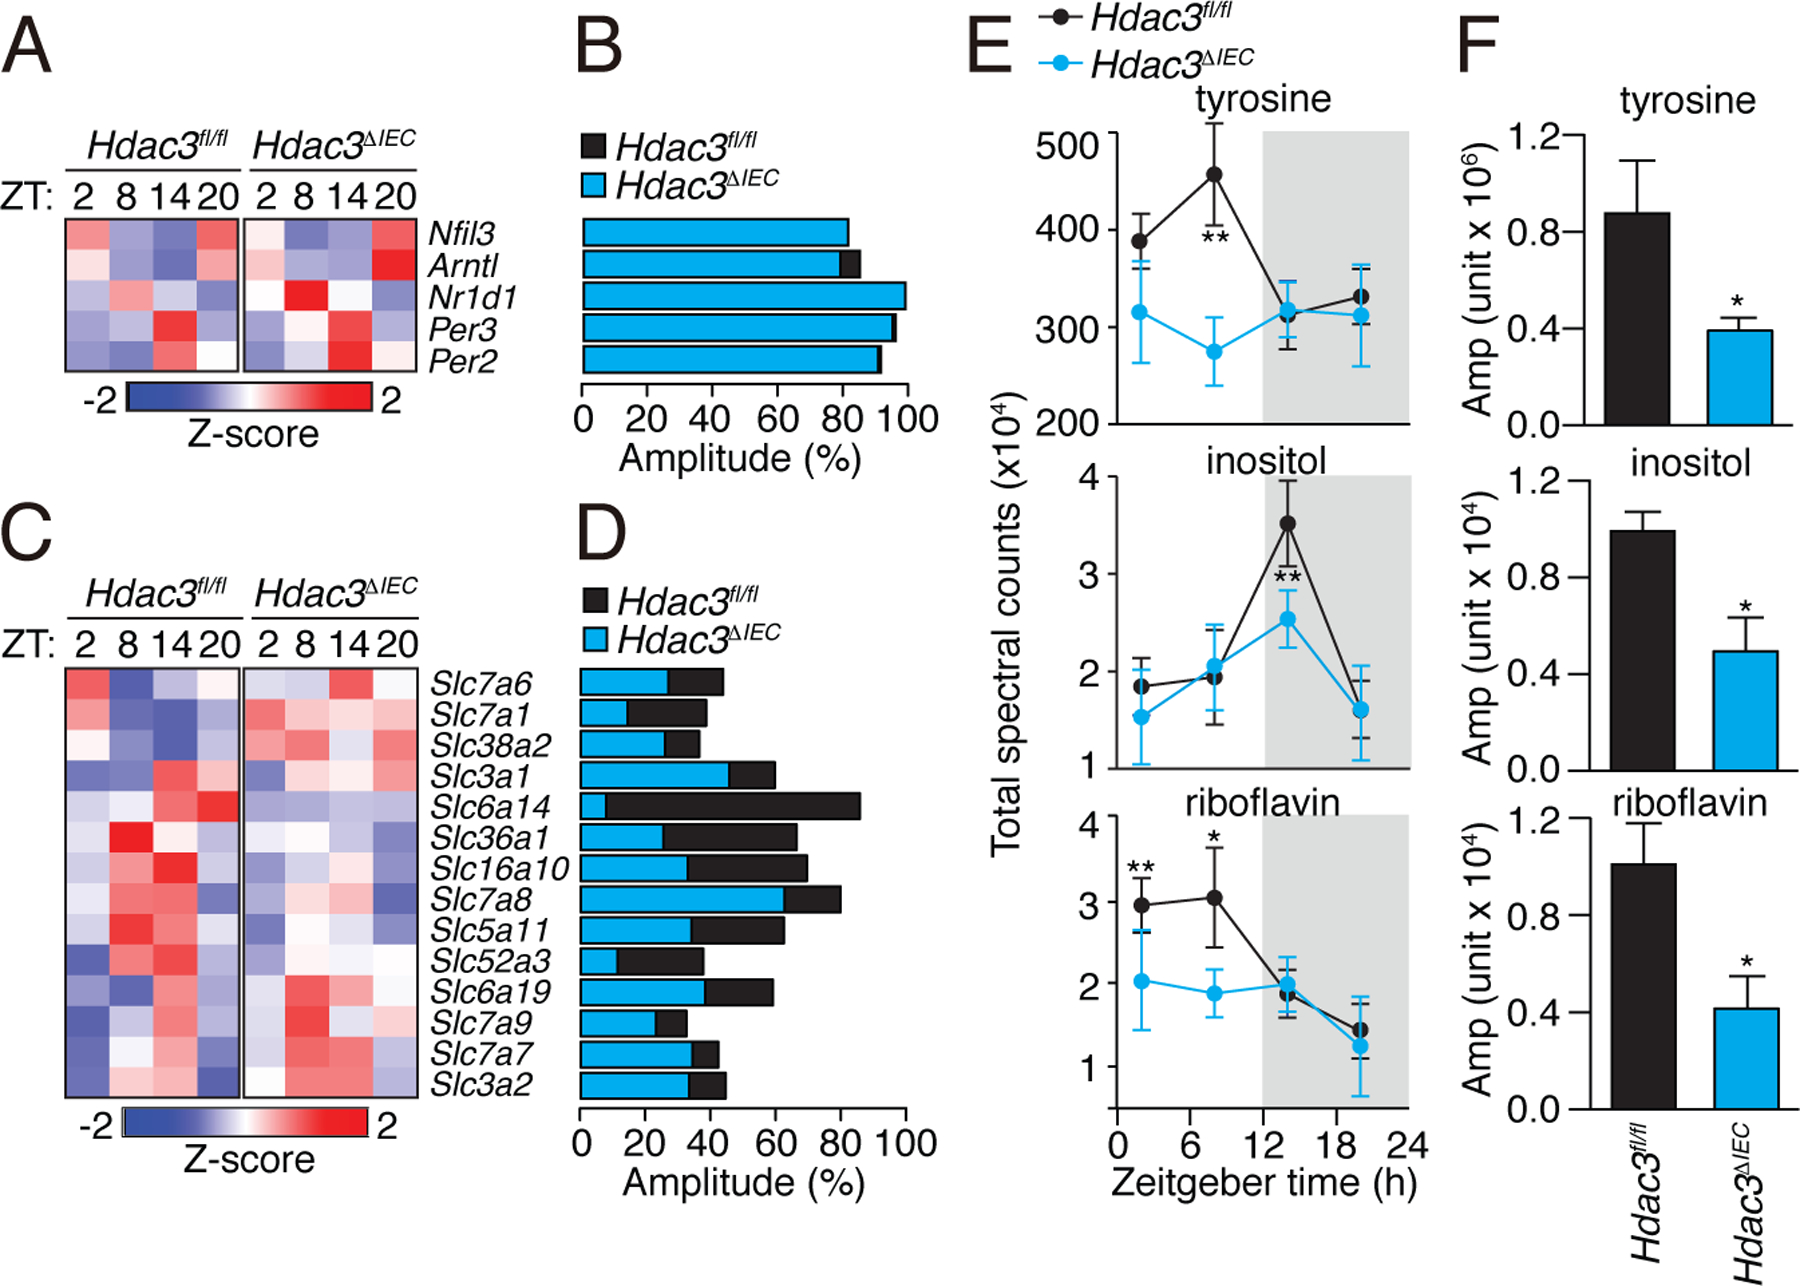
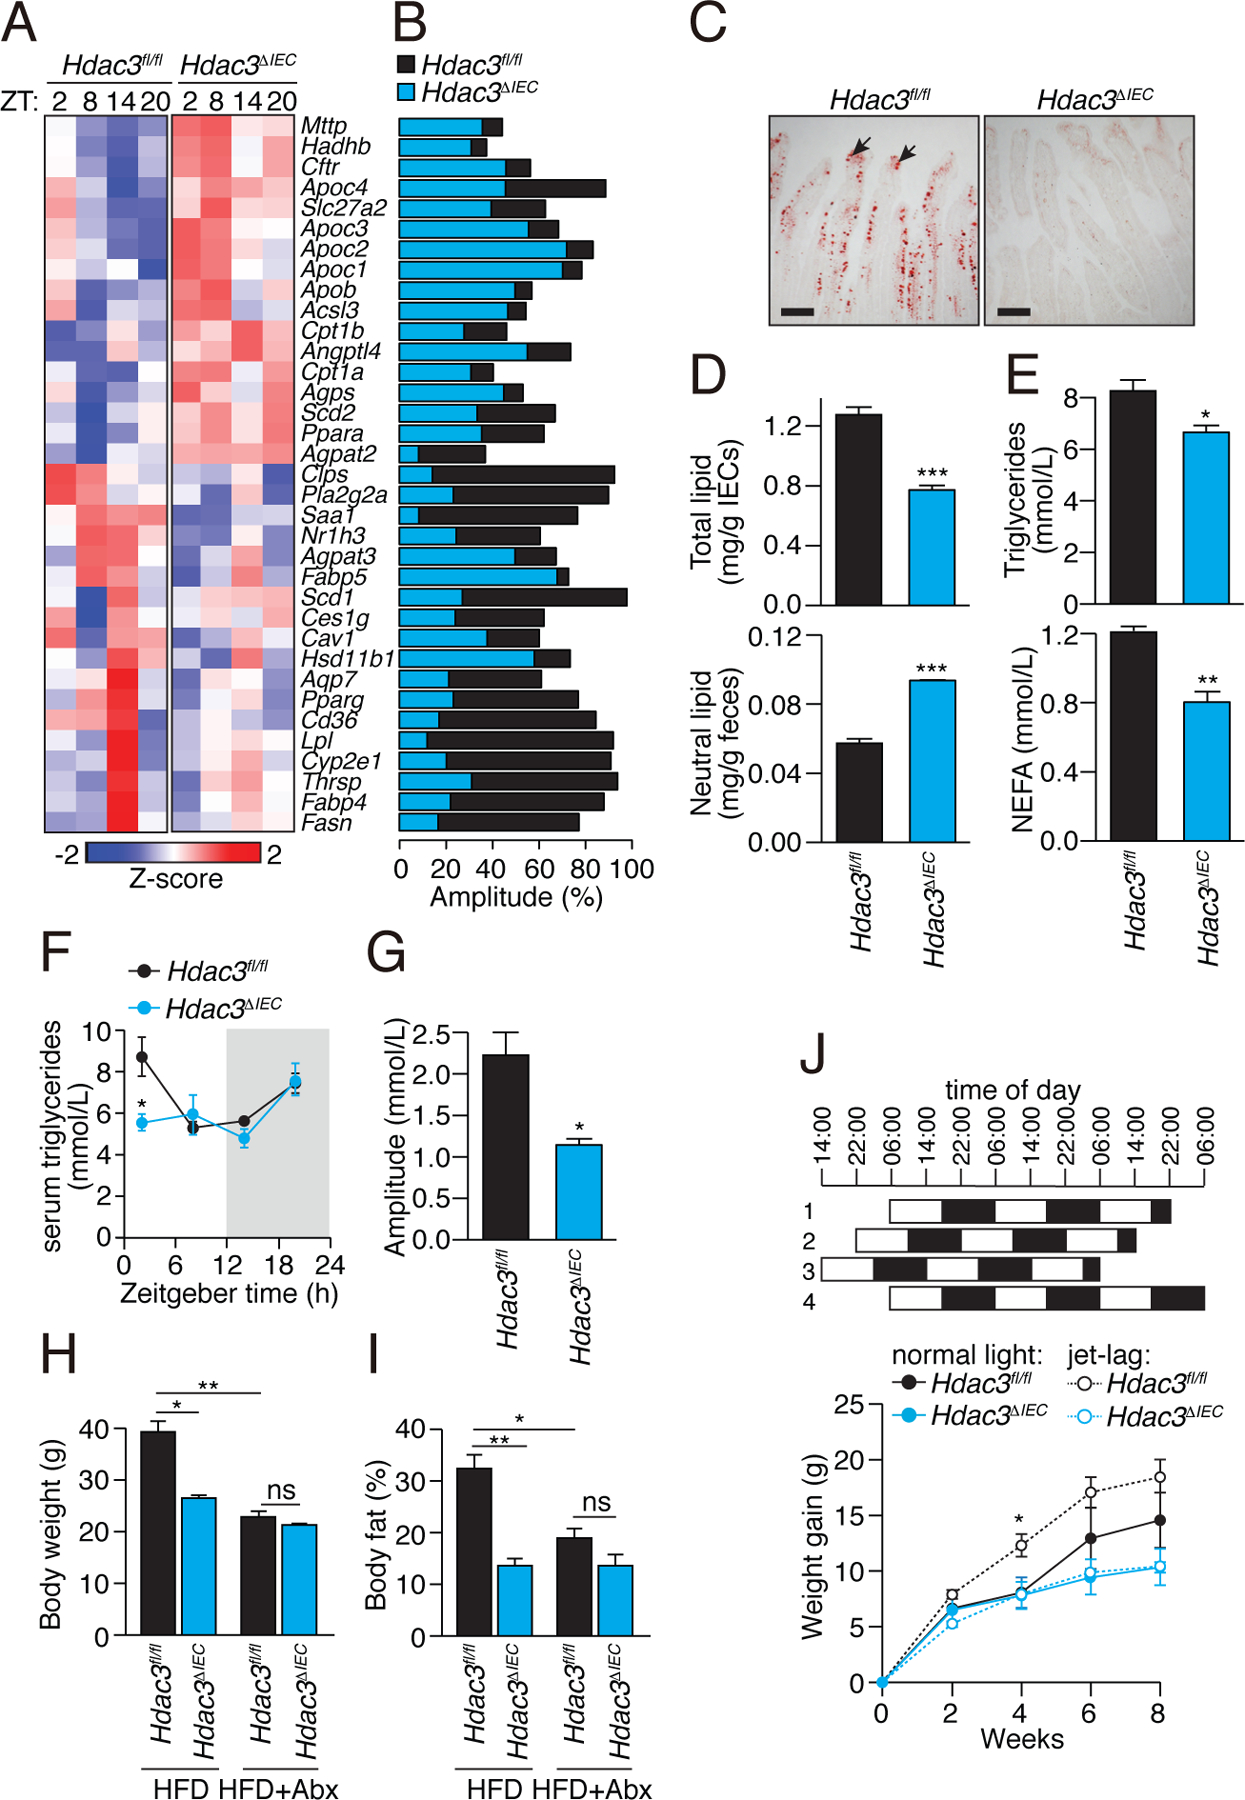
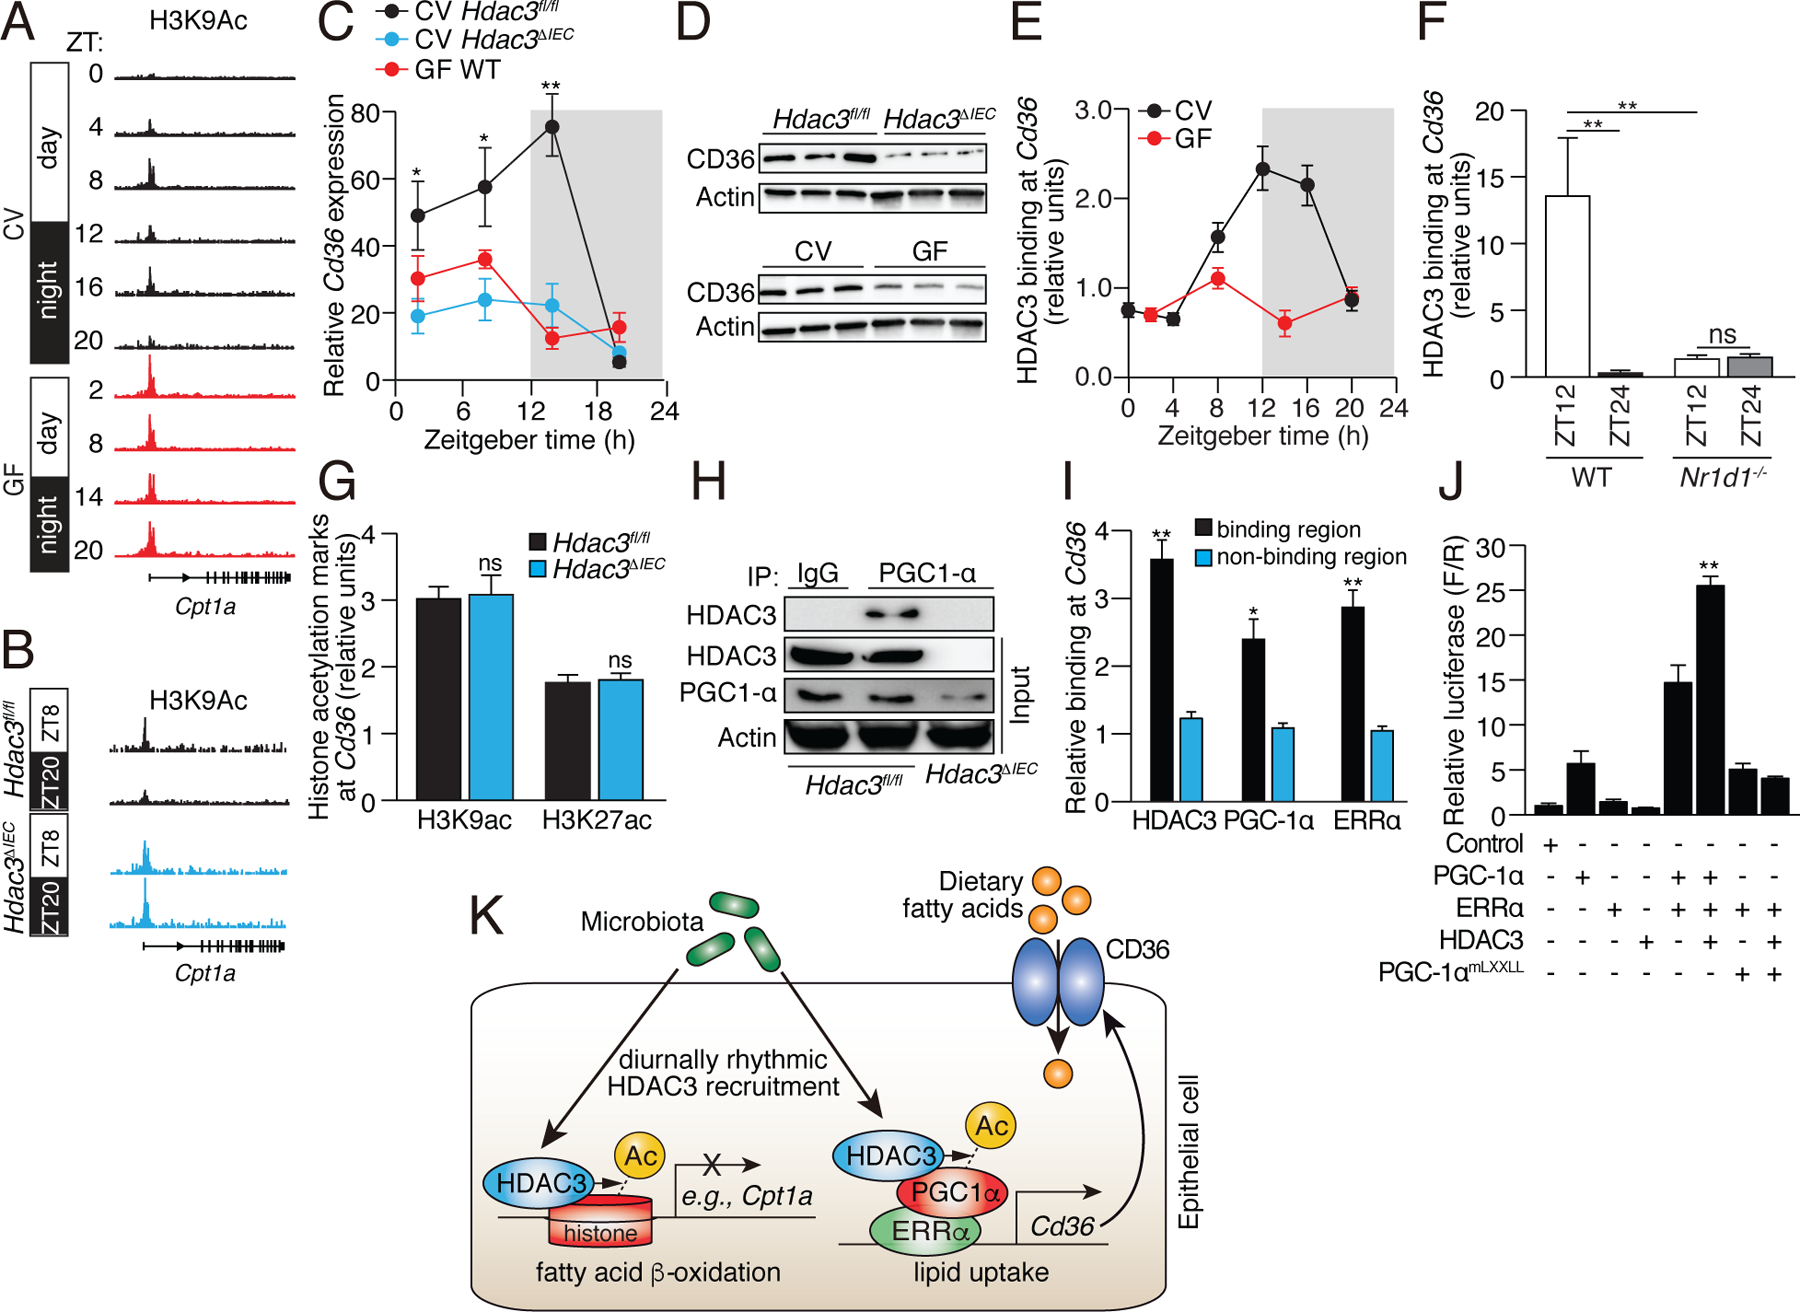
Circadian rhythmicity is a defining feature of mammalian metabolism that synchronizes metabolic processes to day-night light cycles. Here, we show that the intestinal microbiota programs diurnal metabolic rhythms in the mouse small intestine through histone deacetylase 3 (HDAC3). The microbiota induced expression of intestinal epithelial HDAC3, which was recruited rhythmically to chromatin, and produced synchronized diurnal oscillations in histone acetylation, metabolic gene expression, and nutrient uptake. HDAC3 also functioned noncanonically to coactivate estrogen-related receptor α, inducing microbiota-dependent rhythmic transcription of the lipid transporter gene Cd36 and promoting lipid absorption and diet-induced obesity. Our findings reveal that HDAC3 integrates microbial and circadian cues for regulation of diurnal metabolic rhythms and pinpoint a key mechanism by which the microbiota controls host metabolism.


Conflict of interest statement

Competing interests: The authors have no competing interests.

Figures

Figure 1:
Figure 1:. Histone acetylation in small intestinal epithelial cells exhibits synchronized diurnal rhythmicity that depends on the microbiota.
(A) Genome browser view of the 200 kb region surrounding the Nr1d1 locus, showing ChIP-seq analysis of H3K9ac and H3K27ac marks in small intestinal epithelial cells. The analysis was done across a circadian cycle in CV and GF mice. Each track represents the normalized ChIP-seq read coverage at a single time point. Examples of peaks showing microbiota-dependent diurnal rhythmicity are highlighted in gray. N=3 pooled biological replicates per library. (B) Heat maps of H3K9ac and H3K27ac signals (log (reads at 50 bp windows)) from −1 to +1 kb surrounding the centers of all cycling H3K9ac and H3K27ac peaks (adjust P<0.01 by JTK). Each peak in the genome is represented as a horizontal line, ordered vertically by signal strength, and the analysis was done across a circadian cycle in CV and GF mice. The number of peaks in the genome is indicated at the bottom. The blue-red gradient indicates the coverage or signal strength (normalized uniquely mapped reads per 20 million reads). Intensity (C) and amplitude (D) of H3K9ac and H3K27ac peaks in CV and GF mice. *P<0.05, ***P<0.001 by one-tailed paired t-test. (E) Enriched GO categories in genes having H3K9ac- and H3K27ac-targeted genes as determined by the DAVID GO analysis tool. ZT, Zeitgeber; CV, conventional; GF, germ-free.
Figure 2:
Figure 2:. The intestinal microbiota programs the diurnal rhythmicity of epithelial histone acetylation and gene expression through HDAC3.
(A) Schematic diagram summarizing the diurnal histone acetylation pattern in CV and GF mice shown in Fig. 1, which suggests a loss of HDAC function in GF mice. (B) RT-qPCR analysis of Hdac3 transcripts in IECs from CV and GF mice at ZT8. N=3 mice per group. (C) Western blot of HDAC3 and Lamin B (loading control) in IECs from protein in intestinal epithelial cells from CV and GF mice at ZT8. Bands were quantified by scanning densitometry and normalized to the Lamin B band intensity. (D) RT-qPCR analysis of Hdac3 transcript abundance in epithelial cells from GF and CV mice across a 24-hour cycle. N=3 mice per group. (E) Co-immunoprecipitation of endogenous HDAC3 and NCoR1 in IECs from GF WT mice and CV Hdac3fl/fl and Hdac3ΔIEC mice. N=3 pooled biological replicates per lane. (F,G) Relative abundance of H3K9ac and H3K27ac marks (F) and bound HDAC3 (G) at the promoters of Enpep, Epas1 and Slc25a45 in CV and GF as determined by ChIP-qPCR analysis. N=3 mice per time point per group. (H) RT-qPCR analysis of Enpep, Epas1 and Slc25a45 transcript abundance in IECs from CV and GF mice or Hdac3fl/fl and Hdac3ΔIEC mice across a 24-hour cycle. N=3 mice per group. (I) Relative abundance of bound HDAC3 at the promoters of Enpep, Epas1 and Slc25a45 in small intestinal epithelial cells from WT and Nr1d1−/− mice as determined by ChIP-qPCR analysis. N=3 mice per time point per group. (J) Genome browser view of the 200 kb region surrounding the Nr1d1 locus, showing ChIP-seq analysis of H3K9ac and H3K27ac marks in small intestinal epithelial cells from Hdac3fl/fl and Hdac3ΔIEC mice. N=3 pooled biological replicates per library. (K) Heat maps of H3K9ac and H3K27ac signals (log (reads at 50 bp windows)) from −1 to +1 kb surrounding the centers of all cycling H3K9ac and H3K27ac peaks. (L) Heat map showing diurnal gene expression patterns in IECs from Hdac3fl/fl and Hdac3ΔIEC mice across a 24-hour cycle by RNA-seq. N=3 pooled biological replicates per library. (M) Absolute (Fragments Per Kilobase of transcript per Million mapped reads, FPKM) or relative oscillating amplitudes of transcripts in GF WT mice and CV Hdac3fl/fl and Hdac3ΔIEC mice. N=3 mice per group. (N) Enriched GO categories of genes with decreased cycling amplitudes as determined by DAVID. *P<0.05; **P<0.01; ***P<0.001; ns, not significant by two-tailed t-test. Means±SEM (error bars) are plotted. GF, germ-free; CV, conventional; ZT, Zeitgeber time.
Figure 3:
Figure 3:. Intestinal epithelial HDAC3 regulates the diurnal rhythmicity of nutrient uptake.
(A) Diurnal expression pattern of circadian clock genes in Hdac3fl/fl and Hdac3ΔIEC mice IECs are represented by a heat map, with amplitudes shown in (B). (C) Diurnal expression patterns of transporter genes in Hdac3fl/fl and Hdac3ΔIEC mice IECs are represented by a heat map, with amplitudes shown in (D). (E) Diurnal oscillations of serum tyrosine, inositol and riboflavin in Hdac3fl/fl and Hdac3ΔIEC mice with the amplitudes shown in (F). N=3 mice per group. *P<0.05 by two-tailed t-test.
Figure 4:
Figure 4:. Intestinal epithelial HDAC3 controls lipid absorption in the intestine.
(A) Diurnal expression pattern of lipid metabolic genes in IECs from Hdac3fl/fl and Hdac3ΔIEC mice IECs is represented by a heat map, with amplitudes shown in (B). (C) Oil red O staining of lipids in small intestines of Hdac3fl/fl and Hdac3ΔIEC mice fed a HFD. Intestines were harvested at ZT8. Black arrows indicate epithelial cells. Scale bars=100 μm. (D) Quantification of total lipids (at ZT8) in IECs and neutral lipids in feces from Hdac3fl/fl and Hdac3ΔIEC mice fed a HFD. N=6, 5 mice per group. ***P<0.001 by two-tailed t-test. (E) Quantification of triglycerides and free fatty acids (at ZT4) in serum from Hdac3fl/fl and Hdac3ΔIEC mice fed a HFD. N=6, 5 mice per group. *P<0.05; **P<0.01 by one-tailed t-test. (F) Diurnal oscillations of serum triglyceride concentrations in Hdac3fl/fl and Hdac3ΔIEC mice fed a chow diet, with amplitudes shown in (G). N=3 mice per group. *P<0.05 by one-tailed t-test. Statistical test for circadian rhythms: P=0.002 for Hdac3fl/fl and P=0.287 for Hdac3ΔIEC mice. (H,I) Weight (H) and body fat percentage (I) of Hdac3fl/fl and Hdac3ΔIEC mice fed a HFD with or without antibiotics for 10 weeks. N=5 mice per group. *P<0.05; **P<0.01; ns, not significant by one-tailed t-test. (J) Weight gain in mice fed a HFD with or without jet lag. Jet lag was induced by an 8-hour light cycle shift every three days. N=5 mice per group). *P<0.05 two-tailed t-test. Means±SEM (error bars) are plotted. ZT, Zeitgeber time; HFD, high fat diet.
Figure 5:
Figure 5:. Epithelial HDAC3 regulates expression of the lipid transporter gene Cd36 by coactivating ERRα through PGC-1α.
(A,B) Genome browser view of the Cpt1a locus, showing H3K9ac marks in small intestinal epithelial cells from CV and GF WT mice (A), and CV Hdac3fl/fl and Hdac3ΔIEC mice (B). Statistical test for circadian rhythms: P=0.0007 for CV, P=0.504 for GF, and P=0.00012 for Hdac3fl/fl and Hdac3ΔIEC mice. (C,D) Diurnal expression of Cd36 transcript (C) and protein (D) in IECs from Hdac3fl/fl CV mice, Hdac3ΔIEC CV mice and GF WT mice. N=3 mice per group. (E) ChIP-qPCR analysis of HDAC3 binding at the Cd36 promoter in CV and GF mice across a day-night cycle. (F) Relative abundance of bound HDAC3 at Cd36 in small intestinal epithelial cells from WT and Nr1d1−/− mice as determined by ChIP-qPCR analysis. N=3 mice per time point per group. (G) ChIP-qPCR analysis of H3K9ac and H3K27ac marks at Cd36 in IECs from Hdac3fl/fl and Hdac3ΔIEC mice (at ZT14). (H) Co-immunoprecipitation of endogenous HDAC3 and PGC-1α in IECs from Hdac3fl/fl and Hdac3ΔIEC mice. N=3 pooled biological replicates per lane. (I) ChIP-qPCR analysis of HDAC3, PGC-1α and ERRα shows co-localization at the Cd36 promoter in IECs from CV WT mice. “Binding region” refers to a known binding site for each protein at the Cd36 locus in adipose tissue (17). N=3 mice per group. (J) Luciferase reporter assay of transcription driven by a Cd36 promoter, demonstrating combinatorial effects of HDAC3, PGC-1α and ERRα. Empty vector was used in the control group. N=3 per group. (K) Model showing how the intestinal microbiota regulates diurnal rhythms in epithelial metabolic pathways through HDAC3. *P<0.05; **P<0.01; ns, not significant by two-tailed t-test. Means±SEM (error bars) are plotted. ZT, Zeitgeber time; CV, conventional; GF, germ-free.

Comment in

  • Microbial conductors.
    Du Toit A. Du Toit A. Nat Rev Microbiol. 2019 Dec;17(12):722-723. doi: 10.1038/s41579-019-0285-3. Nat Rev Microbiol. 2019. PMID: 31591501 No abstract available.
  • Microbes help to track time.
    Bishehsari F, Keshavarzian A. Bishehsari F, et al. Science. 2019 Sep 27;365(6460):1379-1380. doi: 10.1126/science.aaz0224. Science. 2019. PMID: 31604257 No abstract available.

References

    1. Turnbaugh PJ, Hamady M, Yatsunenko T, Cantarel BL, Duncan A, Ley RE, Sogin ML, Jones WJ, Roe BA, Affourtit JP, Egholm M, Henrissat B, Heath AC, Knight R, Gordon JI, A core gut microbiome in obese and lean twins. Nature 457, 480–484 (2009). - PMC - PubMed
    1. Backhed F, Ding H, Wang T, Hooper LV, Koh GY, Nagy A, Semenkovich CF, Gordon JI, The gut microbiota as an environmental factor that regulates fat storage. Proc. Natl. Acad. Sci. USA 101, 15718–15723 (2004). - PMC - PubMed
    1. Turnbaugh PJ, Ley RE, Mahowald MA, Magrini V, Mardis ER, Gordon JI, An obesity-associated gut microbiome with increased capacity for energy harvest. Nature 444, 1027–1031 (2006). - PubMed
    1. Tilg H, Kaser A, Gut microbiome, obesity, and metabolic dysfunction. J. Clin. Invest 121, 2126–2132 (2011). - PMC - PubMed
    1. Thaiss CA, Levy M, Korem T, Dohnalova L, Shapiro H, Jaitin DA, David E, Winter DR, Gury-BenAri M, Tatirovsky E, Tuganbaev T, Federici S, Zmora N, Zeevi D, Dori-Bachash M, Pevsner-Fischer M, Kartvelishvily E, Brandis A, Harmelin A, Shibolet O, Halpern Z, Honda K, Amit I, Segal E, Elinav E, Microbiota diurnal rhythmicity programs host transcriptome oscillations. Cell 167, 1495–1510 e1412 (2016). - PubMed

Publication types

MeSH terms