. 2019 Sep 27;365(6460):1461-1466.
doi: 10.1126/science.aat5031.

Spatiotemporal immune zonation of the human kidney

Affiliations

Spatiotemporal immune zonation of the human kidney

Benjamin J Stewart et al. Science. .

Abstract

Tissue-resident immune cells are important for organ homeostasis and defense. The epithelium may contribute to these functions directly or by cross-talk with immune cells. We used single-cell RNA sequencing to resolve the spatiotemporal immune topology of the human kidney. We reveal anatomically defined expression patterns of immune genes within the epithelial compartment, with antimicrobial peptide transcripts evident in pelvic epithelium in the mature, but not fetal, kidney. A network of tissue-resident myeloid and lymphoid immune cells was evident in both fetal and mature kidney, with postnatal acquisition of transcriptional programs that promote infection-defense capabilities. Epithelial-immune cross-talk orchestrated localization of antibacterial macrophages and neutrophils to the regions of the kidney most susceptible to infection. Overall, our study provides a global overview of how the immune landscape of the human kidney is zonated to counter the dominant immunological challenge.


Conflict of interest statement

Competing interests: Authors declare no competing interests.

Figures

Fig. 1
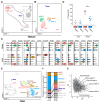
Fig. 1. Mapping the spatial and temporal architecture of the mature and developing human kidney
A. Anatomy of the human kidney. B. UMAP plot of 40,268 human mature kidney cells. Compartments illustrated in colors (red, immune; blue, vasculature; green, nephron; mauve, stroma). Annotations derived from compartment-specific analysis (Fig. S8, 11, 13). C. UMAP plots illustrating the contribution made by cells from biopsies at inferred biopsy depths, with density contours colored according to compartments [B]. D. Barplots showing the proportion of immune cells at each inferred biopsy depth. E. UMAP plot of 27,203 human fetal kidney cells. Compartments illustrated in colors (red, immune; blue, vasculature; green, developing nephron; mauve, stroma). Annotations derived from compartment-specific analysis (Fig. S7, 15). F. Diagram illustrating steps in development of the nephron through early fetal life. The ureteric bud (UB) undergoes branching and instructs development of cap mesenchyme (CM) into renal vesicle (RV) and subsequently S-shaped body (SSB). UB forms distal nephron structures, whilst SSB forms proximal structures. G. Proportional contribution of fetal developing nephron cell types at distinct developmental time points. Cell types are colored as in Fig S7F. H. UMAP plots illustrating the contribution made by cells from kidneys at discrete developmental time points, with density contours colored according to compartments [E]. PCW, post-conception weeks. Annotations: MNP, mononuclear phagocyte; MPhage, macrophage; NØ, neutrophil; Mast, mast cell; pDC, plasmacytoid dendritic cell; B, B cell; NK, natural killer cell; NKT, natural killer T cell; CD4 T, CD8 T, CD4 and CD8 T cell; MK, megakaryocyte; AVRE, ascending vasa recta endothelium; DVRE, descending vasa recta endothelium; PCE, peritubular capillary endothelium; GE, glomerular endothelium; PE, pelvic epithelium; TE, transitional epithelium of ureter; LOH, loop of Henle; CNT, connecting tubule; PC, principal cell; IC (A+B), type A and B intercalated cells; Podo, podocyte; PT, proximal tubule; dPT, distinct proximal tubule; EPC, epithelial progenitor cell; Fib, fibroblast; MFib, myofibroblast; CM, cap mesenchyme; Prl-CM, proliferating cap mesenchyme; RV, renal vesicle; SSB, S shaped body; UB, ureteric bud.
Fig. 2
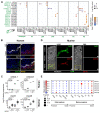
Fig. 2. Gene expression patterns in the developing and mature nephron
A. Heatmap of mean similarity scores between fetal and mature nephron cell types. B. Upper panel: heatmap of mean scaled scores for immune process genesets (Innate immune response, GO:0045087; Defense response, GO:0006952; Immune response, GO:0006955; Antimicrobial humoral response, GO:0019730). Lower panel: heatmap of mean expression values of antimicrobial peptides (AMPs) amongst pelvic epithelium marker genes. Point size shows the fraction of cells with non-zero expression. C. Log10 transformed relative expression levels of LCN2 and SAA1 (human) and Lcn2 and Saa1/2 (murine) in kidneys following UPEC challenge (measured by qPCR, values relative to unstimulated cortical samples (n = 3 (human), n = 6 (murine), ANOVA - ***. p < 0.0005; **, p <0.005; *, p < 0.05; NS, not significant). Boxplots show median values and interquartile range. C, cortex; M/P, medulla/pelvis.
Fig. 3
Fig. 3. Myeloid cell populations in the mature and developing kidney
A. UMAP plot illustrating the cell populations identified in 7803 mature kidney immune cells. The myeloid sub-compartment is circled and lymphoid cells de-colored. B. UMAP plot illustrating four subsets of mononuclear phagocyte (MNPa-d), neutrophils, mast cells, and plasmacytoid dendritic cells, after reanalysis of 1347 cells of the mature kidney myeloid sub-compartment. C. Violin plots showing expression levels of canonical myeloid population markers. D. Efficiency of FITC-labelled UPEC phagocytosis by CD14+ HLA-DR+ CD36+ (MNPa) and CD14+ HLA-DR+ CD206+ (MNPd) cells from adult human kidney, by flow cytometry (n = 4; *, p < 0.05 (Wilcoxson rank sum test)). Representative plot showing technical replicates. E. UMAP plot illustrating the cell populations identified in 6847 fetal immune cells. Lymphoid cells are decolored. F. Plot showing proportional contribution of cell types identified in [3E] to the fetal immune compartment over developmental time. PCW, post-conception weeks. Lymphoid cells are decolored. H. Plot showing geneset scores of M1 and M2 macrophage polarisation signatures (derived from GSE5099 - LPS vs Il4 stimulated bone marrow derived macrophages) amongst fetal and mature MNP. Grey points, single cell geneset scores; colored points, mean scores for each cell type.
Fig. 4
Fig. 4. Spatial topology of myeloid cell populations in the mature kidney
A. Heatmap of chemokine ligand-receptor interactions between mature myeloid and nephron cell types arranged by proximal to distal nephron organization. Point size indicates permutation p value (CellPhoneDB). Color indicates the scaled mean expression level of ligand and receptor (Mol1/2). B. Confocal microscopy images illustrating co-expression of CK17 (white), CXCL8 (green), and LCN2 (red) in human medullary and pelvic epithelium. M/P, medulla/pelvis. Scale bars 20 μm. C. Plots illustrating Log10 transformed relative expression of CXCL1 and CXCL8 (human) and Cxcl1 and Cxcl2 (murine) in response to UPEC at distinct kidney depths, by qPCR. Values relative to unstimulated cortex (n = 3 (human), n = 6 (murine), ANOVA - ***, p < 0.0005; **, p <0.005; *, p < 0.05; NS, not significant). Boxplots show median values and interquartile range. C, cortex; M/P, medulla/pelvis. D. Confocal microscopy images of kidneys from LysM-GFP transgenic reporter mice stained with anti-GFP (green), phalloidin (white), and anti-CD11b (red) after catheterisation with UPEC or PBS control. Left panels: full depth tiles from cortex to pelvis. Right panels: zoom of the region highlighted (yellow). Scale bars 70 μm. E. Heatmap of mean expression values of neutrophil recruiting chemokines. Point size shows the fraction of cells with non-zero expression.

Comment in

References

    1. Kurts C, Panzer U, Anders HJ, Rees AJ. The immune system and kidney disease: basic concepts and clinical implications. Nat Rev Immunol. 2013;13:738–753. - PubMed
    1. Giebisch G. Coupled ion and fluid transport in the kidney. N Engl J Med. 1972;287:913–919. - PubMed
    1. Berry MR, et al. Renal Sodium Gradient Orchestrates a Dynamic Antibacterial Defense Zone. Cell. 2017;170:860–874 e819. - PubMed
    1. Young MD, et al. Single-cell transcriptomes from human kidneys reveal the cellular identity of renal tumors. Science. 2018;361:594–599. - PMC - PubMed
    1. Young MD, Behjati S. SoupX removes ambient RNA contamination from droplet based single cell RNA sequencing data. BioRxiv. 2018 doi: 10.1101/303727. - DOI - PMC - PubMed

Publication types