. 2019 Sep 27;365(6460):1466-1469.
doi: 10.1126/science.aav7321.

Chromosome errors in human eggs shape natural fertility over reproductive life span

Affiliations

Chromosome errors in human eggs shape natural fertility over reproductive life span

Jennifer R Gruhn et al. Science. .

Abstract

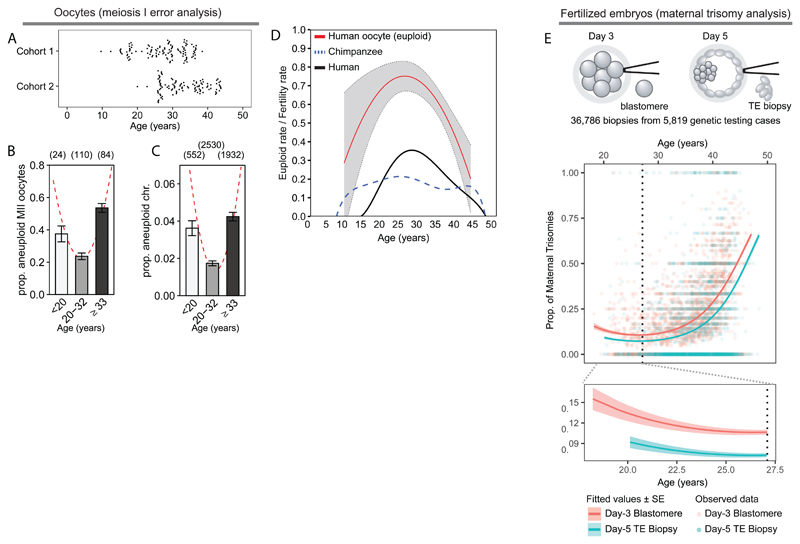
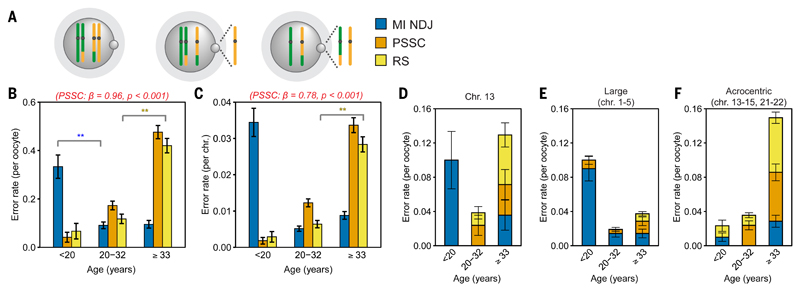
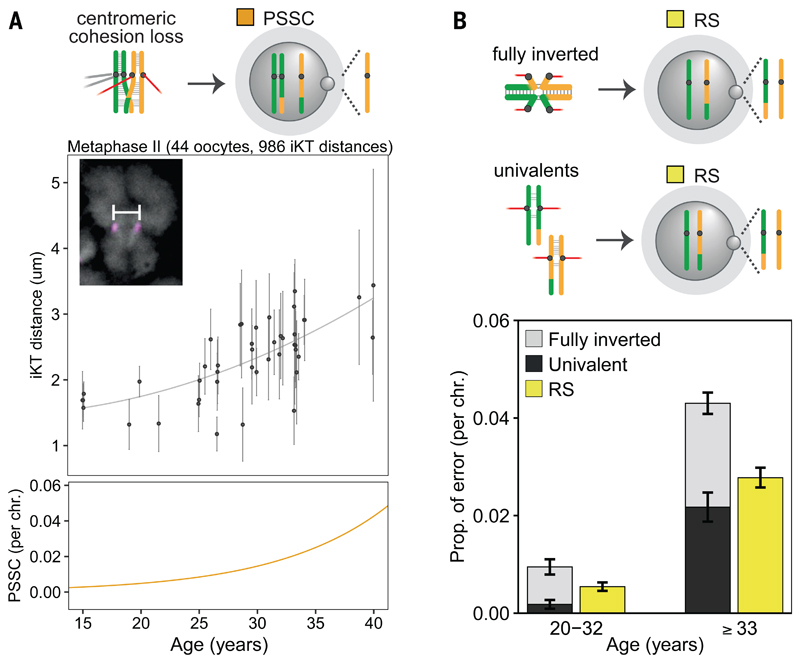
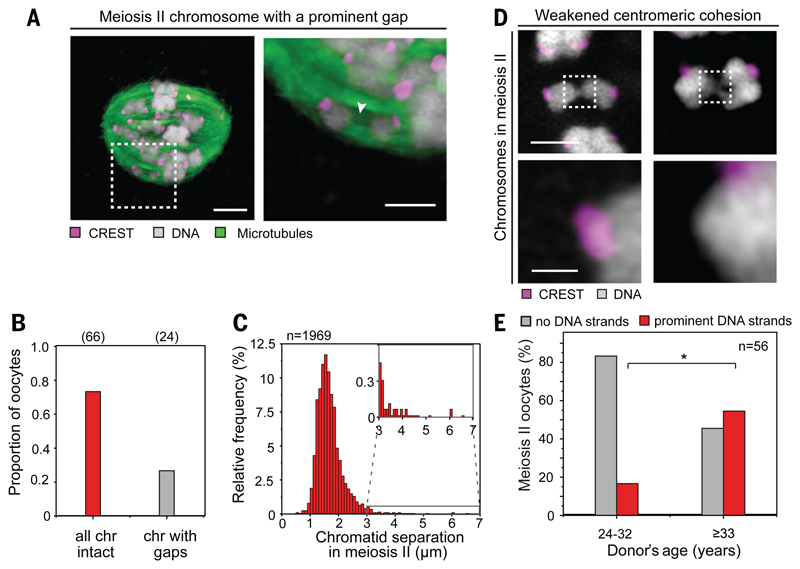
Chromosome errors, or aneuploidy, affect an exceptionally high number of human conceptions, causing pregnancy loss and congenital disorders. Here, we have followed chromosome segregation in human oocytes from females aged 9 to 43 years and report that aneuploidy follows a U-curve. Specific segregation error types show different age dependencies, providing a quantitative explanation for the U-curve. Whole-chromosome nondisjunction events are preferentially associated with increased aneuploidy in young girls, whereas centromeric and more extensive cohesion loss limit fertility as women age. Our findings suggest that chromosomal errors originating in oocytes determine the curve of natural fertility in humans.


Conflict of interest statement

Competing interests: The authors declare no competing interests.

Figures

Fig. 1
Fig. 1. Meiotic segregation errors follow a U-curve according to female age.
(A) Age ranges for aneuploidy analysis from cohort 1 (top) and cohort 2 (bottom). (B and C) Aneuploidy rates of combined cohorts by (B) oocyte (n = 218) and (C) chromosome (n=5,014) analysed by NGS (n=90), chromosome spread (n=55), or SNP array (n=73) (table S1). Fitted curves in red. Error bars: standard error of a proportion. (D) Oocyte euploid rate (1-aneuploidy rate; from fig. 1B) (red) with standard errors (grey), compared to age-specific fertility rates (ref. 1) in human (black) and chimpanzee (blue dotted line). (E) Observed per-case proportions of embryos with one or more maternal meiotic chromosome gains (points). Lines indicate fitted values (dark) and standard errors across maternal age (pale). Sample type pink: day-3 blastomeres; blue: day-5 trophectoderm (TE) biopsies. (Top) A quadratic model fit to the full dataset (χ2-of-deviance, p<1×10-43; pseudo-R2=0.240). (Bottom) A linear model fit to patients younger than 27.1 years (dotted line; fig. S12), revealing a negative relationship with maternal age (β=-0.082, 95% CI [-0.157, 5.88×10⁻³], p=0.034).
Fig. 2
Fig. 2. Meiosis I error types respond differentially to female age.
(A) Segregation error types. (B and C) Rate of meiosis I error patterns by oocyte (B) and chromosome (C). Exact tests: p<0.05 (*) and p<0.025 (**). Beta and the p-value PSSC (red). Error bars: standard error of a proportion. (D-F) Distinct age dependent segregation error trends identified for (D) chromosome 13, (E) the largest chromosomes (1-5; groups A & B), and (F) the acrocentric chromosomes (13-15, 21, and 22). Error bars: standard error of a proportion.
Fig. 3
Fig. 3. Centromeric and extensive cohesion weakening correlate with PSSC and RS.
(A) Sister kinetochore distances (mean and st. dev.) of MII oocytes. Inset: spread chromosome (gray: DAPI; magenta: centromeres marked by CREST serum) and iKT measurement (white bar). Quadratic fit to iKT distances in grey (top) compared to a linear regression to PSSC rates from fig. 2C in orange (bottom). (B) Combined rate of univalents (dark grey) and fully-inverted bivalents (light grey; data from ref. 20), compared RS rate from MII oocytes in fig. 2C (yellow). Red: microtubules. Error bars: standard error of a proportion.
Fig. 4
Fig. 4. Chromatin threads in human meiosis.
(A) MII chromosomes with prominent gaps aligned correctly on the spindle. Arrow points to a prominent gap between sister chromatids (gray: DNA, magenta: centromeres marked by CREST serum, green: microtubules). Scale bars: 4μm (overview) and 2μm (inset). (B and C) Proportion of oocytes having at least one chromosome with a pronounced gap (B) and quantitative analysis of separation of the two chromatids across the entire oocyte cohort (C). (D) Chromatin threads between chromatids with weakened centromeric cohesion. All chromosomes captured prior to anaphase onset. Scale bars: 2μm (overview) and 0.5μm (insets). (E) Proportion of MII oocytes with chromatin threads by donor age grouped into above and below our AMAs cut-off. Exact test: p<0.05 (*). All analysis performed on intact spindles.

Comment in

Similar articles

Cited by

References

    1. Hawkes K, Smith KR. Ann N Y Acad Sci. 2010;1204:43–53. - PMC - PubMed
    1. Huseynov A, et al. Proc Natl Acad Sci U S A. 2016;113:5227–5232. - PMC - PubMed
    1. Kumar A, et al. Indian J Pediatr. 2007;74:927–931. - PubMed
    1. Kim PS, et al. Proc Biol Sci. 2012;279:4880–4884. - PMC - PubMed
    1. Zelazowski MJ, et al. Cell. 2017;171:601–614 e613. - PMC - PubMed

Publication types