. 2019 Sep 27;365(6460):1469-1475.
doi: 10.1126/science.aax4804.

Ultrasound imaging of gene expression in mammalian cells

Affiliations

Ultrasound imaging of gene expression in mammalian cells

Arash Farhadi et al. Science. .

Abstract

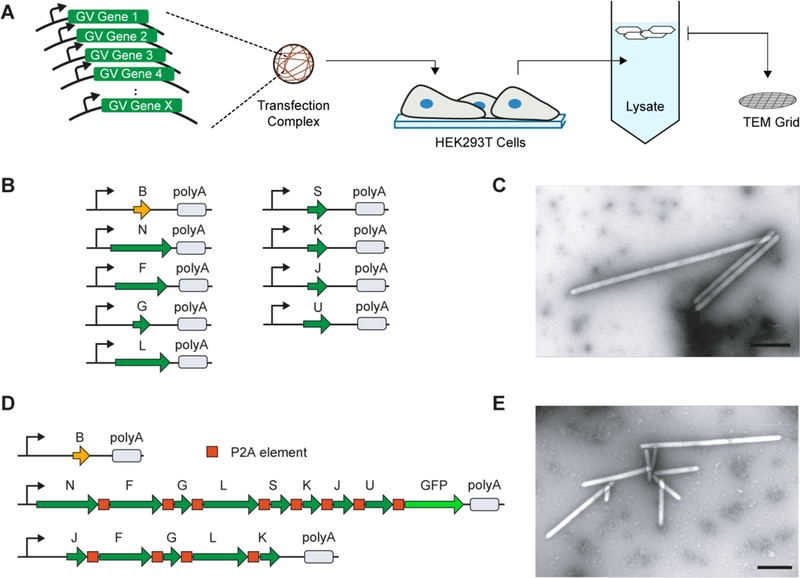
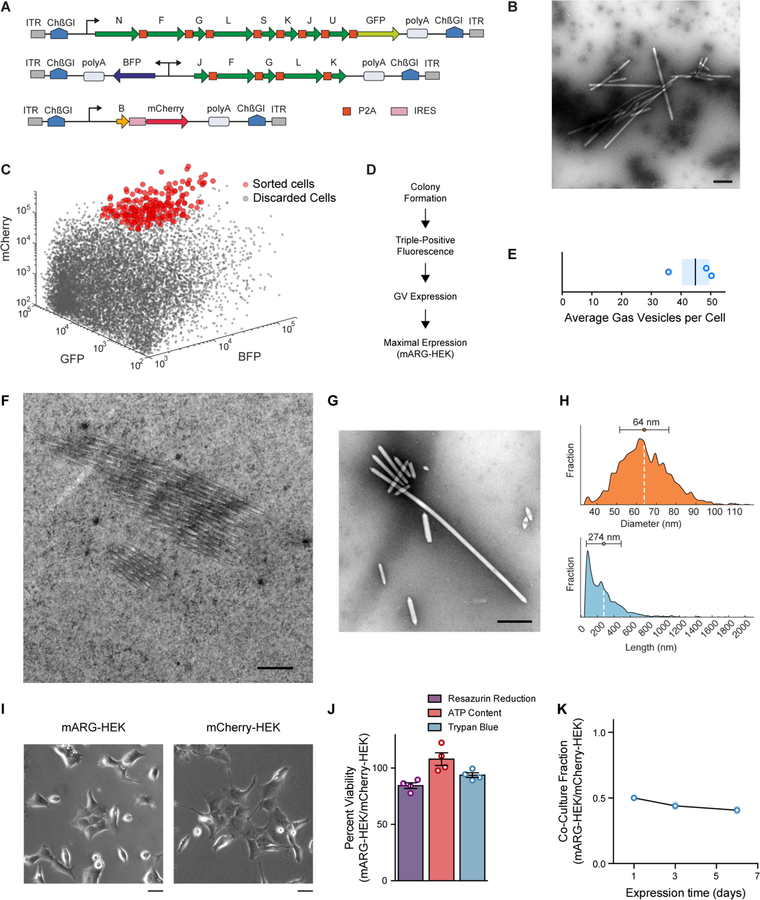
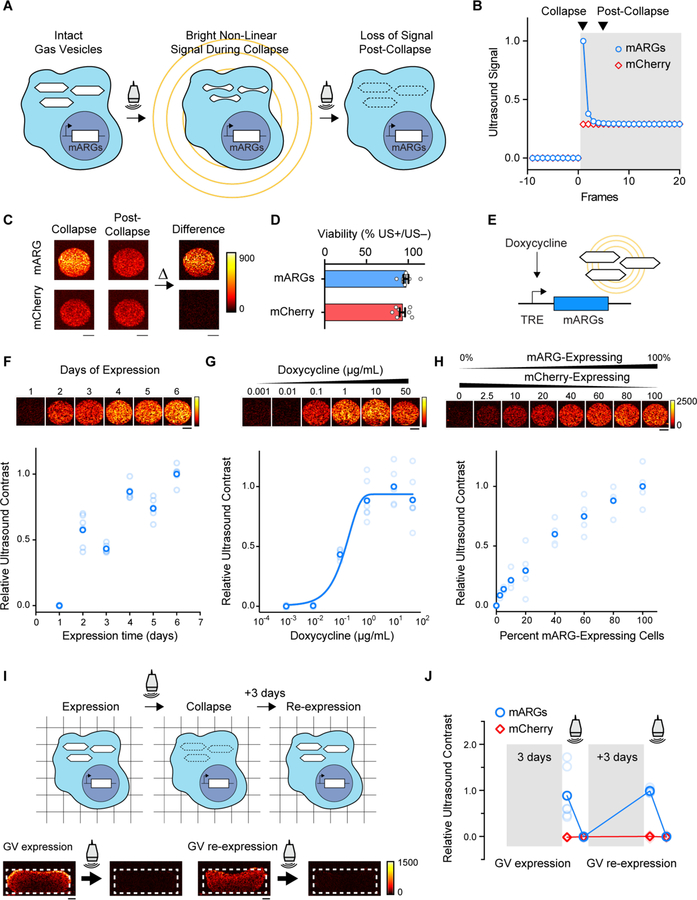
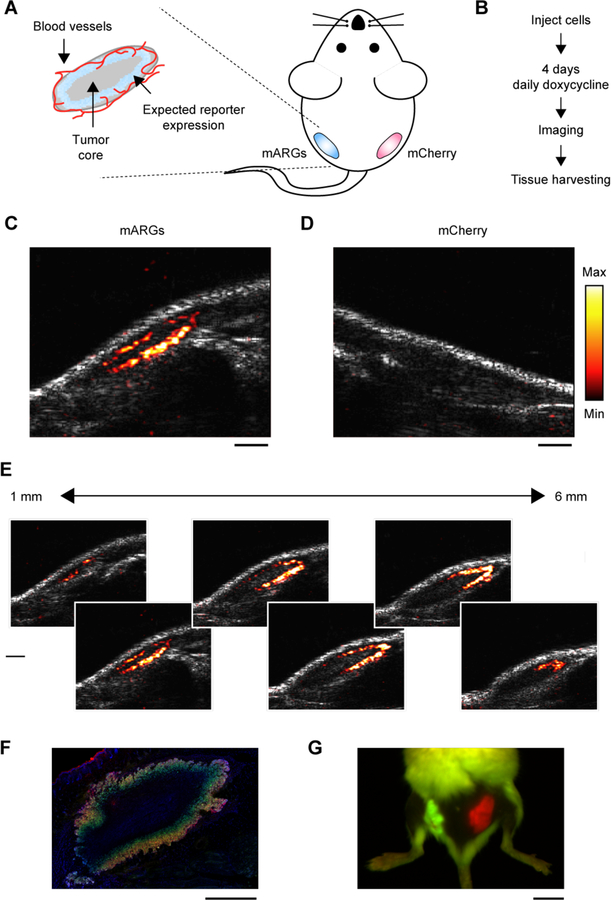
The study of cellular processes occurring inside intact organisms requires methods to visualize cellular functions such as gene expression in deep tissues. Ultrasound is a widely used biomedical technology enabling noninvasive imaging with high spatial and temporal resolution. However, no genetically encoded molecular reporters are available to connect ultrasound contrast to gene expression in mammalian cells. To address this limitation, we introduce mammalian acoustic reporter genes. Starting with a gene cluster derived from bacteria, we engineered a eukaryotic genetic program whose introduction into mammalian cells results in the expression of intracellular air-filled protein nanostructures called gas vesicles, which produce ultrasound contrast. Mammalian acoustic reporter genes allow cells to be visualized at volumetric densities below 0.5% and permit high-resolution imaging of gene expression in living animals.


Conflict of interest statement

Competing interests: The authors declare no competing financial interests. The authors are inventors on patent applications related to acoustic reporter genes filed by the California Institute of Technology.

Figures

Fig. 1.
Fig. 1.. Engineering of mammalian acoustic reporter genes.
(A) Schematic of the transient co-transfection assay used to identify combinations of genes capable of producing gas vesicles in mammalian cells. (B) Schematic of nine genes from B. megaterium capable of encoding gas vesicle expression in mammalian cells. Thin arrow denotes CMV promoter. polyA denotes SV40 polyadenylation element. (C) Representative TEM image of purified gas vesicles expressed in HEK293T cells. (D) Gene cassettes comprising the mammalian acoustic reporter gene construct, mARG. (E) Representative TEM image of gas vesicles purified from HEK293T cells transiently transfected with mARGs for 72 hours. All scale bars represent 500 nm.
Fig. 2.
Fig. 2.. Formation, properties and non-toxicity of gas vesicles in cells with genome-integrated mammalian acoustic reporter genes.
(A) Schematic of mARG constructs used for genomic integration into cells with the piggyBac transposase system. ITR, inverted terminal repeat; ChβGI, Chicken beta-globin insulator; GFP, Emerald green fluorescent protein; BFP, enhanced blue fluorescent protein 2. (B) Representative TEM image of buoyancy-enriched lysate from HEK293-tetON cells transfected with the constructs in (A) and sorted for high expression of all three operons. (C) Fluorescence-activated cell sorting of HEK293-tetON cells transfected with the constructs in (A). Red circles denote individual cells selected by sorting to form monoclonal cell lines. (D) Selection process for monoclonal cell lines, including assays for viability, fluorescence intensity and gas vesicle yield. (E) Number of gas vesicles expressed by monoclonal HEK293-tetON cells after 72 hours of induced expression, as counted in lysates using TEM. Bar represents the mean and the shaded area represents SEM (n=3, each from two technical replicates). (F) Representative TEM image of a 60-nm section through an mARG-HEK cell showing an angled slice through two bundles of gas vesicles in the cytosol. (G) Representative TEM image of gas vesicles purified from mARG-HEK cells. (H) Size distribution of gas vesicles expressed in mARG-HEK cells. The mean and standard deviation of both distributions is illustrated as a circle and with error bars. (n=1828) (I) Phase contrast images of mARG-HEK and mCherry-HEK cells 72 hours after induction with 1 µg/mL doxycycline and 5 mM sodium butyrate. (J) Cell viability of mARG-HEK cells relative to mCherry-HEK cells after 72 hours of gene expression. Error bars indicate SEM. (K) Fraction of mARG-HEK cells in co-culture with mARG-mCherry cells seeded in equal numbers over 6 days of gene expression (n=3 biological replicates, each from 4 technical replicates, with darker symbols showing the mean). Scale bars in B, F, G represent 500 nm. Scale bar in I represents 20 µm.
Fig. 3.
Fig. 3.. Ultrasound imaging of mammalian gene expression in vitro.
(A) Illustration of the collapse-based ultrasound imaging paradigm used to generate gas vesicle-specific ultrasound contrast from mARG-expressing cells. (B) Representative non-linear signal recorded during a step change in the incident acoustic pressure, from 0.27 MPa in the white-shaded region to 1.57 MPa in the grey-shaded region. (C) Representative collapse and post-collapse ultrasound images of mARG-HEK and mCherry-HEK cells acquired during this ultrasound imaging paradigm and their difference, indicating gas vesicle-specific contrast. (D) Cellular viability after being insonated under 3.2 MPa acoustic pressures, as measured using the MTT assay. (E) Schematic of a chemically inducible gene circuit with mARG expression as its output. All three mARG cassettes in mARG-HEK cells are under the control of the doxycycline-inducible TRE3G promoter (TRE), with expression triggered by incubation with doxycycline. (F) Representative ultrasound images and contrast measurements in mARG-HEK cells as a function of time following induction with 1 µg/mL of doxycycline and 5 mM sodium butyrate (n=6, with the darker dots showing the mean). (G) Representative ultrasound images and contrast measurements in mARG-HEK cells as a function of doxycycline induction concentrations. Cells were allowed to express gas vesicles for 72 hours in the presence of 5 mM sodium butyrate. (n=6, with the darker dots showing the mean). A sigmoidal function is fitted as a visual guide. (H) Representative ultrasound images and contrast measurements in mARG-HEK cells mixed with mCherry-HEK cells in varying proportions. Cells were induced with 1 µg/mL of doxycycline and 5 mM sodium butyrate for 72 hours prior to imaging. (n=4, with the darker dots showing the mean) (I) Schematic and representative ultrasound images from mARG-HEK cells in Matrigel re-expressing gas vesicles after acoustic collapse. Cells were induced with 1 µg/mL of doxycycline and 5 mM sodium butyrate for 72 hours before and after 3.2 MPa acoustic insonation. Ultrasound images were acquired after an additional 72 hours in culture following collapse. (J) Ultrasound contrast in mARG-HEK and mCherry-HEK cells after initial expression, after collapse, after re-expression and after second collapse. (n=7, with the darker dots showing the mean). GV, gas vesicles. All scale bars represent 1 mm.
Fig. 4.
Fig. 4.. Ultrasound imaging of mammalian gene expression in vivo.
(A) Diagram of a mouse implanted with a subcutaneous tumor model, and the expected spatial pattern of vascularization and doxycycline-induced reporter gene expression. (B) Experimental timeline. (C) Representative ultrasound image of tumors containing mARG-HEK cells after 4 days of doxycycline administration. mARG-specific contrast shown in the hot colormap is overlaid on an anatomical B-mode image showing the background anatomy. (D) Representative ultrasound image of tumors containing mCherry-HEK cells after 4 days of doxycycline administration. (E) Ultrasound images of adjacent planes in the mARG-HEK tumor acquired at 1 mm intervals. The minimum and maximum values of color bars in C-E are 4000 and 40000 au, respectively. (F) Representative fluorescence image of a histological tissue section of an mARG-HEK tumor. Blue color shows the TO-PRO3 nucleus stain, green color shows GFP fluorescence and red color shows mCherry fluorescence. (G) Fluorescence image of a mouse implanted with mARG-HEK and mCherry-HEK tumors on the left and right flanks, respectively, after 4 days of expression. Scale bars for are 1 mm for C–F and 1 cm for G.

Comment in

  • A sound strategy for gene expression.
    Burgess DJ. Burgess DJ. Nat Rev Genet. 2019 Dec;20(12):703. doi: 10.1038/s41576-019-0181-8. Nat Rev Genet. 2019. PMID: 31578467 No abstract available.
  • Listening for Gene Expression.
    Luker GD. Luker GD. Radiol Imaging Cancer. 2019 Nov 29;1(2):e194008. doi: 10.1148/rycan.2019194008. eCollection 2019 Nov. Radiol Imaging Cancer. 2019. PMID: 33778686 Free PMC article. No abstract available.

References

    1. Tsien RY, Imagining imaging’s future. Nature Reviews Molecular Cell Biology 4, SS16–SS21 (2003). - PubMed
    1. Piraner DI et al., Going Deeper: Biomolecular Tools for Acoustic and Magnetic Imaging and Control of Cellular Function. Biochemistry 56, 5202–5209 (2017). - PMC - PubMed
    1. Chu J et al., A bright cyan-excitable orange fluorescent protein facilitates dual-emission microscopy and enhances bioluminescence imaging in vivo. Nat Biotech 34, 760–767 (2016). - PMC - PubMed
    1. Santos EB et al., Sensitive in vivo imaging of T cells using a membrane-bound Gaussia princeps luciferase. Nat Med 15, 338–344 (2009). - PMC - PubMed
    1. Maresca D et al., Biomolecular Ultrasound and Sonogenetics. Annu Rev Chem Biomol Eng 9, 229–252 (2018). - PMC - PubMed

Publication types