. 2019 Oct 11;20(1):206.
doi: 10.1186/s13059-019-1812-2.

MetaCell: analysis of single-cell RNA-seq data using K-nn graph partitions

Affiliations

MetaCell: analysis of single-cell RNA-seq data using K-nn graph partitions

Yael Baran et al. Genome Biol. .

Abstract

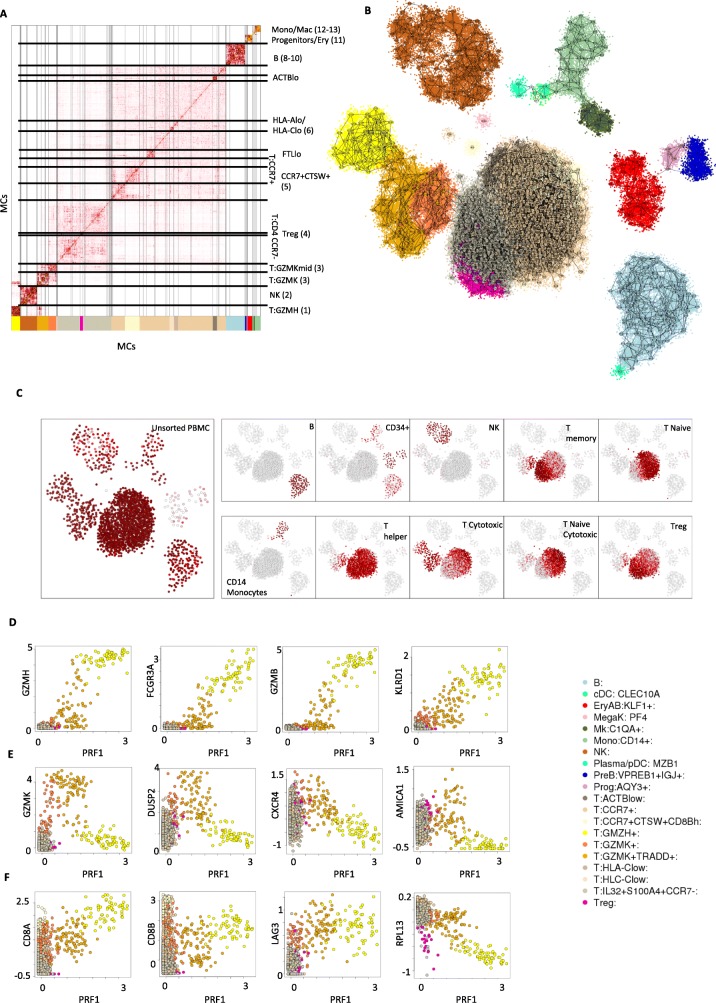
scRNA-seq profiles each represent a highly partial sample of mRNA molecules from a unique cell that can never be resampled, and robust analysis must separate the sampling effect from biological variance. We describe a methodology for partitioning scRNA-seq datasets into metacells: disjoint and homogenous groups of profiles that could have been resampled from the same cell. Unlike clustering analysis, our algorithm specializes at obtaining granular as opposed to maximal groups. We show how to use metacells as building blocks for complex quantitative transcriptional maps while avoiding data smoothing. Our algorithms are implemented in the MetaCell R/C++ software package.

Keywords: Clustering; Graph partition; Multinomial distribution; RNA-seq; Sampling variance; Smoothing; scRNA-seq.


Conflict of interest statement

The authors declare that they have no competing interests.

Figures

Fig. 1
Fig. 1
Metacell analysis of the PBMC 8K dataset. a Schematics of the MC algorithmic pipeline. b Outlier/rare cells matrix showing color-coded number of UMIs per cells (columns) for which at least one gene (rows) was shown to be expressed significantly beyond its MC expected number of UMIs. Outlier/rare cells are ordered according to the annotation of the MC containing them (bottom color-coded bars). c Shown are log-fold-enrichment (lfp, methods) values for metacells, color-coded according to initial cell type annotation, comparing the T cell marker (CD3D) to a B cell (CD79A) and myeloid (LYZ) markers. d Heat map shows enrichment values for metacells (columns) and their maximally enriched gene markers. e Shown is the MC adjacency graph (numbered nodes connected by edges), color-coded according to their cell type and transcriptional state annotation. Cells are shown as small color-coded points localized according to the coordinates of MCs adjacent to them. Additional file 2: Figure S3 shows the adjacency matrix that was used to generate the projection
Fig. 2
Fig. 2
Evaluation of within-MC transcriptional homogeneity. a Shown are the number of incoming and outgoing neighbors (or degree) per cell, averaged over metacells that are color-coded by cell type annotation as in Fig. 1. The data represent the raw K-nn similarity graph (left), balanced MC graph (center), and resampled co-occurrence graph (right). b Heat map summarizing the number of edges in the balanced MC graph that link two cells associated with different MCs. Similar matrices generated based on the raw and co-occurrence graphs are shown in Additional file 2: Figure S4. c Bar graph shows the closure per MC (fraction of intra-MC edges out of all edges linking cells in the MC). d Observed (blue) vs predicted (red, based on binomial model) distributions of down-sampled UMI count per gene within MCs. For each of the 5 MCs depicted, the plots show binomial fit for the top 8 enriched genes. Intervals give 10th and 90th percentiles over multiple down-samples of the cells within each metacell to uniform total counts. e Over-dispersion of genes relative to a binomial model across genes and MCs. Colors encode ratio of observed to expected variance across genes (rows) and MCs (columns). Only genes and MCs manifesting high over-dispersion are shown. f Residual within-MC correlation patterns compared with global correlation patterns. Within-MC correlation matrix (left) was computed by averaging gene-gene correlation matrices across MCs, where each matrix was computed using log-transformed UMIs over down-sampled cells. Global correlation matrix (right) was computed in the same manner, but following permutation of the MC assignment labels. For both matrices, only genes manifesting strong correlations are shown. g Examples of residual intra-MC correlated genes, showing observed correlations (Pearson on log-transformed down-sampled UMIs) compared to correlations expected by sampling from a multinomial. MC #66 show weak residual correlations reflecting mostly stress genes. MC #70 shows stronger residual correlations, reflecting residual intra-MC variation
Fig. 3
Fig. 3
MCs robustly approximate the expression manifold. a Boxplots show the distribution of predicted (using MC pool frequencies) UMI fraction per cell stratified according to observed number of UMIs in down-sampled single cells. b Shown are per-gene Pearson correlations between predicted and observed gene frequencies for genes, color coded according to the gene’s frequency across all cells. In all cases, predictions are generated using a 100-fold cross-validation scheme (see the “Methods” section for exact description of the procedure and the strategies compared). Predictions using K-nns over raw MC similarities (a different neighborhood per cell consisting of its k most similar neighbors) are used as reference. It is compared to strategies defining cell neighborhoods using MCs (fixed disjoint grouping of cells), K-nn over Seurat distances, and MAGIC distances (weighted neighborhood according to diffusion distances). c Similar to panels in b but comparing accuracy with and without applying cross validation. Points with high value along the y axis represent potential over-fitting. d, e Per-MC (left most column) or smoothed per-cell (all other columns) expression values for pairs of genes, portraying putative transcriptional gradients
Fig. 4
Fig. 4
MC analysis of a whole-organism single-cell dataset. a 2D projection of C. elegans metacells and single cells, color-coded according to the most frequent cell type based on the classification from Cao et al. b Top—normalized expression of 1380 highly variable genes across 38,159 C. elegans single cells (columns), sorted by metacell. Bottom—bar plot showing for each metacell the single-cell composition of the different originally classified cell types. c Relationship between the metacell median cell size (UMIs/cell) and the fraction of cells originally labeled as “unclassified” in Cao et al. d Comparison of the median sizes (UMIs/cell) of originally unclassified cells versus classified cells in each metacell. e Expression (molecules/10,000 UMIs) of selected marker transcription factors (top row) and effector genes (bottom row) across all metacells, supporting high transcriptional specificity for four examples of metacells containing a high fraction (> 80%) of originally unclassified cells
Fig. 5
Fig. 5
MC analysis of a 160K PBMC multi-batch dataset. a, b Matrix (a) and graph (b) visualization for the similarity structure associating MCs in a model characterizing 162,000 PBMCs. Clusters in the MC matrix are used for linking specific groups of MCs with specific annotation and for color coding. c Shown are the fraction of cells from different sorting batches per MC, color coded white to red to black and visualized using the MC 2D projection as shown in Fig. 4B. d Shown are lfp values for MCs in the PBMC 160K model, comparing intensity of Perforin expression (X axis) to several genes correlated with the CD8+ effector program. e Similar to d for genes showing transient activation during the effector program build-up. f Similar to d for CD8 genes, LAG3 (a T cell exhaustion marker) and a representative ribosomal protein gene

References

    1. Kumar RM, Cahan P, Shalek AK, Satija R, DaleyKeyser AJ, Li H, et al. Deconstructing transcriptional heterogeneity in pluripotent stem cells. Nature. 2014;516(7529):56. doi: 10.1038/nature13920. - DOI - PMC - PubMed
    1. Macosko EZ, Basu A, Satija R, Nemesh J, Shekhar K, Goldman M, et al. Highly parallel genome-wide expression profiling of individual cells using nanoliter droplets. Cell. 2015;161(5):1202–1214. doi: 10.1016/j.cell.2015.05.002. - DOI - PMC - PubMed
    1. Jaitin DA, Kenigsberg E, Keren-Shaul H, Elefant N, Paul F, Zaretsky I, et al. Massively parallel single-cell RNA-seq for marker-free decomposition of tissues into cell types. Science. 2014;343(6172):776–779. doi: 10.1126/science.1247651. - DOI - PMC - PubMed
    1. Zeisel A, Muñoz-Manchado AB, Codeluppi S, Lönnerberg P, La Manno G, Juréus A, et al. Cell types in the mouse cortex and hippocampus revealed by single-cell RNA-seq. Science. 2015;347(6226):1138–1142. doi: 10.1126/science.aaa1934. - DOI - PubMed
    1. Reinius B, Mold JE, Ramsköld D, Deng Q, Johnsson P, Michaëlsson J, et al. Analysis of allelic expression patterns in clonal somatic cells by single-cell RNA–seq. Nat Genet. 2016;48(11):1430. doi: 10.1038/ng.3678. - DOI - PMC - PubMed

Publication types

LinkOut - more resources