. 2019 Oct 11;10(1):4624.
doi: 10.1038/s41467-019-12632-5.

Influenza A virus M2 protein triggers mitochondrial DNA-mediated antiviral immune responses

Affiliations

Influenza A virus M2 protein triggers mitochondrial DNA-mediated antiviral immune responses

Miyu Moriyama et al. Nat Commun. .

Abstract

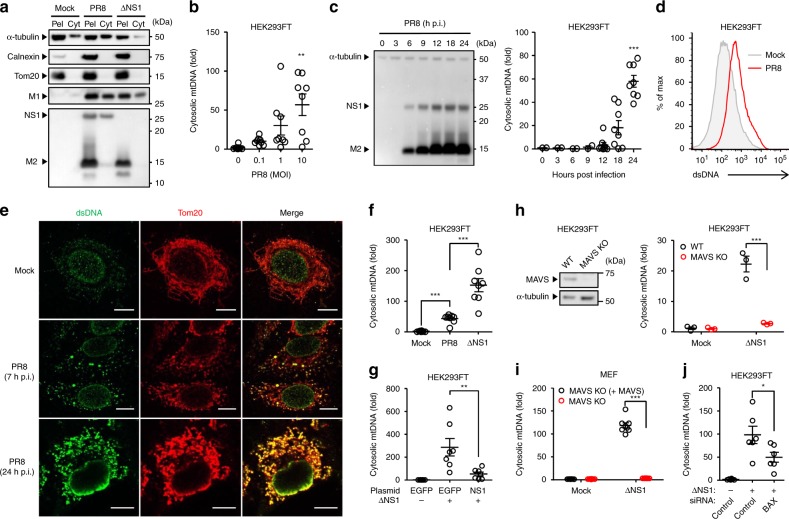
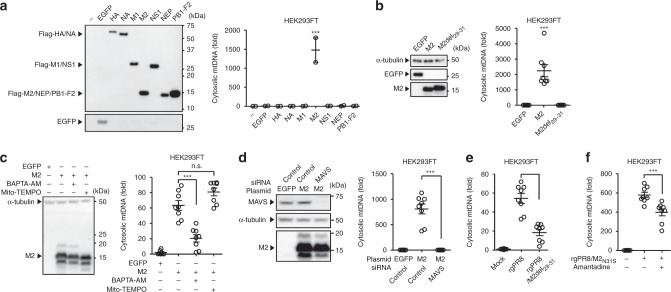
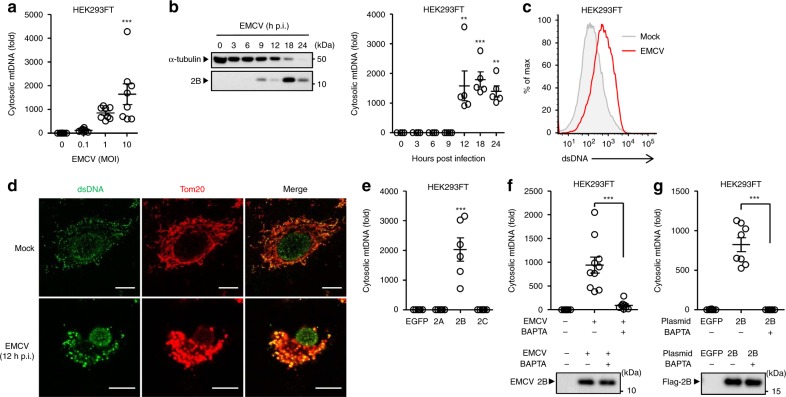
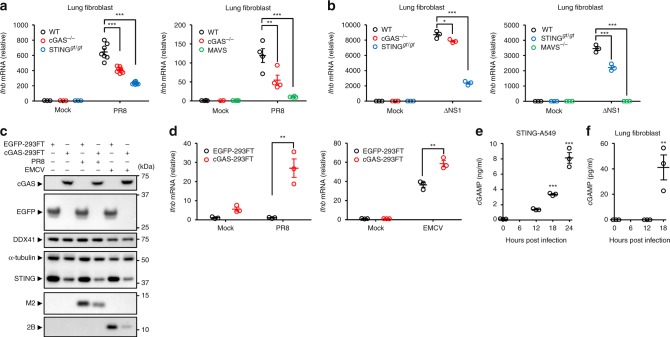
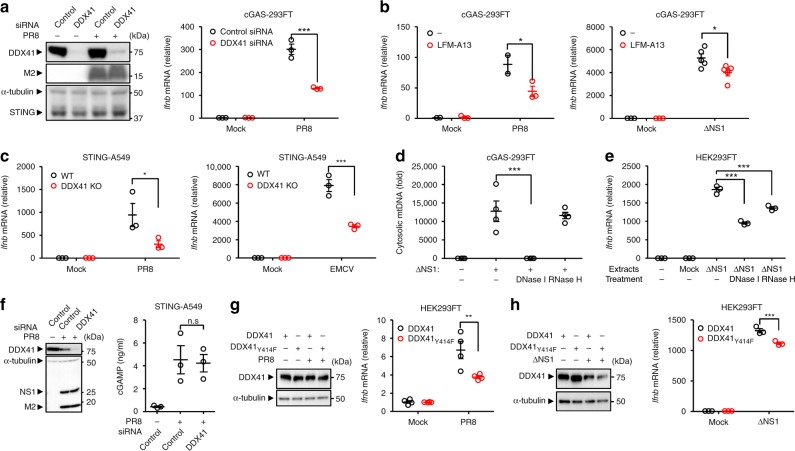
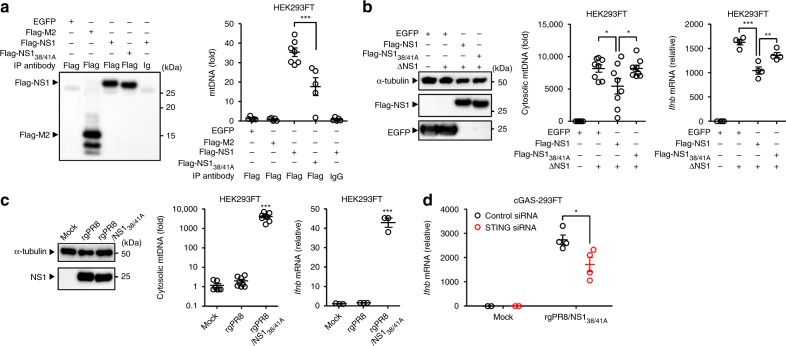
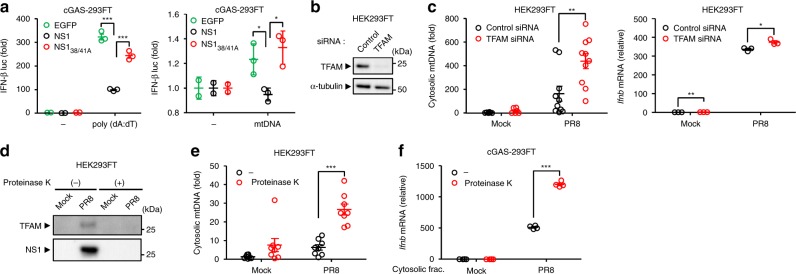
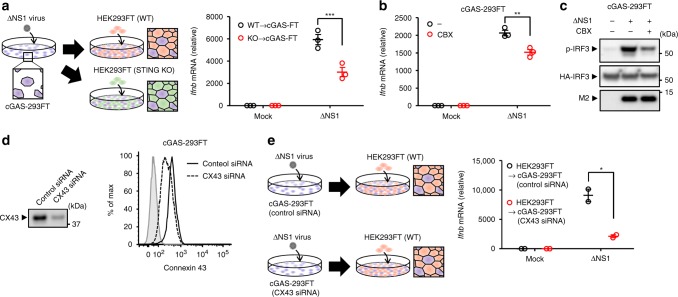
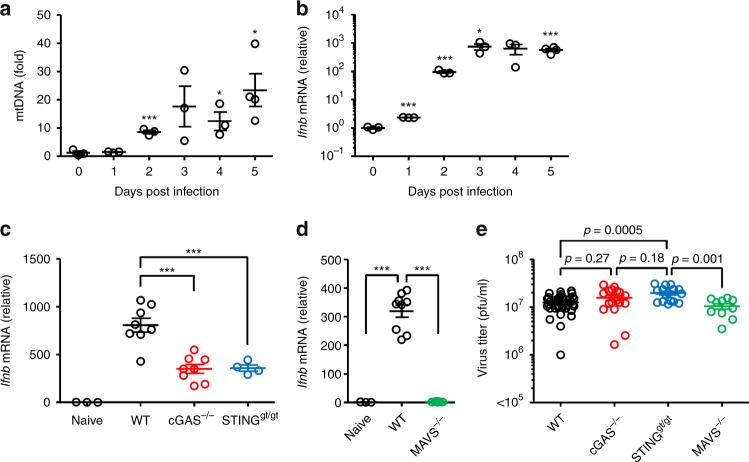
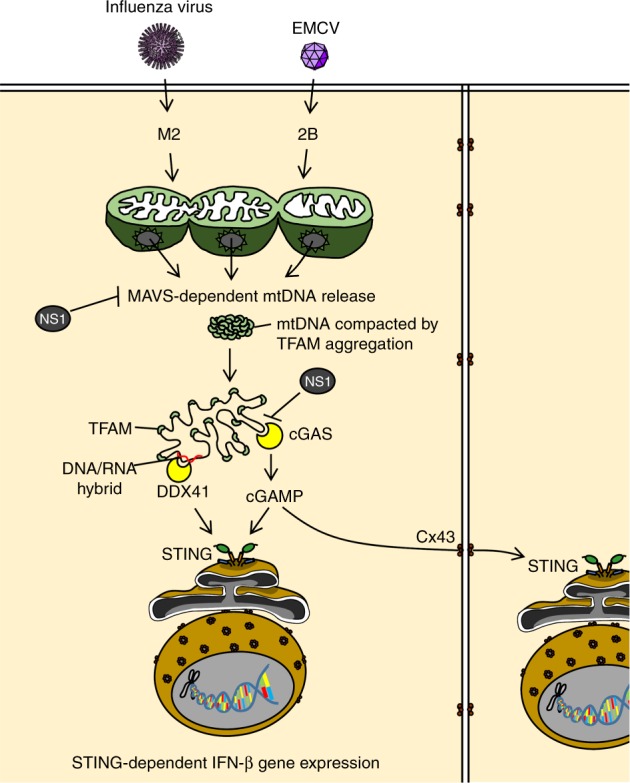
Cytosolic mitochondrial DNA (mtDNA) activates cGAS-mediated antiviral immune responses, but the mechanism by which RNA viruses stimulate mtDNA release remains unknown. Here we show that viroporin activity of influenza virus M2 or encephalomyocarditis virus (EMCV) 2B protein triggers translocation of mtDNA into the cytosol in a MAVS-dependent manner. Although influenza virus-induced cytosolic mtDNA stimulates cGAS- and DDX41-dependent innate immune responses, the nonstructural protein 1 (NS1) of influenza virus associates with mtDNA to evade the STING-dependent antiviral immunity. The STING-dependent antiviral signaling is amplified in neighboring cells through gap junctions. In addition, we find that STING-dependent recognition of influenza virus is essential for limiting virus replication in vivo. Our results show a mechanism by which influenza virus stimulates mtDNA release and highlight the importance of DNA sensing pathway in limiting influenza virus replication.


Conflict of interest statement

The authors declare no competing interests.

Figures

Fig. 1
Fig. 1
Influenza virus triggers mtDNA release. a HEK293FT cells were subjected to digitonin fractionation as described in the Methods and pellets (Pel) or cytosolic extracts (Cyt) were analyzed by western blotting using the indicated antibodies. b HEK293FT cells were infected with PR8 virus at indicated MOIs. Cytosolic mtDNA was assessed by quantitative PCR. c HEK293FT cells were infected with PR8 virus at MOI of 10. Cell lysates were collected at indicated time points and analyzed by immunoblotting with indicated antibodies (left panel). Cytosolic mtDNA was assessed by quantitative PCR (right panel). d HEK293FT were infected with PR8 virus. Cells were collected at 24 h post infection, and intracellularly stained with dsDNA-specific antibody (35I9 DNA). e STING-A549 cells were infected with PR8 virus. At indicated time points, cells were stained with anti-dsDNA (AC-30-10) and anti-Tom20 antibodies and analyzed by confocal microscopy. Scale bars, 10 μm. f HEK293FT cells were infected with WT or ΔNS1 influenza virus at MOI of 10. Cytosolic mtDNA was assessed by quantitative PCR. g HEK293FT cells were transfected with the expression plasmid encoding EGFP or Flag-tagged NS1 protein. Twenty-four hours after transfection, the cells were infected with ΔNS1 influenza virus for 24 h. Cytosolic mtDNA was assessed by quantitative PCR. h WT or MAVS KO HEK293FT cells were infected with ΔNS1 influenza virus for 24 h. Cell lysates were collected and analyzed by immunoblot using indicated antibodies (left panel). Cytosolic mtDNA was assessed by quantitative PCR (right panel). i MAVS KO MEFs, or MAVS KO MEFs re-introduced full-length MAVS (MAVS KO (+MAVS)) were infected with ΔNS1 influenza virus for 24 h. Cytosolic mtDNA was assessed by quantitative PCR. j HEK293FT cells transfected with siRNA targeting Bax or control siRNA were infected with ΔNS1 influenza virus for 24 h. Cytosolic mtDNA was assessed by quantitative PCR. These data are from three independent experiments (b, c, fj; mean ± s.e.m.). *P < 0.05, **P < 0.01, ***P < 0.001; (one-way ANOVA and Tukey’s test). Source data are provided as a Source Data file
Fig. 2
Fig. 2
Ion channel activity of influenza virus M2 protein is essential for mtDNA release. a HEK293FT cells were transfected with the expression plasmid encoding EGFP or Flag-tagged influenza virus proteins. Cell lysates were collected at 24 h post transfection and analyzed by immunoblot with mouse monoclonal antibody against Flag or EGFP (left panel). Cytosolic mtDNA was assessed by quantitative PCR at 24 h post transfection (right panel). b HEK293FT cells were transfected with the expression plasmid encoding EGFP or Flag-tagged WT or mutant M2 protein. Cell lysates were collected at 24 h post transfection and analyzed by immunoblot using indicated antibodies (left panel). Cytosolic mtDNA was assessed by quantitative PCR at 24 h post transfection (right panel). c HEK293FT cells were transfected with the expression plasmid encoding EGFP or Flag-tagged M2 protein in the presence or absence of BAPTA-AM (20 μM) or Mito-TEMPO (500 μM). Cell lysates were collected at 24 h post transfection and blotted using the indicated antibodies (left panel). Cytosolic mtDNA was assessed by quantitative PCR at 24 h post transfection (right panel). d HEK293FT cells were transfected with siRNA targeting MAVS or control siRNA. Two days later, cells were transfected with the expression plasmid encoding EGFP or Flag-tagged M2 protein. Cell lysates were collected at 24 h post DNA transfection and blotted using the indicated antibodies (left panel). Cytosolic mtDNA was assessed by quantitative PCR at 24 h post DNA transfection (right panel). e, f HEK293FT cells were infected with WT (rgPR8), M2del29–31 virus (rgPR8/M2del29–31) (e), or amantadine sensitive-recombinant influenza virus (rgPR8/M2N31S) in the presence or absence of amantadine (100 μM) (f). Cytosolic mtDNA was assessed by quantitative PCR at 24 h post infection. These data are from three independent experiments (af; mean ± s.e.m.). ***P < 0.001; n.s., not significant (one-way ANOVA and Tukey’s test). Source data are provided as a Source Data file
Fig. 3
Fig. 3
EMCV 2B protein stimulates cytosolic mtDNA release. a HEK293FT cells were infected with EMCV at indicated MOIs. Cytosolic mtDNA was assessed by quantitative PCR. b HEK293FT cells were infected with EMCV virus at MOI of 10. Cell lysates were collected at indicated time points and analyzed by immunoblotting with indicated antibodies (left panel). Cytosolic mtDNA was assessed by quantitative PCR (right panel). c HEK293FT were infected with EMCV. Cells were collected at 24 h post infection, and intracellularly stained with dsDNA-specific antibody (35I9 DNA). d STING-A549 cells were infected with EMCV. At 12 h post infection, cells were stained with anti-dsDNA (AC-30-10) and anti-Tom20 antibodies and analyzed by confocal microscopy. Scale bars, 10 μm. e HEK293FT cells were transfected with the expression plasmid encoding EGFP or Flag-EMCV 2A, 2B, or 2C protein. Cytosolic mtDNA was assessed by quantitative PCR at 24 h post transfection. f, g HEK293FT cells were infected with EMCV (f) or transfected with the expression plasmid encoding EGFP or Flag-tagged 2B protein (g) in the presence or absence of BAPTA (20 μM). Cell lysates were collected at 18 h post infection (f) or transfection (g) and analyzed by immunoblot with rabbit polyclonal antibody against EMCV 2B protein (f, lower panel) or mouse monoclonal antibody against Flag (g, lower panel). Cytosolic mtDNA was assessed by quantitative PCR at 18 h post infection (f, upper panel) or transfection (g, upper panel). These data are from three independent experiments (a, b, eg; mean ± s.e.m.). **P < 0.01, ***P < 0.001; (one-way ANOVA and Tukey’s test). Source data are provided as a Source Data file
Fig. 4
Fig. 4
Influenza virus stimulates cGAS- and STING-dependent IFN-β gene expression in mouse lung fibroblast. a, b Primary lung fibroblast prepared from WT, cGAS-, STING-, and MAVS-deficient mice were infected with WT PR8 (a) or ΔNS1 influenza virus (b). IFN-β mRNA levels were assessed by quantitative PCR with GAPDH as an internal control. c Samples from HEK293FT cells stably expressing EGFP (EGFP-293FT) or cGAS (cGAS-293FT) were infected with PR8 or EMCV. Cell lysates were collected at 9 h post infection and blotted using the indicated antibodies. d EGFP-293FT or cGAS-293FT cells were infected with influenza virus (left panel) or EMCV (right panel) for 24 h. IFN-β mRNA levels were assessed by quantitative PCR with β-actin as an internal control. e, f STING-A549 cells (e) or lung fibroblasts (f) were infected with PR8 virus. Pure cytosolic extracts were collected at indicated time points and analyzed for cGAMP by ELISA. These data are from three independent experiments (a, b, df; mean ± s.e.m.). *P < 0.05, **P < 0.01, ***P < 0.001; (one-way ANOVA and Tukey’s test). Source data are provided as a Source Data file
Fig. 5
Fig. 5
Influenza virus stimulates DDX41-dependent IFN-β gene expression. a cGAS-293FT cells transfected with siRNA targeting DDX41 or control siRNA were infected with influenza virus for 24 h. Cell lysates were collected and blotted using the indicated antibodies (left panel). IFN-β mRNA levels were assessed by quantitative PCR with β-actin as an internal control (right panel). b, c cGAS-293FT cells were infected with WT (left panel) or ΔNS1 influenza virus (right panel) for 24 h in the presence or absence of LFM-A13 (100 μM) (b). WT or DDX41-deficient STING-A549 cells were infected with PR8 (left panel), or EMCV (right panel) for 24 h (c). IFN-β mRNA levels were assessed by quantitative PCR with β-actin as an internal control. d Pure cytosolic fraction prepared from digitonin extracts of mock- or ΔNS1 influenza virus-infected cGAS-293FT cells were treated with DNase I or RNase H. Cytosolic mtDNA was assessed by quantitative PCR. e HEK293FT cells were transfected with DNA extracted from DNase I- or RNase H-treated pure cytosolic fraction for 24 h. IFN-β mRNA levels were assessed by quantitative PCR with β-actin as an internal control. f STING-A549 cells transfected with siRNA targeting DDX41 or control siRNA were infected with PR8 virus for 24 h. Cell lysates were collected at 24 h post infection and blotted using the indicated antibodies (left panel). Pure cytosolic extracts were collected at 24 h post infection and analyzed for cGAMP by ELISA (right panel). g, h HEK293FT cells were transfected with siRNA targeting DDX41. Two days later, cells were transfected with the expression plasmid encoding Flag-tagged DDX41 or DDX41 (Y414F) mutant. Twenty-four hours after DNA transfection, the cells were infected with WT (g) ΔNS1 influenza virus (h) for 24 h. Cell lysates were collected at 24 h post infection and blotted using the indicated antibodies (left panel). IFN-β mRNA levels were assessed by quantitative PCR with β-actin as an internal control (right panel). These data are from three independent experiments (mean ± s.e.m.). **P < 0.01, ***P < 0.001; n.s., not significant (one-way ANOVA and Tukey’s test). Source data are provided as a Source Data file
Fig. 6
Fig. 6
Influenza virus NS1 protein associates with mtDNA. a HEK293FT cells were transfected with the expression plasmid encoding EGFP, Flag-tagged M2, NS1, or NS138/41 mutant. Twenty-four hours after transfection, the cells were infected with ΔNS1 influenza virus for 24 h. Pure cytosolic extracts prepared from digitonin extracts of ΔNS1 influenza virus-infected cells were immunoprecipitated with mouse monoclonal antibody against Flag, followed by immunoblotting of immunoprecipitates with rabbit polyclonal antibody against Flag (left panel). DNA was extracted from immunoprecipitated samples using QIAquick Nucleotide Removal kit (QIAGEN). NS1-bound mtDNA was assessed by quantitative PCR (right panel). b HEK293FT cells were transfected with the expression plasmid encoding EGFP, Flag-tagged NS1, or NS1 38/41 mutant. Twenty-four hours after transfection, the cells were infected with ΔNS1 influenza virus for 24 h. Cell lysates were collected and blotted using the indicated antibodies (left panel). Cytosolic mtDNA was assessed by quantitative PCR (middle panel). IFN-β mRNA levels were assessed by quantitative PCR with β-actin as an internal control (right panel). c HEK293FT cells were infected with WT (rgPR8) or rgPR8/NS138/41A influenza virus at MOI of 1 for 24 h. Cell lysates were collected and blotted using the indicated antibodies (left panel). Cytosolic mtDNA (middle panel) and IFN-β mRNA levels (right panel) were assessed by quantitative PCR. d cGAS-293FT cells transfected with siRNA targeting STING or control siRNA were infected with rgPR8/NS138/41A influenza virus for 24 h. IFN-β mRNA levels were assessed by quantitative PCR with β-actin as an internal control. These data are from three independent experiments (mean ± s.e.m.). *P < 0.05, **P < 0.01, ***P < 0.001; (one-way ANOVA and Tukey’s test). Source data are provided as a Source Data file
Fig. 7
Fig. 7
NS1 binding to mtDNA attenuates its immunostimulatory potential. a cGAS-293FT cells co-transfected with expression plasmids encoding EGFP, Flag-tagged NS1, or NS138/41 mutant, together with IFN-β reporter plasmids and poly(dA:dT) (left panel) or mtDNA (right panel). Twenty-four hours after transfection, cell lysates were collected and analyzed for luciferase activity. b Samples from HEK293FT cells transfected with siRNA targeting TFAM or control siRNA were blotted using the indicated antibodies. c HEK293FT cells transfected with siRNA targeting TFAM or control siRNA were infected with PR8 virus for 24 h. Cytosolic mtDNA (left panel) and IFN-β mRNA levels (right panel) were assessed by quantitative PCR. d Pure cytosolic fraction prepared from digitonin extracts of mock- or PR8-infected HEK293FT cells were treated with proteinase K. Proteinase K-treated pure cytosolic extracts were analyzed by immunoblotting with indicated antibodies. e DNA was extracted from proteinase K-treated pure cytosolic fraction using QIAquick Nucleotide Removal kit (QIAGEN). Cytosolic mtDNA was assessed by quantitative PCR. f cGAS-293FT cells were transfected with DNA extracted from proteinase K-treated pure cytosolic fraction for 6 h. IFN-β mRNA levels were assessed by quantitative PCR with β-actin as an internal control. These data are from three independent experiments (a, c, e, f; mean ± s.e.m.). *P < 0.05, **P < 0.01, ***P < 0.001; (one-way ANOVA and Tukey’s test). Source data are provided as a Source Data file
Fig. 8
Fig. 8
Connexin 43 amplifies influenza virus-induced STING-dependent innate immune signaling. a Schematic representation of experimental setup (left panel). cGAS-293FT cells were infected with ΔNS1 influenza virus (purple). Six hours later, uninfected WT (red) or STING KO (green) HEK293FT cells were added to the ΔNS1 influenza virus-infected cGAS-293FT cells (purple) and co-cultured for additional 18 h. IFN-β mRNA levels were assessed by quantitative PCR at 24 h post infection (right panel). b cGAS-293FT cells infected with ΔNS1 influenza virus in the presence or absence of CBX (160 μM). IFN-β mRNA levels were assessed by quantitative PCR at 24 h post infection. c cGAS-293FT cells were transfected with the expression plasmid encoding HA-tagged IRF3. Twenty-four hours after transfection, the cells were infected with ΔNS1 influenza virus in the presence or absence of CBX (160 μM). Cell lysates were collected at 12 h post infection and blotted using the indicated antibodies. d Samples from cGAS-293FT cells transfected with siRNA targeting connexin 43 (CX43) or control siRNA were blotted using the indicated antibodies (left panel) or intracellularly stained with CX43-specific antibody and analyzed by flow cytometry (right panel). e Schematic representation of experimental setup (left panel). cGAS-293FT cells transfected with siRNA targeting connexin 43 (CX43) or control siRNA were infected with ΔNS1 influenza virus (purple). Six hours later, uninfected HEK293FT cells (red) were added to the ΔNS1 influenza virus-infected cGAS-293FT cells (purple) and co-cultured for additional 18 h. IFN-β mRNA levels were assessed by quantitative PCR at 24 h post infection (right panel). These data are from three independent experiments (a, b, e; mean ± s.e.m.). *P < 0.05, **P < 0.01, ***P < 0.001; (one-way ANOVA and Tukey’s test). Source data are provided as a Source Data file
Fig. 9
Fig. 9
Effect of cGAS or STING deficiency on influenza virus replication in vivo. a, b WT mice were intranasally infected with 1,000 pfu of PR8 virus. The BAL fluids (a) and lung tissues (b) were collected at indicated time points. DNA was extracted from BAL fluids of mock- or influenza virus-infected mice using QIAquick Nucleotide Removal kit (QIAGEN). Cytosolic mtDNA was assessed by quantitative PCR (a). Total RNAs were extracted from the lung tissue of mock- or influenza virus-infected mice. IFN-β mRNA levels were assessed by quantitative PCR with GAPDH as an internal control (b). c, d WT, cGAS−/−, Stinggt/gt, and MAVS−/− mice were intranasally infected with 1000 pfu of PR8 virus. Lung tissues were collected at 4 d post infection. Total RNAs were extracted from the lung tissue and IFN-β mRNA levels were assessed by quantitative PCR with GAPDH as an internal control. e WT (n = 37), cGAS−/− (n = 18), Stinggt/gt (n = 16), and MAVS−/− (n = 10) mice were intranasally infected with 1000 pfu of PR8 virus. The BAL fluids were collected at 5 d post infection and viral titers were determined by standard plaque assay. These data are from three independent experiments (ad; mean ± s.e.m.) or pooled from four independent experiments (e; mean ± s.e.m.). *P < 0.05, ***P < 0.001; (one-way ANOVA and Tukey’s test). Source data are provided as a Source Data file
Fig. 10
Fig. 10
Proposed mechanism by which influenza virus regulates STING-dependent antiviral immunity. Ion channel activity of influenza virus M2 or EMCV 2B protein stimulates cytosolic mtDNA release in a MAVS-dependent manner. These cytosolic mtDNA could be packaged into distinct levels of higher-order structures depending on the ratio of TFAM to mtDNA. Cytosolic DNA sensors cGAS and DDX41 may recognize influenza virus-induced cytosolic mtDNA to stimulate STING-dependent IFN-β gene expression. The STING-dependent antiviral signaling was amplified in neighboring cells though gap junctions. The NS1 protein of influenza virus could associate with mtDNA to evade host DNA sensing pathways

References

    1. Iwasaki A. A virological view of innate immune recognition. Annu Rev. Microbiol. 2012;66:177–196. doi: 10.1146/annurev-micro-092611-150203. - DOI - PMC - PubMed
    1. Kawai T, Akira S. The role of pattern-recognition receptors in innate immunity: update on Toll-like receptors. Nat. Immunol. 2010;11:373–384. doi: 10.1038/ni.1863. - DOI - PubMed
    1. Sun L, Wu J, Du F, Chen X, Chen ZJ. Cyclic GMP-AMP synthase is a cytosolic DNA sensor that activates the type I interferon pathway. Science. 2013;339:786–791. doi: 10.1126/science.1232458. - DOI - PMC - PubMed
    1. Wu J, et al. Cyclic GMP-AMP is an endogenous second messenger in innate immune signaling by cytosolic DNA. Science. 2013;339:826–830. doi: 10.1126/science.1229963. - DOI - PMC - PubMed
    1. Li XD, et al. Pivotal roles of cGAS-cGAMP signaling in antiviral defense and immune adjuvant effects. Science. 2013;341:1390–1394. doi: 10.1126/science.1244040. - DOI - PMC - PubMed

Publication types