. 2019 Nov 19;51(5):840-855.e5.
doi: 10.1016/j.immuni.2019.09.013. Epub 2019 Oct 9.

TCF-1-Centered Transcriptional Network Drives an Effector versus Exhausted CD8 T Cell-Fate Decision

Affiliations

TCF-1-Centered Transcriptional Network Drives an Effector versus Exhausted CD8 T Cell-Fate Decision

Zeyu Chen et al. Immunity. .

Abstract

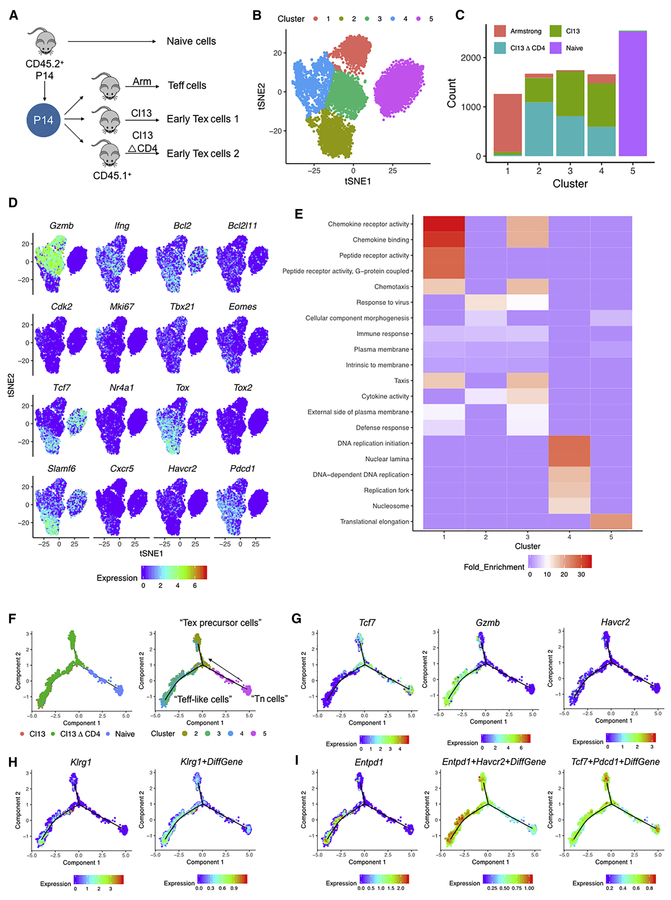
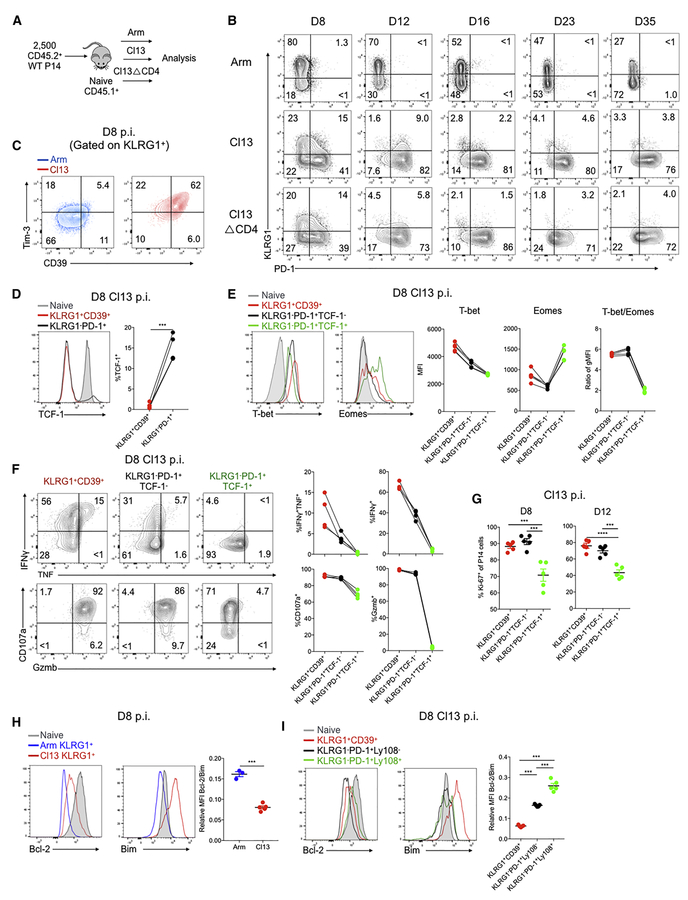
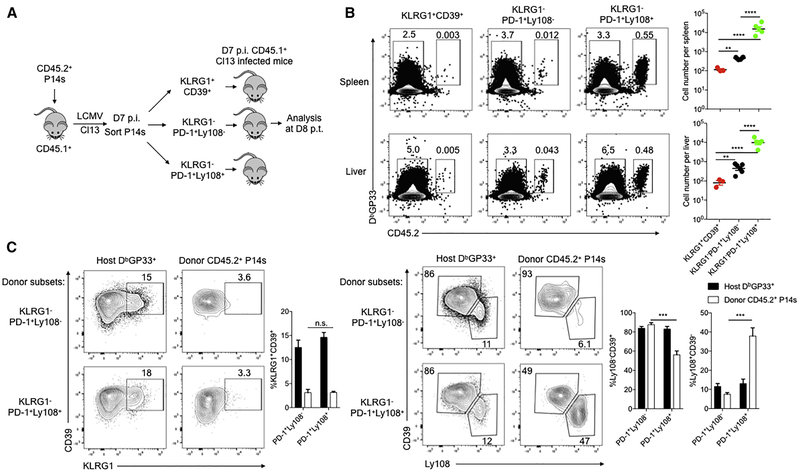
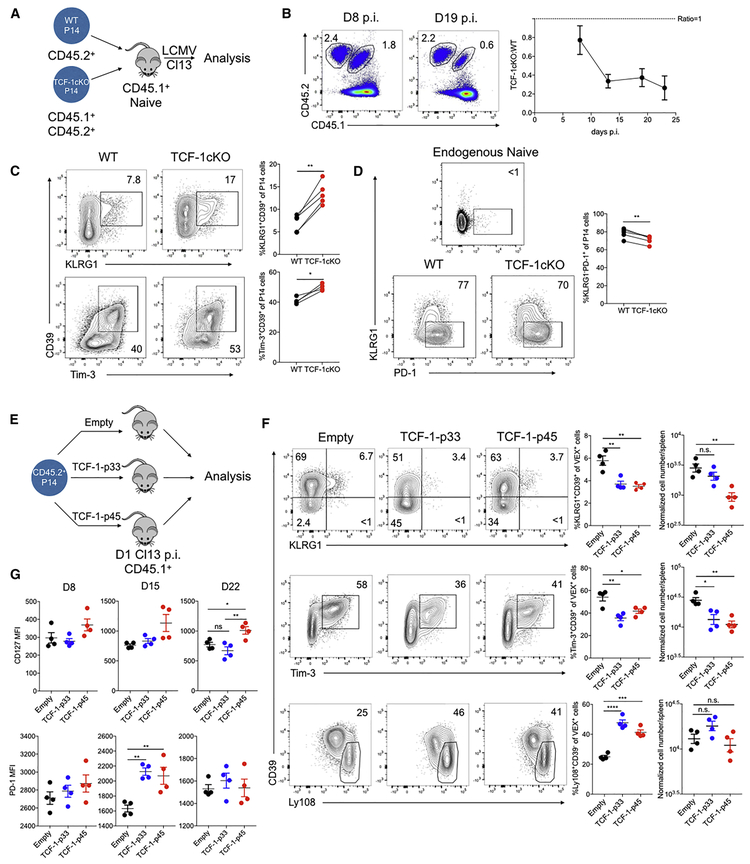
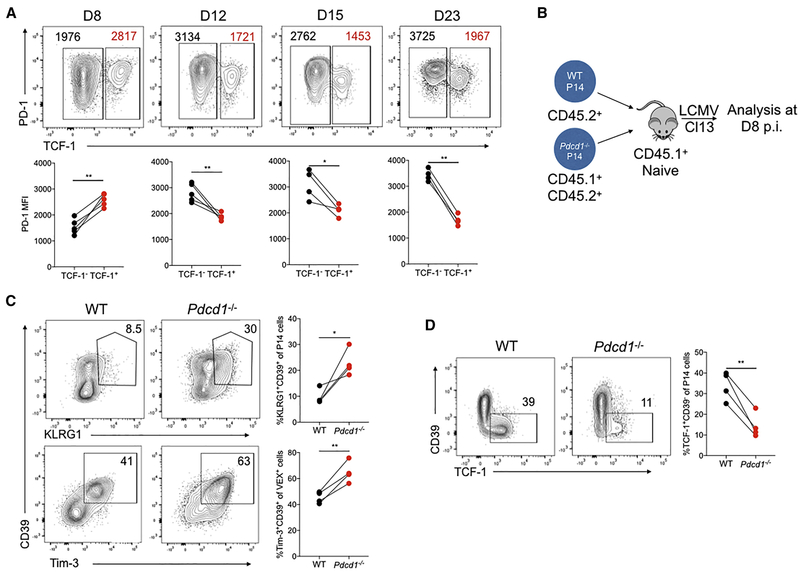
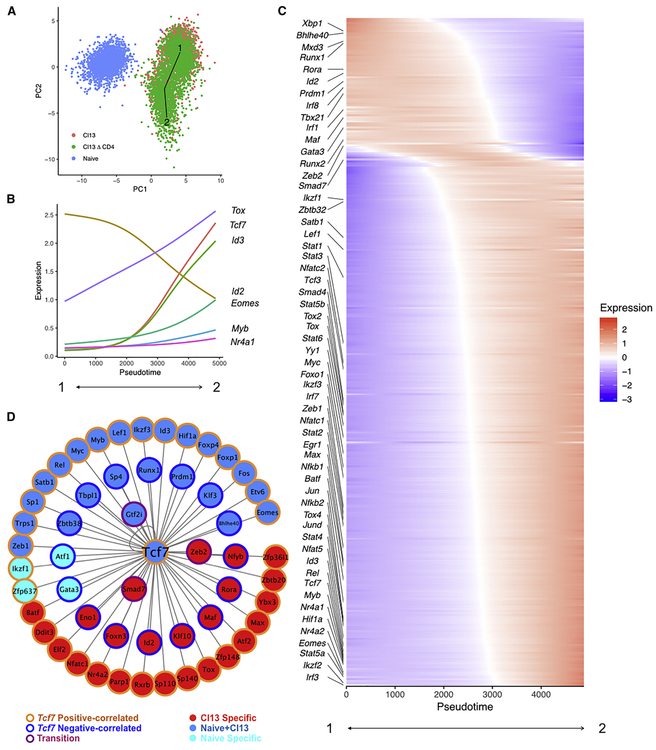
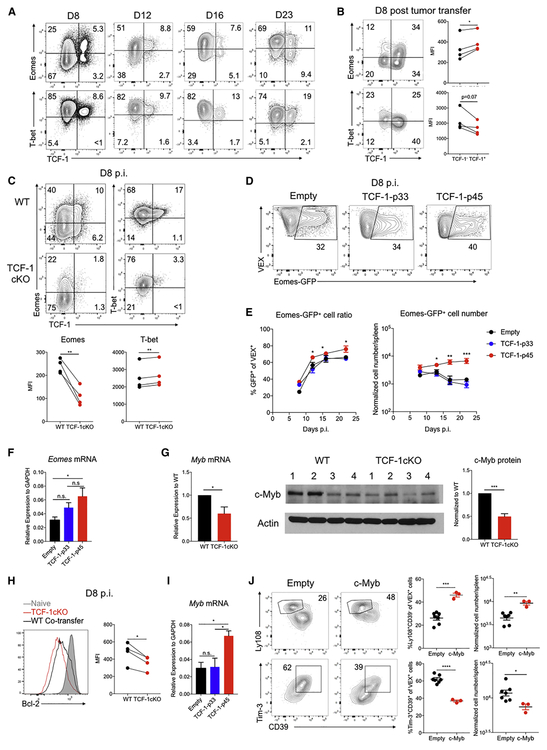
TCF-1 is a key transcription factor in progenitor exhausted CD8 T cells (Tex). Moreover, this Tex cell subset mediates responses to PD-1 checkpoint pathway blockade. However, the role of the transcription factor TCF-1 in early fate decisions and initial generation of Tex cells is unclear. Single-cell RNA sequencing (scRNA-seq) and lineage tracing identified a TCF-1+Ly108+PD-1+ CD8 T cell population that seeds development of mature Tex cells early during chronic infection. TCF-1 mediated the bifurcation between divergent fates, repressing development of terminal KLRG1Hi effectors while fostering KLRG1Lo Tex precursor cells, and PD-1 stabilized this TCF-1+ Tex precursor cell pool. TCF-1 mediated a T-bet-to-Eomes transcription factor transition in Tex precursors by promoting Eomes expression and drove c-Myb expression that controlled Bcl-2 and survival. These data define a role for TCF-1 in early-fate-bifurcation-driving Tex precursor cells and also identify PD-1 as a protector of this early TCF-1 subset.

Keywords: CD8 T cell exhaustion; PD-1; cancer; chronic infection; exhaustion; immunotherapy; transcriptional circuit.


Conflict of interest statement

Declaration of Interests

E.J.W. has consulting agreements with and/or is on the scientific advisory board for Merck, Roche, Pieris, Elstar, and Surface Oncology. E.J.W. is a founder of Surface Oncology and Arsenal Biosciences. E.J.W. has a patent licensing agreement on the PD-1 pathway with Roche/Genentech.

Figures

Figure 1.
Figure 1.. scRNA-seq identifies distinct subpopulations of virus specific CD8 T cells during the early stages of chronic infection.
(A) Experimental design. CD45.2+ P14 cells were adoptively transferred into naïve CD45.1+ recipient mice (5 mice/group) followed by infection with LCMV-Arm, Cl13, or Cl13△CD4. On D8 p.i., P14 cells were sorted and indexed for scRNA-seq. (B) tSNE clusters of cells from the scRNA-seq. (C) Cell count of treatment groups across 5 clusters from 1B. (D) Expression of representative genes in tSNE space. (E) Gene ontology (GO) enrichment analysis across clusters 1-5. Bonferroni correction test performed and enrichment cutoff p<0.05. (F) Pseudotime analysis using Monocle 2 across naïve, Cl13, and Cl13△CD4 P14 populations from D8 p.i. using a 513 exhaustion specific gene list (ESGs) from (Bengsch, et al. 2018). Predicted “Teff-like cells” and “Tex precursor cells” branches of the pseudotime trajectory. Distribution of clusters 2,3,4,5 from Figure 1B is shown. (G) Expression of Tcf7, Gzmb, Havcr2 projected onto the pseudotime trajectory. (H) Expression of Klrg1 and a Klrg1+ DiffGene signature (from Herndler-Brandstetter et al., 2018) projected onto the pseudotime trajectory or the scRNA-seq tSNE space from Figure 1 and onto the pseudotime trajectory. (I) Expression of Entpd1 and Entpd1+Havcr2+ DiffGene and Tcf7+Pdcd1+ DiffGene signatures (from Sade-Feldman et al., 2018) projected onto the pseudotime trajectory. Also see Figure S1.
Figure 2.
Figure 2.. Distinct cellular and molecular profiles of Teff-like and Tex precursor cells during chronic infection.
(A) Experimental design. 2.5 × 10³ CD45.2+ P14 cells were adoptively transferred into naïve CD45.1+ mice followed by infection with LCMV Arm, Cl13 or Cl13△CD4. Spleens analyzed at the indicated time points. (B) KLRG1 and PD-1 expression at the indicated time points of Arm, Cl13 and Cl13△CD4 infections. Gated on donor P14 cells. (C) Flow cytometry plots for CD39 and Tim-3 by KLRG1+ P14 cells from Arm versus Cl13 at D8 p.i. (D) TCF-1 expression on D8 p.i. with Cl13 in P14 cells gated on KLRG1+CD39+ or KLRG1PD-1+ subsets. Naïve CD8 T cells (endogenous CD62L+CD44) displayed as a control. (E) T-bet and Eomes expression assessed at D8 p.i. with Cl13 in P14 cells gated on KLRG1+CD39+, KLRG1PD-1+TCF-1 or KLRG1PD-1+ TCF-1+ subsets. Naïve CD8 T cells displayed as a control. The T-bet/Eomes ratio was calculated based on geometric MFI. (F) IFNγ, TNF, CD107a and Granzyme B (Gzmb) expression assessed at D8 p.i. with Cl13 by P14 cells gated on the indicated subsets. (G) The percentage of Ki-67+ cells in the in the indicated subsets of P14 cells was assessed at D8 and D12 p.i. with Cl13. (H) Bcl-2 and Bim expression were assessed at D8 p.i. with Arm in the KLRG1+ P14 subset. Naïve CD8 T cells are displayed as a control. The ratio of Bcl-2/Bim was calculated based on geometric MFI. (I) Bcl-2 and Bim expression were assessed at D8 p.i. with Cl13 p.i. in the indicated subsets of P14 cells. Naïve CD8 T cells are displayed as a control. The ratio of Bcl-2/Bim was calculated based on geometric MFI. *P<0.05, **P<0.01, ***P<0.001, ****P<0.0001 versus control (two-tailed Student’s t-test or One-Way ANOVA). Data are representative of 2-6 independent experiments with at least 3 mice/group (mean±s.e.m.). Also see Figure S2-S3.
Figure 3.
Figure 3.. Lineage tracing of subpopulations of Teff-like and Tex precursor cells in early chronic viral infection.
(A) Experimental design. 5 × 10³ CD45.2+ P14 cells were adoptively transferred into naïve CD45.1+ C57BL/6 recipient mice followed One day later by Cl13 infection. On D7 p.i. KLRG1+CD39+, KLRG1PD-1+Ly108 or KLRG1PD-1+Ly108+ P14 CD8 T cells were isolated and 3 × 10⁵ of each was adoptively transferred into infection-matched CD45.1+ recipient mice. Donor P14 cells were analyzed on D8 post transfer (p.t.). (B) Flow cytometry plots and quantification of donor CD45.2+ DbGP33 tetramer+ P14 cells derived from the indicated subsets. Endogenous CD45.2 DbGP33 tetramer+ CD8 T cells shown as controls. (C) Flow cytometry plots and quantification of splenic CD45.2+ donor P14 cells and host DbGP33 tetramer+ cells that are KLRG1+, Ly108CD39+, or Ly108+CD39. Note, there were too few KLRG1+CD39+ P14 cells for analysis on D8 p.i. (see part B). *P<0.05, **P<0.01, ***P<0.001, ****P<0.0001 versus control (two-tailed Student’s t-test or One-Way ANOVA). Data representative of at least 3 mice/group (mean±s.e.m.). Also see Figure S4.
Figure 4.
Figure 4.. TCF-1 regulates the early fate bifurcation between Teff-like and Tex precursor cells.
(A) Experimental design. 1 × 10³ CD45.2+ Tcf7flox/flox×Cd4WT (WT) littermate control P14 and 1 × 10³ CD45.1+CD45.2+ Tcf7flox/flox×Cd4CRE(TCF-1cKO) P14 CD8 T cells were co-transferred into CD45.1+ naïve recipient mice followed by Cl13 infection. Splenocytes were isolated on the indicated days p.i. for analysis. (B) Flow cytometry plots quantifying WT and TCF-1cKO P14 cells. The ratio of cells is plotted over time p.i. (C) Flow cytometry plots and quantification of KLRG1+CD39+ and Tim-3+CD39+ subsets of responding P14 cells of each genotype on D8 p.i. with Cl13. (D) Flow cytometry plots and quantification of the KLRG1PD-1+ subset of responding P14 cells of each genotype on D8 p.i. with Cl13. Endogenous naïve CD8 T cells are used for controls. (E) Experimental design. WT P14 CD8 T cells transduced with the indicated RVs were adoptively transferred to mice infected one day previously with Cl13. Donor RV reporter P14 cells were analyzed at the indicated time points. (F) Flow cytometry plots and quantification of the indicated P14 cell subsets for the indicated RV groups on D8 p.i. with Cl13 p.i. Plots are gated on RV reporter+ (VEX+) P14 cells. VEX+ cell numbers were normalized to 1 × 10⁴ VEX+P14 cell engraftment according to the transduction efficiency on D2 p.i. (G) Quantification of CD127 and PD-1 expression by P14 cells transduced with the indicated RVs at the indicated time points of Cl13 infection. *P<0.05, **P<0.01, ***P<0.001, ****P<0.0001 versus control (two-tailed Student’s t-test). Data are representative of 3-4 independent experiments (mean±s.e.m.) with at least 4 mice/group. Also see Figure S5.
Figure 5.
Figure 5.. PD-1 maintains the TCF-1+ Tex precursor cell population at the early stage of chronic infection.
(A) Flow cytometry plots of TCF-1 and PD-1 expression by responding P14 cells at the indicated days of Cl13 infection. PD-1 MFI of TCF-1 (black) and TCF-1+(red) subsets of P14 cells is shown in the flow cytometry plots and summary data below. (B) Experimental design. 5 × 10² CD45.2+ WT P14 and 5 × 10² CD45.1+CD45.2+ Pdcd1−/− P14 cells were co-adoptively transferred into CD45.1+ naïve recipient mice followed by Cl13 infection. Responding P14 cells from the spleen analyzed on D8 p.i. with Cl13. (C) Flow cytometry plots and quantification of KLRG1+CD39+ or Tim-3+CD39+ subsets of responding WT or Pdcd1−/− P14 cells on D8 p.i. (D) Flow cytometry plots and quantification of TCF-1+CD39 subsets of responding WT or Pdcd1−/− P14 cells on D8 p.i. *P<0.05, **P<0.01 versus control (two-tailed Student’s t-test). Data are representative of 2-4 independent experiments (mean±s.e.m.) with at least 3 mice/group. Also see Figure S6.
Figure 6.
Figure 6.. State Transition Inference Prediction (STIP) identifies transcriptional circuits downstream of TCF-1.
(A) Pseudotime trajectory across naïve P14 cells and P14 cells from D8 of Cl13 and Cl13△CD4 infections. PCA space created using the ESGs from Figure 1. The line represents the longest lineage trajectory predicted by TSCAN (Z. Ji and H. Ji, 2016). (B) Expression of Tcf7 and other indicated TFs is plotted over pseudotime. (C) A heatmap is shown displaying TF expression across the pseudotime trajectory. (D) A Tcf7 centered network was generated (see Methods). Border color for each gene represents the mRNA-expression relationship with Tcf7 (e.g. positively (orange) or negatively (blue) correlated with Tcf7 or neither (purple)). Fill color indicates the presence of Tcf7 binding motif(s) in the open chromatin of the indicated TFs in naïve only (cyan), naïve and Cl13 (dark blue) or Cl13 only (red).
Figure 7.
Figure 7.. TCF-1 regulates distinct molecular modules during Tex cell development.
(A) Flow cytometry plots of TCF-1 and Eomes or TCF-1 and T-bet co-expression in P14 CD8 T cells on the indicated days of Cl13 infection. Quadrant gates were set using CD44 naïve T cells (T-betEomesTCF-1+) for each time point. (B) Flow cytometry plots of TCF-1 and Eomes or TCF-1 and T-bet co-expression in tumor infiltrating CD44+CD8 T cells (TILs) at D8 post CT26 tumor inoculation. Quadrant gates were set based on CD62L+CD44 naïve T cells (T-betEomesTCF-1+) from spleen. Quantification of T-bet and Eomes MFI of TCF-1+ or TCF-1 TILs show on the right. (C) Flow cytometry plots and quantification of Eomes and T-bet expression in WT or TCF-1cKO P14 cells at D8 p.i. with Cl13. (D) Flow cytometry plots of GFP expression from EomesGFP reporter P14 cells transduced with in empty, TCF-1-p33 or TCF-1-p45 RVs on D8 p.i. with Cl13. Plots gated on VEX+ P14 cells (see Figure S7A for gating). (E) Quantification of Eomes-GFP+ cells in the RV transduced (VEX+) P14 donor population for the indicated RV constructs on the indicated days p.i. Both percent and numbers are shown. Cell numbers are normalized to 1 × 10⁴ VEX+ P14 cell engraftment according to VEX+ transduction efficiency on D2 p.i. (Figure S7A). (F) Eomes mRNA expression is shown for P14 cells transduced with empty, TCF-1-p33 or TCF-1-p45 RVs. VEX+ (i.e. transduced) P14 cells were sorted by flow cytometry on D8 Cl13 p.i. and Eomes mRNA measured by qRT-PCR. (G) Myb mRNA and c-Myb protein expression were examined by qRT-PCR and Western blot in purified WT and TCF-1 cKO P14 cells isolated from spleens of co-transferred mice on D8 p.i. with Cl13. (H) Flow cytometry plots and quantification of Bcl-2 expression in WT versus TCF-1 cKO P14 cells on D8 p.i. with Cl13. Gated on donor P14 cells of each genotype. Naïve control is gated on endogenous CD44CD8 T cells. (I) Myb mRNA expression in sorted WT P14 cells transduced with empty, TCF-1-p33 or TCF-1-p45 RVs D8 p.i. with Cl13. Transduced cells were sorted based on VEX expression. (J) Flow cytometry plots and quantification of Ly108+CD39 and Tim-3+CD39+ subsets of responding P14 cells transduced with empty versus c-Myb RVs. Plots are gated on transduced (VEX+) donor P14 cells on D8 p.i. with Cl13. VEX+ cell numbers were normalized to 1 × 10⁴ VEX+P14 cell engraftment according to the transduction efficiency on D2 p.i. *P<0.05, **P<0.01, ***P<0.001, ****P<0.001 versus control (two-tailed Student’s t-test and One-Way Anova analysis). Data are representative of 2 independent experiments (mean±s.e.m.) with at least 3 mice/group. Also see Figure S7.

Comment in

References

    1. Adams WC, Chen Y-H, Kratchmarov R, Yen B, Nish SA, Lin W-HW, Rothman NJ, Luchsinger LL, Klein U, Busslinger M, Rathmell JC, Snoeck H-W, Reiner SL, 2016. Anabolism-Associated Mitochondrial Stasis Driving Lymphocyte Differentiation over Self-Renewal. Cell Reports 17, 3142–3152. doi:10.1016/j.celrep.2016.11.065 - DOI - PMC - PubMed
    1. Alfei F, Kanev K, Hofmann M, Wu M, Ghoneim HE, Roelli P, Utzschneider DT, Hösslin, von M, Cullen JG, Fan Y, Eisenberg V, Wohlleber D, Steiger K, Merkler D, Delorenzi M, Knolle PA, Cohen CJ, Thimme R, Youngblood B, Zehn D, 2019. TOX reinforces the phenotype and longevity of exhausted T cells in chronic viral infection. Nature 2017 545:7652 1. doi:10.1038/s41586-019-1326-9 - DOI - PubMed
    1. Anastas JN, Moon RT, 2013. WNT signalling pathways as therapeutic targets in cancer. Nature Reviews Cancer 2012 13:1 13, 11–26. doi:10.1038/nrc3419 - DOI - PubMed
    1. Angelosanto JM, Blackburn SD, Crawford A, Wherry EJ, 2012. Progressive loss of memory T cell potential and commitment to exhaustion during chronic viral infection. J. Virol. 86, 8161–8170. doi:10.1128/JVI.00889-12 - DOI - PMC - PubMed
    1. Barber DL, Wherry EJ, Masopust D, Zhu B, Allison JP, Sharpe AH, Freeman GJ, Ahmed R, 2006. Restoring function in exhausted CD8 T cells during chronic viral infection. Nature 2017 545:7652 439, 682–687. doi: 10.1038/nature04444 - DOI - PubMed

Publication types

MeSH terms

Substances