. 2019 Oct 23;9(4):375-382.e4.
doi: 10.1016/j.cels.2019.08.009. Epub 2019 Oct 9.

Neoantigen Dissimilarity to the Self-Proteome Predicts Immunogenicity and Response to Immune Checkpoint Blockade

Affiliations

Neoantigen Dissimilarity to the Self-Proteome Predicts Immunogenicity and Response to Immune Checkpoint Blockade

Lee P Richman et al. Cell Syst. .

Abstract

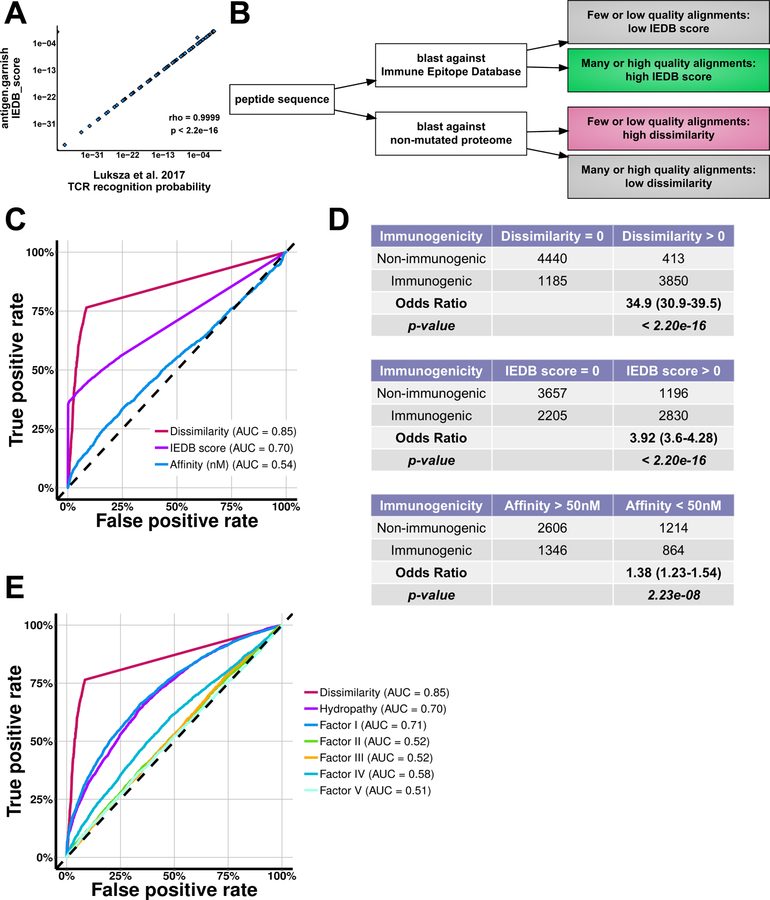
Despite improved methods for MHC affinity prediction, the vast majority of computationally predicted tumor neoantigens are not immunogenic experimentally, indicating that high-quality neoantigens are beyond current algorithms to discern. To enrich for neoantigens with the greatest likelihood of immunogenicity, we developed an analytic method to parse neoantigen quality through rational biological criteria across five clinical datasets for 318 cancer patients. We explored four quality metrics, including analysis of dissimilarity to the non-mutated proteome that was predictive of peptide immunogenicity. In patient tumors, neoantigens with high dissimilarity were unique, enriched for hydrophobic sequences, and correlated with survival after PD-1 checkpoint therapy in patients with non-small cell lung cancer independent of predicted MHC affinity. We incorporated our neoantigen quality analysis methodology into an open-source tool, antigen.garnish, to predict immunogenic peptides from bulk computationally predicted neoantigens for which the immunogenic "hit rate" is currently low.

Keywords: immune checkpoint blockade; immunogenicity prediction; neoantigen; tumor immunology.


Conflict of interest statement

Declaration of Interests

L.P.R. and A.J.R. declare no competing interests.

Figures

Figure 1:
Figure 1:. antigen.garnish Workflow and Validation of Ensemble Neoantigen Prediction Method.
(A) Overview of antigen.garnish workflow. Blue: input data; orange: functions performed by antigen.garnish; red: output data. Dashed lines indicate optional steps. (B) Bootstrapped Spearman’s rank correlation coefficients for predictions compared to measured affinities in the Kim et al. (2014) dataset for each peptide length. “a.g_ensemble” indicates the antigen.garnish ensemble method. (C) Ratio of predicted to measured affinity for 9mers in the Kim et al. (2014) dataset. Interquartile range (IQR) for the entire distribution is indicated by the horizontal bracket. The black vertical line indicates the median. A value of 1 indicates perfect prediction. “***” indicates p < 0.001 for the antigen.garnish (a.g) ensemble method compared to all other methods using the post-hoc pairwise Wilcoxon rank sum test with the Bonferroni correction, as determined by bootstrap analysis. The extremes of the distribution outside the axis limits are not shown. (D) Absolute value of error in predicted affinity as a percentage of measured affinity for peptides in the top decile of variance between tools in the Kim et al. (2014) dataset. “***” indicates p < 0.001 for the antigen.garnish (a.g) ensemble method compared to all other methods using the post-hoc pairwise Wilcoxon rank sum test with the Bonferroni correction.
Figure 2:
Figure 2:. Non-mutated Proteome Dissimilarity Enriches for Immunogenic Peptides.
(A) Correlation between antigen.garnish “IEDB score” computed in the R statistical programming language and “TCR recognition probability” computed using provided Python source code from the complete input data from Łuksza et al. (2017). Spearman’s rho and associated p-value are shown. (B) Schematic demonstrating the Immune Epitope Database (IEDB) score and dissimilarity metrics. (C) Receiver-operator characteristic curve for immunogenicity in the Chowell et al. (2015) dataset of peptides with mass spectrometry-confirmed MHC binding. Dissimilarity and IEDB score were computed for all 9,888 unique entries and affinity was determined using the antigen.garnish ensemble method for the 6,050 entries with 4-digit MHC alleles. “AUC” denotes area-under-the-curve. (D) Contingency tables for non-mutated proteome dissimilarity, IEDB score, and MHC affinity analysis applied to the dataset from Chowell et al. (2015). Odds ratios with confidence intervals and Fisher’s Exact test p-values are shown. (E) Receiver-operator characteristic curve for classifying immunogenicity in the Chowell et al. (2015) dataset for dissimilarity, mean Kyte-Doolittle Hydropathy, and mean values for the five Atchley et al. (2005) factors. “AUC” denotes area-under-the-curve.
Figure 3:
Figure 3:. Dissimilarity to the Non-mutated Proteome Enriches for Unique Hydrophobic Neoantigens.
(A) Distribution of dissimilarity values for all neoantigens from: Hellmann et al. (2018), Riaz et al. (2017), Rizvi et al. (2015), Snyder et al. (2014), Van Allen et al. (2015). The grey region indicates “high dissimilarity” neoantigens (dissimilarity > 0.75). (B) Classification of predicted neoantigens from an example patient as classically defined neoantigens (CDNs), alternatively defined neoantigens (ADNs), Immune Epitope Database-homology (IEDB) high neoantigens, and high dissimilarity neoantigens (see methods). (C) Alignments to the non-mutated proteome for all predicted neoantigens. The median number of alignments by alignment length are shown. Vertical error bars indicate 95% confidence intervals. Global Kruskal-Wallis hypothesis test rejected the null hypothesis for all positions. “***” indicates adjusted p < 0.001 for comparison of high dissimilarity neoantigens to all other groups at each alignment length using post-hoc pairwise Wilcoxon rank sum tests with Bonferroni correction. (D) Sequence logo analysis of neoantigens predicted to bind to HLA-A*02. All 9mer neoantigens exclusive to a single classification from HLA-A*02 patients were used to calculate sequence consensus. Letter height is proportional to prevalence of the indicated amino acid at that position. (E) Median Kyte-Doolittle hydropathy at each amino acid position for all neoantigens and control non-binding peptides (predicted MHC affinity 1000–5000nM, “Non-binders”). Positive hydropathy index reflects an enrichment of hydrophobic amino acids. Vertical error bars indicate 95% confidence intervals. Global Kruskal-Wallis hypothesis test rejected the null hypothesis for all positions. “***” indicates adjusted p < 0.001 for comparison of high dissimilarity neoantigens to all other groups at each position using post-hoc pairwise Wilcoxon rank sum tests with Bonferonni correction. (F) Venn diagram showing overlap between predicted neoantigen classes as a percent of all MHC binders for all neoantigens in the combined 318 patients.
Figure 4:
Figure 4:. Predicted Neoantigen Classes Correlate with Tumor Mutational Burden and Progression-free Survival.
(A) Correlation of tumor mutational burden with all MHC binders, classically defined neoantigens (CDNs), alternatively defined neoantigens (ADNs), Immune Epitope Database-homology (IEDB) high neoantigens, and high non-mutated proteome dissimilarity neoantigens. The black line shows a linear regression fit, with the 95% confidence interval in grey. Spearman’s rho and associated p-value are shown. (B–C) Heatmaps of hazard ratios and adjusted logrank test p-values (FDR) for the Cox proportional hazard model for progression-free survival. Patients are stratified at the median for each metric. “Combined NSCLC” is all patients from the Rizvi et al. (2015) and Hellmann et al. (2018) datasets. Comparisons with FDR > 0.05 are shown as empty white tiles.

References

    1. Andreatta M, and Nielsen M (2016). Gapped sequence alignment using artificial neural networks: application to the MHC class I system. Bioinformatics 32, 511–517. - PMC - PubMed
    1. Atchley WR, Zhao J, Fernandes AD, and Drüke T (2005). Solving the protein sequence metric problem. Proc. Natl. Acad. Sci. U.S.A 102, 6395–6400. - PMC - PubMed
    1. Balachandran VP, Łuksza M, Zhao JN, Makarov V, Moral JA, Remark R, Herbst B, Askan G, Bhanot U, Senbabaoglu Y, et al. (2017). Identification of unique neoantigen qualities in long-term survivors of pancreatic cancer. Nature 551, 512–516. - PMC - PubMed
    1. Bhattacharya R, Sivakumar A, Tokheim C, Guthrie VB, Anagnostou V, Velculescu VE, and Karchin R (2017). Evaluation of machine learning methods to predict peptide binding to MHC Class I proteins. BioRxiv 154757.
    1. Camacho C, Coulouris G, Avagyan V, Ma N, Papadopoulos J, Bealer K, and Madden TL (2009). BLAST+: architecture and applications. BMC Bioinformatics 10, 421. - PMC - PubMed

Publication types

MeSH terms