

Lung function decline in former smokers and low-intensity current smokers: a secondary data analysis of the NHLBI Pooled Cohorts Study
- PMID: 31606435
- PMCID: PMC7261004
- DOI: 10.1016/S2213-2600(19)30276-0
Lung function decline in former smokers and low-intensity current smokers: a secondary data analysis of the NHLBI Pooled Cohorts Study
Abstract
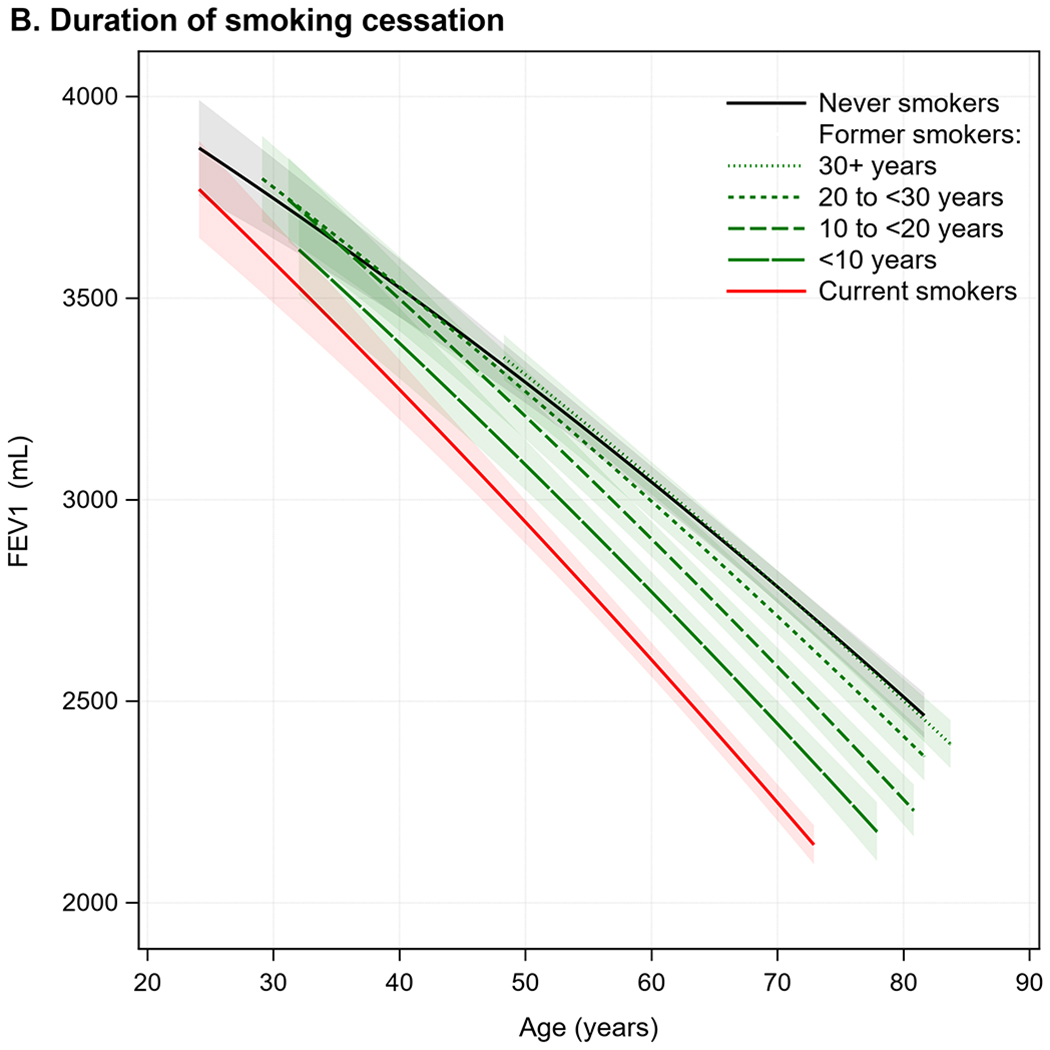
Background: Former smokers now outnumber current smokers in many developed countries, and current smokers are smoking fewer cigarettes per day. Some data suggest that lung function decline normalises with smoking cessation; however, mechanistic studies suggest that lung function decline could continue. We hypothesised that former smokers and low-intensity current smokers have accelerated lung function decline compared with never-smokers, including among those without prevalent lung disease.
Methods: We used data on six US population-based cohorts included in the NHLBI Pooled Cohort Study. We restricted the sample to participants with valid spirometry at two or more exams. Two cohorts recruited younger adults (≥17 years), two recruited middle-aged and older adults (≥45 years), and two recruited only elderly adults (≥65 years) with examinations done between 1983 and 2014. FEV1 decline in sustained former smokers and current smokers was compared to that of never-smokers by use of mixed models adjusted for sociodemographic and anthropometric factors. Differential FEV1 decline was also evaluated according to duration of smoking cessation and cumulative (number of pack-years) and current (number of cigarettes per day) cigarette consumption.
Findings: 25 352 participants (ages 17-93 years) completed 70 228 valid spirometry exams. Over a median follow-up of 7 years (IQR 3-20), FEV1 decline at the median age (57 years) was 31·01 mL per year (95% CI 30·66-31·37) in sustained never-smokers, 34·97 mL per year (34·36-35·57) in former smokers, and 39·92 mL per year (38·92-40·92) in current smokers. With adjustment, former smokers showed an accelerated FEV1 decline of 1·82 mL per year (95% CI 1·24-2·40) compared to never-smokers, which was approximately 20% of the effect estimate for current smokers (9·21 mL per year; 95% CI 8·35-10·08). Compared to never-smokers, accelerated FEV1 decline was observed in former smokers for decades after smoking cessation and in current smokers with low cumulative cigarette consumption (<10 pack-years). With respect to current cigarette consumption, the effect estimate for FEV1 decline in current smokers consuming less than five cigarettes per day (7·65 mL per year; 95% CI 6·21-9·09) was 68% of that in current smokers consuming 30 or more cigarettes per day (11·24 mL per year; 9·86-12·62), and around five times greater than in former smokers (1·57 mL per year; 1·00-2·14). Among participants without prevalent lung disease, associations were attenuated but were consistent with the main results.
Interpretation: Former smokers and low-intensity current smokers have accelerated lung function decline compared with never-smokers. These results suggest that all levels of smoking exposure are likely to be associated with lasting and progressive lung damage.
Funding: National Institutes of Health, National Heart Lung and Blood Institute, and US Environmental Protection Agency.
Copyright © 2020 Elsevier Ltd. All rights reserved.
Figures


Comment in
-
The long-lasting dark shadow of past and present smoking.Lancet Respir Med. 2020 Jan;8(1):3-5. doi: 10.1016/S2213-2600(19)30349-2. Epub 2019 Oct 9. Lancet Respir Med. 2020. PMID: 31606436 No abstract available.
-
Die Lungenfunktion leidet noch Jahrzehnte nach dem Rauchstopp : Pneumologie.MMW Fortschr Med. 2020 Sep;162(16):33. doi: 10.1007/s15006-020-4378-8. MMW Fortschr Med. 2020. PMID: 32959290 Review. German. No abstract available.
-
Cigarette smoking and lung function decline beyond quitting.Ann Transl Med. 2020 Nov;8(22):1531. doi: 10.21037/atm-20-3667. Ann Transl Med. 2020. PMID: 33313276 Free PMC article. No abstract available.
References
-
- U.S. Department of Health and Human Services. The Health Consequences of Smoking—50 Years of Progress: A Report of the Surgeon General. Atlanta, GA: U.S. Department of Health and Human Services, Centers for Disease Control and Prevention, National Center for Chronic Disease Prevention and Health Promotion, Office on Smoking and Health, 2014.
-
- Clarke TC, Norris T, Schiller JS. Early Release of Selected Estimates Based on Data from the 2016 National Health Interview Survey., 2017.
-
- Burns DM, Major JM, Shanks TG. Changes in number of cigarettes smoked per day: cross-sectional and birth cohort analyses using NHIS In: Those who continue to smoke: is achieving abstinence harder and do we need to change our interventions? Smoking and tobacco control monograph no. 15. Bethesda, MD: National Cancer Institute, 2003:83–99. (NIH publication no. 03-5370.).
-
- Global Health Estimates 2016: Deaths by Cause, Age, Sex, by Country and by Region, 2000-2016. Geneva, World Health Organization; 2018.
Publication types
MeSH terms
Grants and funding
- N01 HC085080/HL/NHLBI NIH HHS/United States
- N01 HC095168/HL/NHLBI NIH HHS/United States
- U01 HL080295/HL/NHLBI NIH HHS/United States
- U01 HL130114/HL/NHLBI NIH HHS/United States
- R01 HL077612/HL/NHLBI NIH HHS/United States
- HHSN268201300025C/HL/NHLBI NIH HHS/United States
- R01 HL093081/HL/NHLBI NIH HHS/United States
- R21 HL121457/HL/NHLBI NIH HHS/United States
- HHSN268201000021C/HL/NHLBI NIH HHS/United States
- R01 HL130506/HL/NHLBI NIH HHS/United States
- N01 HC085081/HL/NHLBI NIH HHS/United States
- N01 HC095160/HL/NHLBI NIH HHS/United States
- HHSN268201300026C/HL/NHLBI NIH HHS/United States
- N01 HC095161/HL/NHLBI NIH HHS/United States
- HHSN268201500001C/HL/NHLBI NIH HHS/United States
- N01 HC095169/HL/NHLBI NIH HHS/United States
- N01 HC085082/HL/NHLBI NIH HHS/United States
- HHSN268200800007C/HL/NHLBI NIH HHS/United States
- N01 HC085086/HL/NHLBI NIH HHS/United States
- N01 HC085083/HL/NHLBI NIH HHS/United States
- HHSN268201300048C/HL/NHLBI NIH HHS/United States
- N01 HC095167/HL/NHLBI NIH HHS/United States
- RC1 HL100543/HL/NHLBI NIH HHS/United States
- N01 HC095159/HL/NHLBI NIH HHS/United States
- R01 NR012459/NR/NINR NIH HHS/United States
- HHSN268201300027C/HL/NHLBI NIH HHS/United States
- HHSN268201300049C/HL/NHLBI NIH HHS/United States
- HHSN268201700002C/HL/NHLBI NIH HHS/United States
- HHSN268201200036C/HL/NHLBI NIH HHS/United States
- HHSN268201700001I/HL/NHLBI NIH HHS/United States
- N01 HC025195/HL/NHLBI NIH HHS/United States
- HHSN268200900041C/HL/NHLBI NIH HHS/United States
- HHSN268201300028C/HL/NHLBI NIH HHS/United States
- N01 HC055222/HL/NHLBI NIH HHS/United States
- HHSN268201700004I/HL/NHLBI NIH HHS/United States
- K23 HL138165/HL/NHLBI NIH HHS/United States
- HHSN268201500001I/HL/NHLBI NIH HHS/United States
- R21 HL129924/HL/NHLBI NIH HHS/United States
- N01 HC085079/HL/NHLBI NIH HHS/United States
- HHSN268201300047C/HL/NHLBI NIH HHS/United States
- HHSN268201300050C/HL/NHLBI NIH HHS/United States
- N01 HC095163/HL/NHLBI NIH HHS/United States
- R01 AG028050/AG/NIA NIH HHS/United States
- HHSN268201700005C/HL/NHLBI NIH HHS/United States
- HHSN268201700001C/HL/NHLBI NIH HHS/United States
- HHSN268201700003C/HL/NHLBI NIH HHS/United States
- HHSN268201700004C/HL/NHLBI NIH HHS/United States
- HHSN268201300046C/HL/NHLBI NIH HHS/United States
- N01 HC095166/HL/NHLBI NIH HHS/United States
- HHSN268201700002I/HL/NHLBI NIH HHS/United States
- HHSN268201700005I/HL/NHLBI NIH HHS/United States
- HHSN268201300029C/HL/NHLBI NIH HHS/United States
- K23 HL130627/HL/NHLBI NIH HHS/United States
- R01 AG023629/AG/NIA NIH HHS/United States
- N01 HC095162/HL/NHLBI NIH HHS/United States
- HHSN268201700021C/HL/NHLBI NIH HHS/United States
- N01 HC095165/HL/NHLBI NIH HHS/United States
- N01 HC095164/HL/NHLBI NIH HHS/United States
- R01 HL122477/HL/NHLBI NIH HHS/United States
- HHSN268201700003I/HL/NHLBI NIH HHS/United States
LinkOut - more resources
Full Text Sources
