. 2019 Oct 12;11(19):8556-8572.
doi: 10.18632/aging.102345. Epub 2019 Oct 12.

Conserved aging-related signatures of senescence and inflammation in different tissues and species

Affiliations

Conserved aging-related signatures of senescence and inflammation in different tissues and species

Emanuel Barth et al. Aging (Albany NY). .

Abstract

Increasing evidence indicates that chronic inflammation and senescence are the cause of many severe age-related diseases, with both biological processes highly upregulated during aging. However, until now, it has remained unknown whether specific inflammation- or senescence-related genes exist that are common between different species or tissues. These potential markers of aging could help to identify possible targets for therapeutic interventions of aging-associated afflictions and might also deepen our understanding of the principal mechanisms of aging. With the objective of identifying such signatures of aging and tissue-specific aging markers, we analyzed a multitude of cross-sectional RNA-Seq data from four evolutionarily distinct species (human, mouse and two fish) and four different tissues (blood, brain, liver and skin). In at least three different species and three different tissues, we identified several genes that displayed similar expression patterns that might serve as potential aging markers. Additionally, we show that genes involved in aging-related processes tend to be tighter controlled in long-lived than in average-lived individuals. These observations hint at a general genetic level that affect an individual's life span. Altogether, this descriptive study contributes to a better understanding of common aging signatures as well as tissue-specific aging patterns and supplies the basis for further investigative age-related studies.

Keywords: RNA-Seq; aging; inflammaging; senescence; transcriptomics.


Conflict of interest statement

CONFLICTS OF INTEREST: The authors declare that no conflicts of interest exist.

Figures

Figure 1
Figure 1
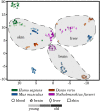
A t-distributed stochastic neighbor embedding (t-SNE) of the analyzed RNA-Seq libraries. All RNA-Seq samples were clustered based on the expression patterns of the selected senescence and inflammation related genes, utilizing the t-SNE approach. All tissues form distinctive species-specific and non-overlapping clusters with exception to very few single outliers. Additionally, larger species-independent tissue clusters were drawn to improve the visualization of the data. However, the three different time points did not generally separate in independent clusters of their own. A weak segregation can only be observed among the mature and old-aged skin samples of all four species. For more information, see Supplementary Data 10.
Figure 2
Figure 2
Change of relative standard deviations of gene expression in all four species with age. For each investigated species and tissue, the measured variance in transcript expression of the preselected senescence- and inflammation-related genes is displayed for every time point (M – mature, O – old, OA – old-aged). The upper and lower bounds of the box plots represent the respective 2.5% percentiles. All displayed differences in the mean variance of gene expression among the aged and old-aged time points and almost all other age comparisons are significant (*: p-Value ≤ 0.01, **: p-Value ≤ 0.001, ***: p-Value ≤ 0.0001,) within each tissue and species, individually. A general decrease of variance in gene expression can be observed in the old-age time points, except for the skin samples of Mus musculus, Danio rerio and Nothobranchius furzeri. This indicates a tighter control of inflammaging processes in long-lived individuals, reducing negative effects and helped them to reach the high age. For detailed information, see Supplementary Data 4.
Figure 3
Figure 3
Differentially expressed genes during tissue aging and associated biological processes. The upper part shows the number of identified differentially expressed genes (DEGs) within all three age comparisons (early aging, late aging, longevity) in every investigated species and tissue. The lower part shows for every comparison the dominant biological processes as determined by the majority of the annotated functions of the respective DEGs. Note that in some comparisons only few DEGs could be identified and hence may only poorly reflect the underlying age-related processes (n.d. – no data). For detailed information, see Supplementary Data 6 and Supplementary Data 11.
Figure 4
Figure 4
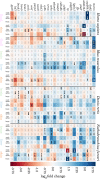
Heatmap representation of potentially conserved senescence- and inflammation-related genes. Genes are represented as mouse orthologues (a complete list of gene orthologues can be found in Supplementary Data 8). Numbers indicate log2 fold changes between two compared ages, where a positive value indicates an upregulation (blue), and a negative value downregulation (red) of the respective gene with aging. All significant changes in gene expression are indicated in bold. For detailed information, see Supplementary Data 7.
Figure 5
Figure 5
Common inflammation- and senescence-related genes that are significantly changed with age. Venn diagrams showing the overlap of the identified differentially expressed genes among the four investigated tissues. Only few genes are commonly differentially expressed among all species of any of the four tissue comparisons. For detailed information, see Supplementary Data 9.
Figure 6
Figure 6
Overview of the analyzed high-throughput transcriptomic data. For each of the four investigated species, up to four different tissues were sampled at three different ages: one mature (M) time point, one aged (A) time point and one old-aged (OA) time point. Three different comparisons were made to reveal significant differences in expression of genes during early aging (M vs. A), late aging (M vs. OA) and longevity (O vs. OA). For more details, see Supplementary Data 1.

References

    1. Aramillo Irizar P, Schäuble S, Esser D, Groth M, Frahm C, Priebe S, Baumgart M, Hartmann N, Marthandan S, Menzel U, Müller J, Schmidt S, Ast V, et al.. Transcriptomic alterations during ageing reflect the shift from cancer to degenerative diseases in the elderly. Nat Commun. 2018; 9:327. 10.1038/s41467-017-02395-2 - DOI - PMC - PubMed
    1. Collado M, Blasco MA, Serrano M. Cellular senescence in cancer and aging. Cell. 2007; 130:223–33. 10.1016/j.cell.2007.07.003 - DOI - PubMed
    1. Jeyapalan JC, Sedivy JM. Cellular senescence and organismal aging. Mech Ageing Dev. 2008; 129:467–74. 10.1016/j.mad.2008.04.001 - DOI - PMC - PubMed
    1. Bhatia-Dey N, Kanherkar RR, Stair SE, Makarev EO, Csoka AB. Cellular senescence as the causal nexus of aging. Front Genet. 2016; 7:13. 10.3389/fgene.2016.00013 - DOI - PMC - PubMed
    1. Giunta B, Fernandez F, Nikolic WV, Obregon D, Rrapo E, Town T, Tan J. Inflammaging as a prodrome to Alzheimer’s disease. J Neuroinflammation. 2008; 5:51. 10.1186/1742-2094-5-51 - DOI - PMC - PubMed

Publication types