. 2019 Oct 21;29(20):3439-3456.e5.
doi: 10.1016/j.cub.2019.08.050. Epub 2019 Oct 10.

Unconventional Cell Division Cycles from Marine-Derived Yeasts

Affiliations

Unconventional Cell Division Cycles from Marine-Derived Yeasts

Lorna M Y Mitchison-Field et al. Curr Biol. .

Abstract

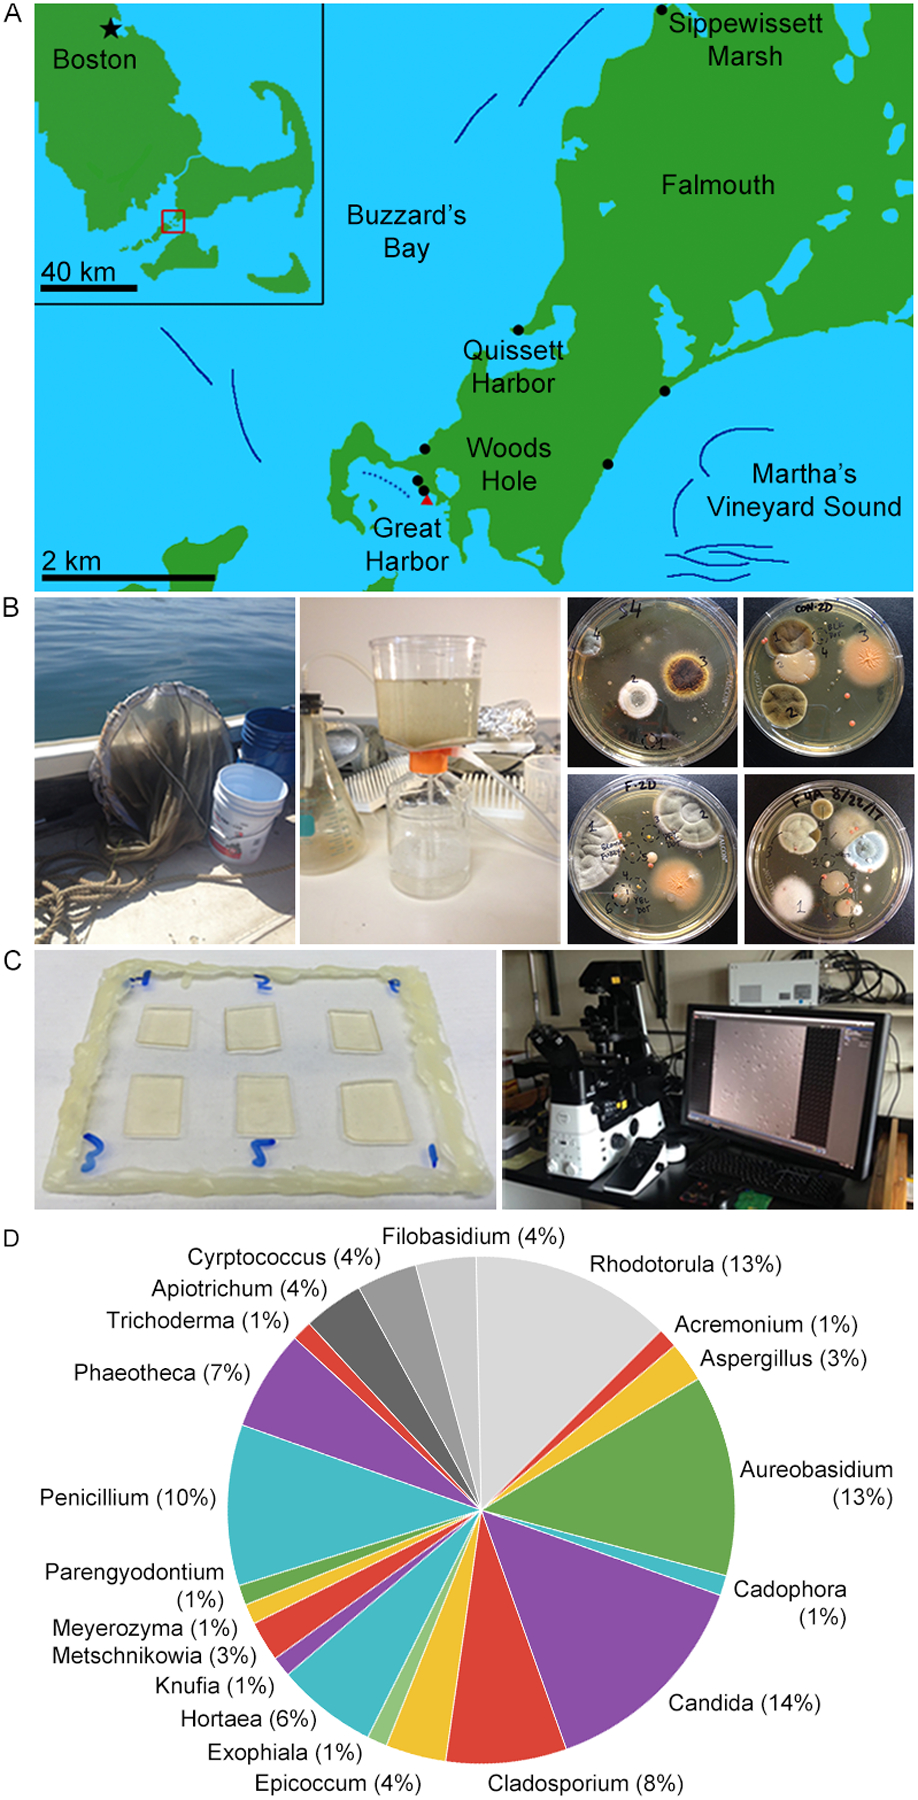
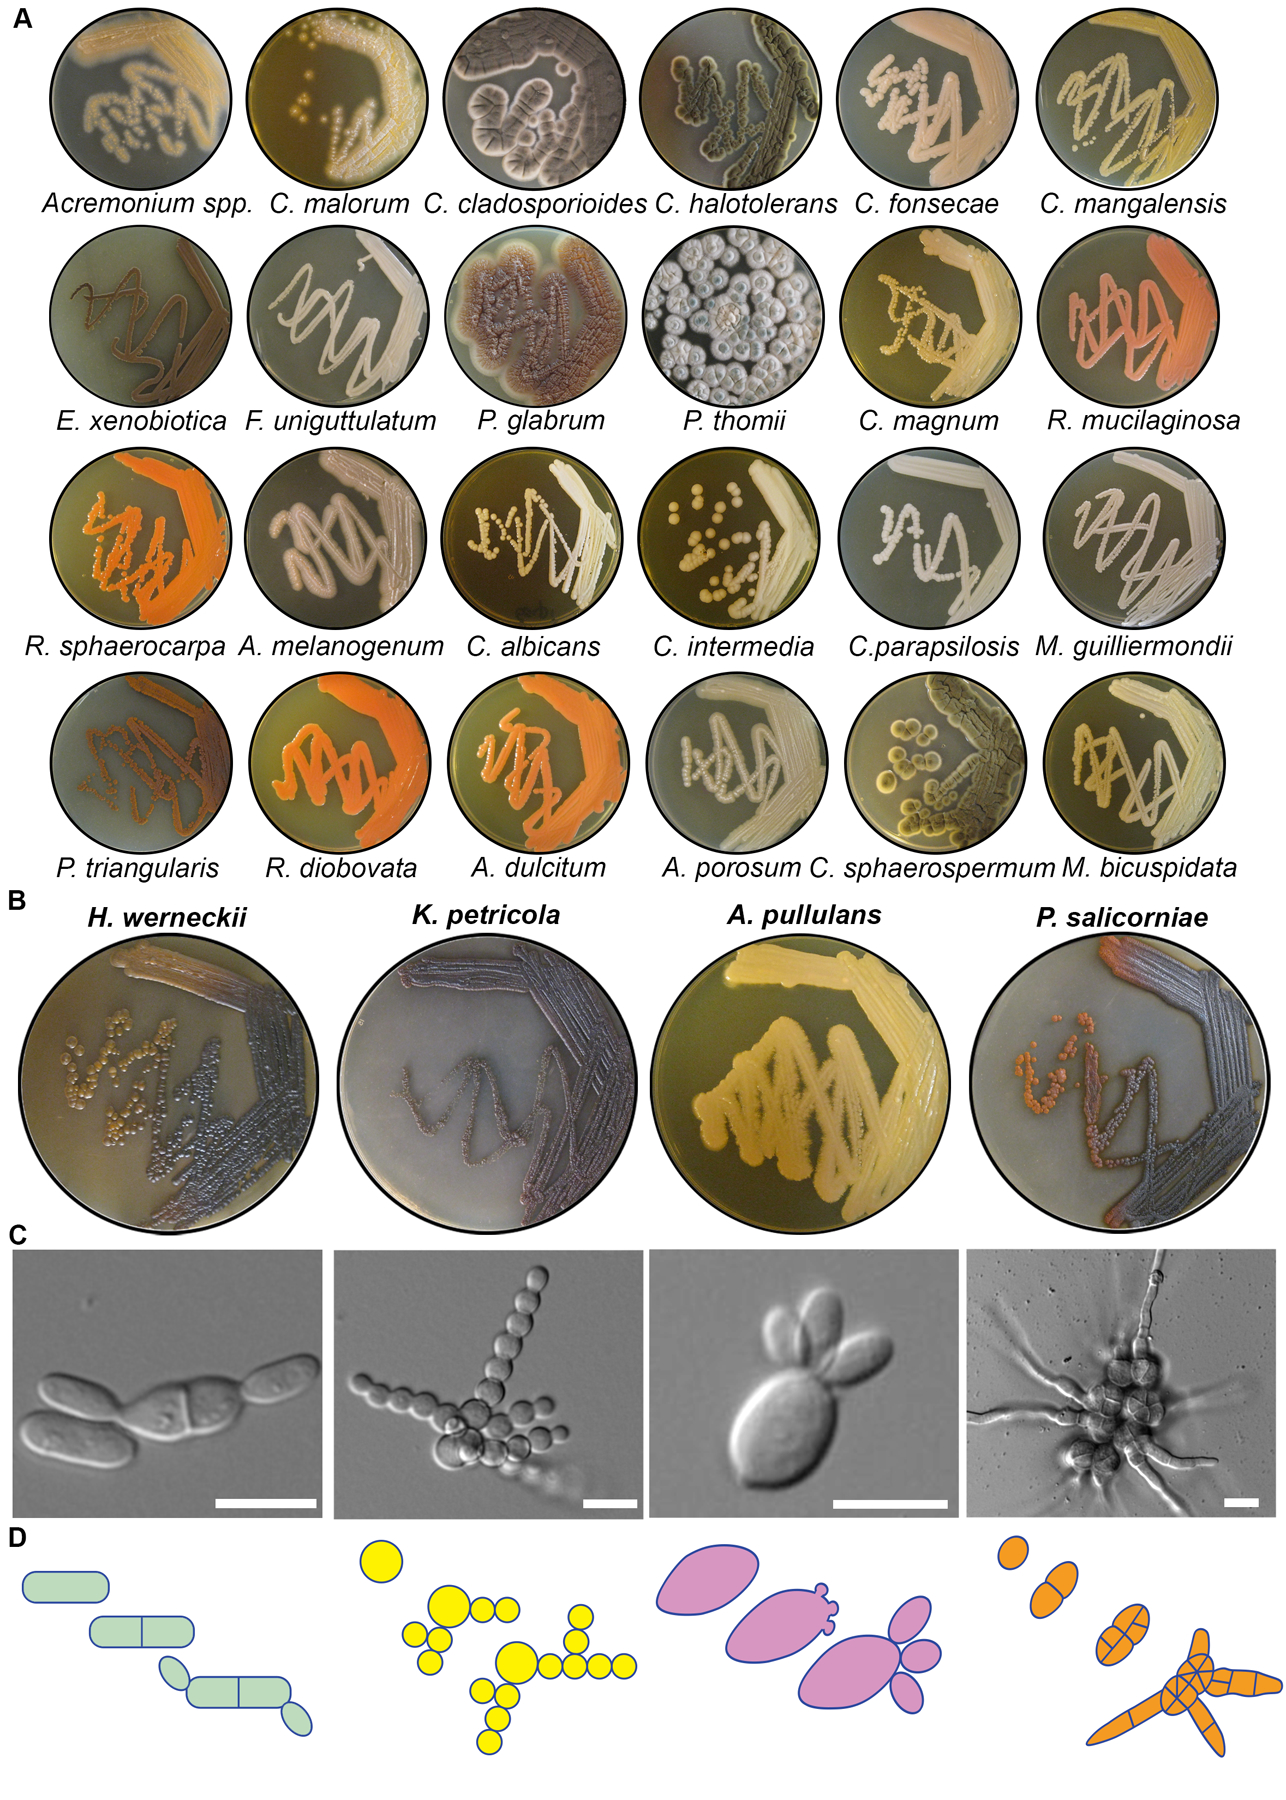
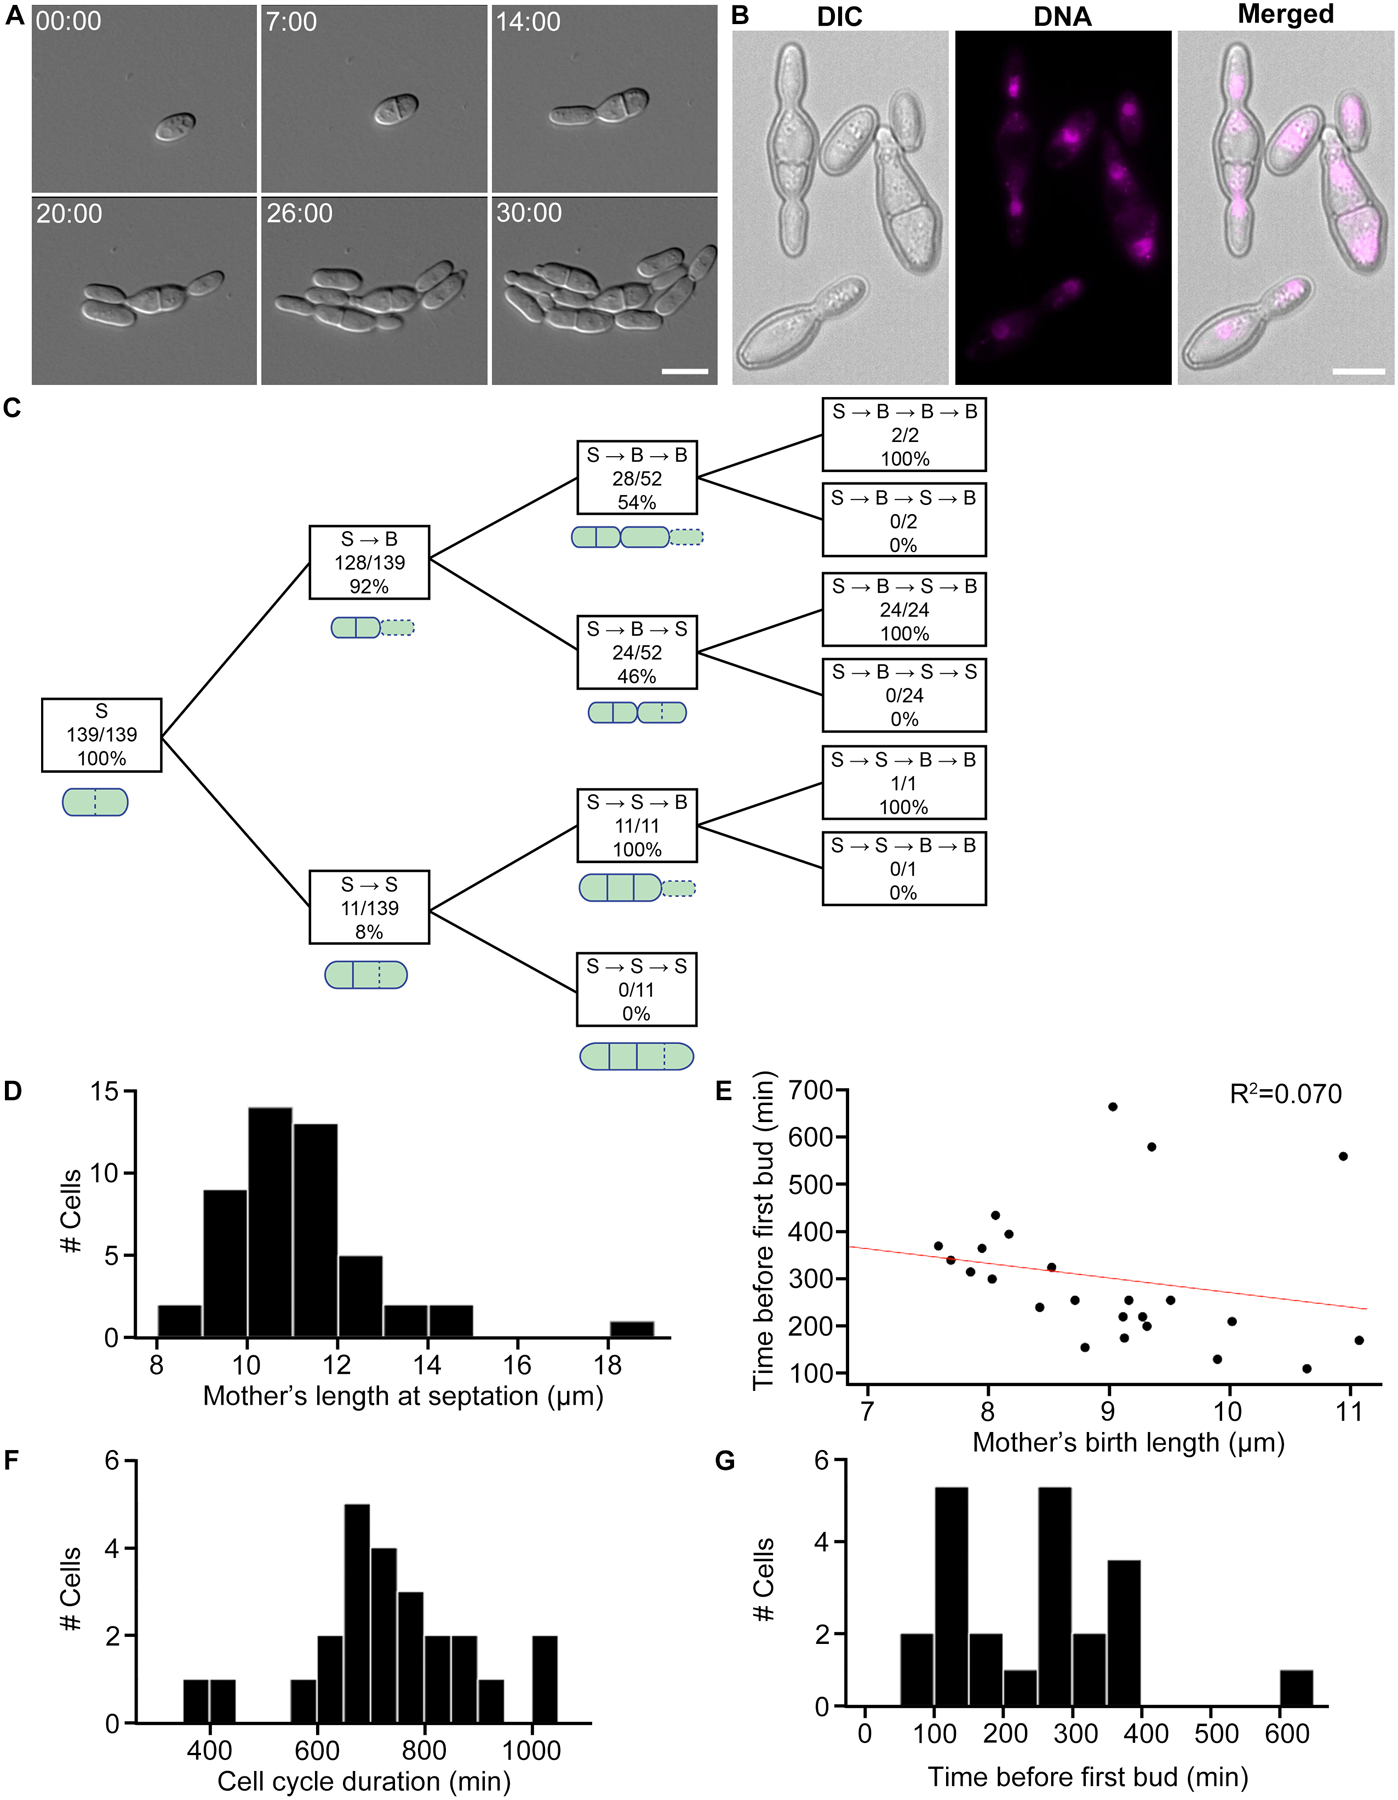
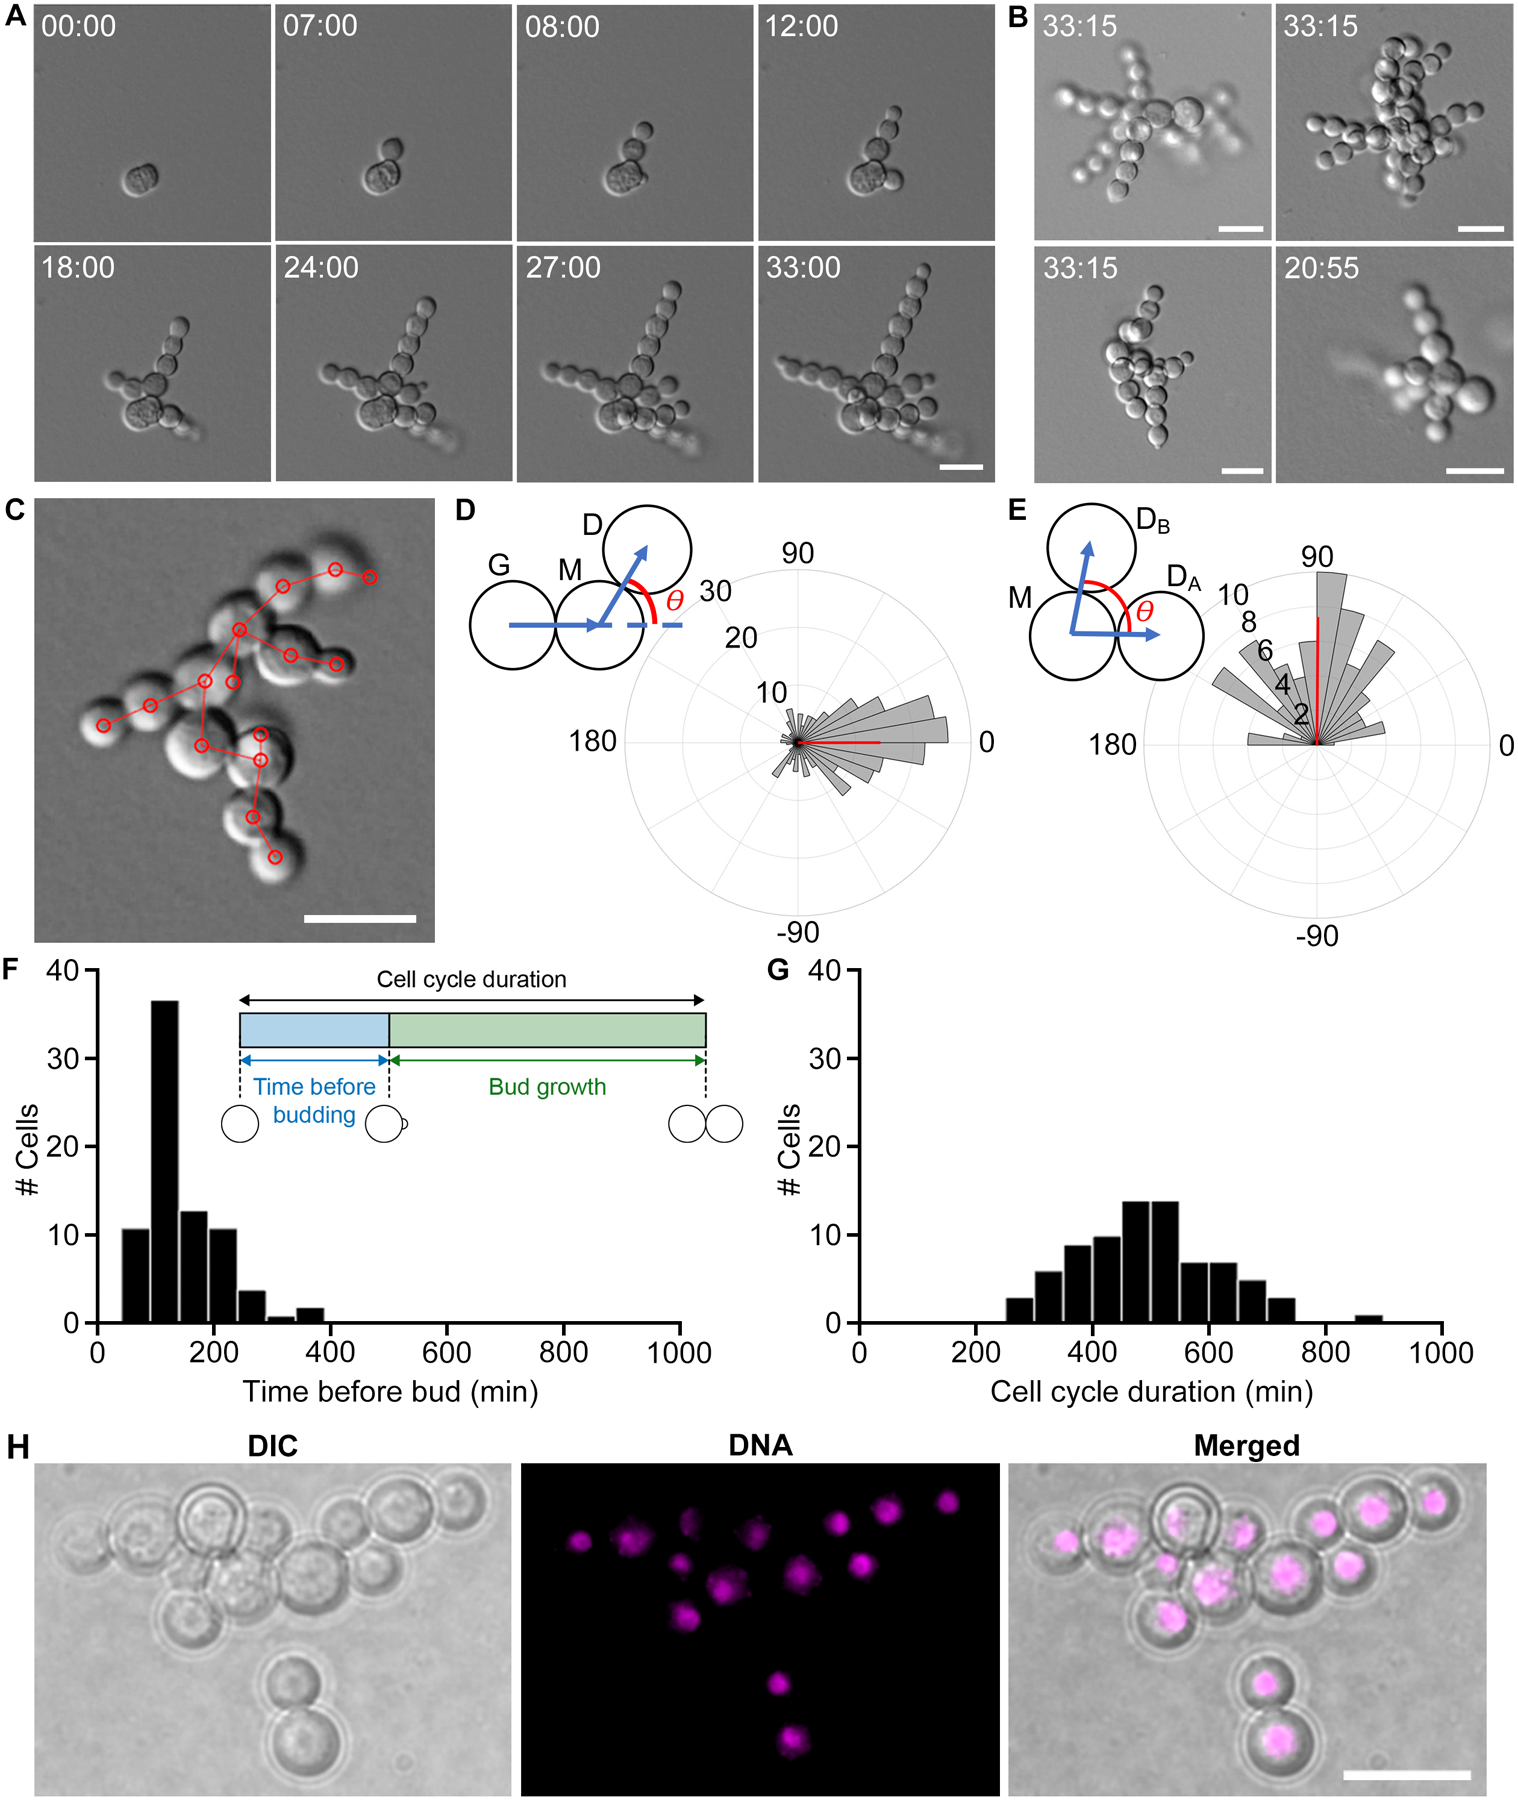
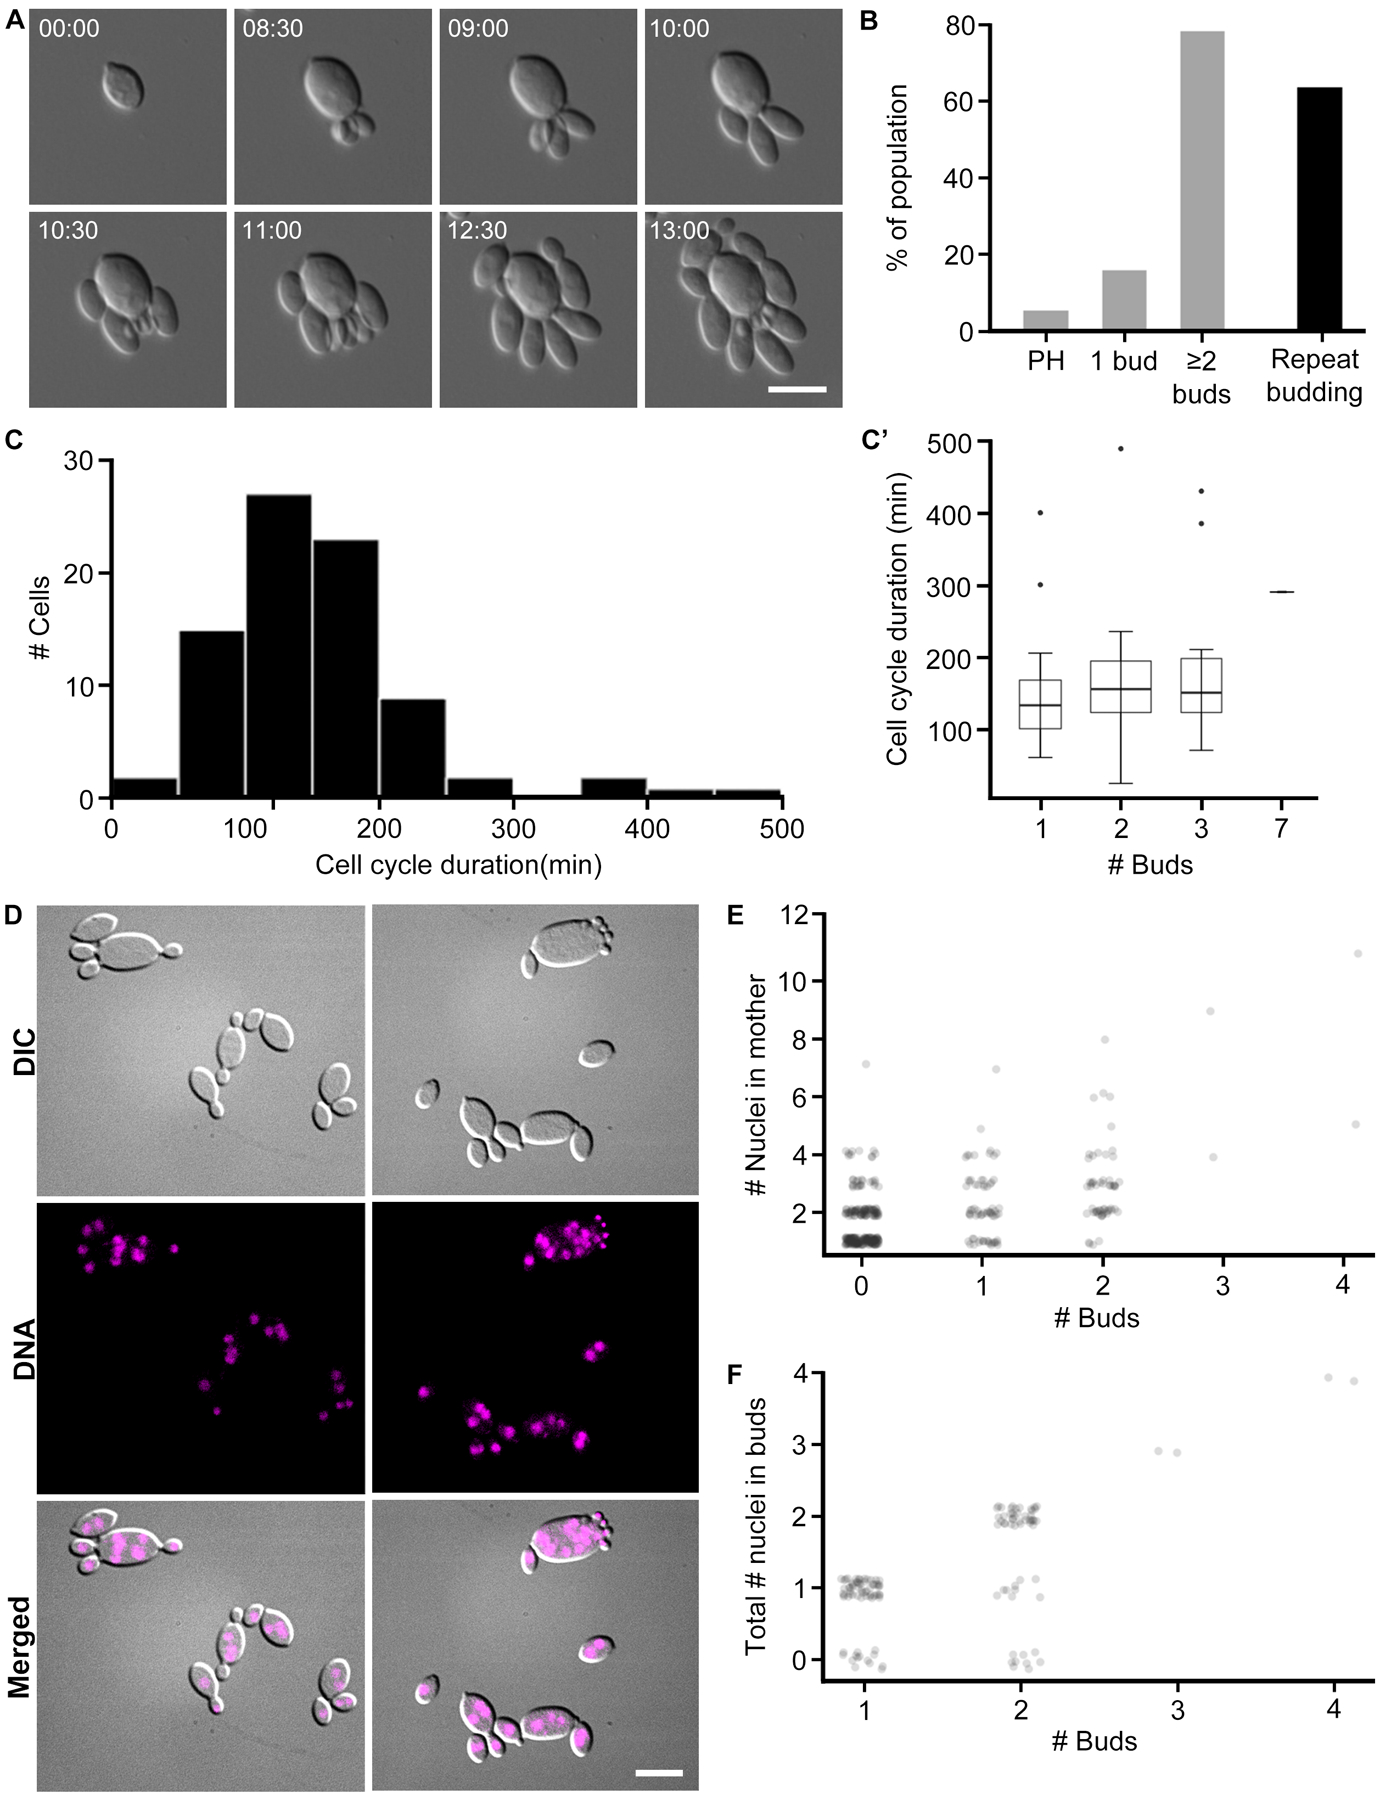
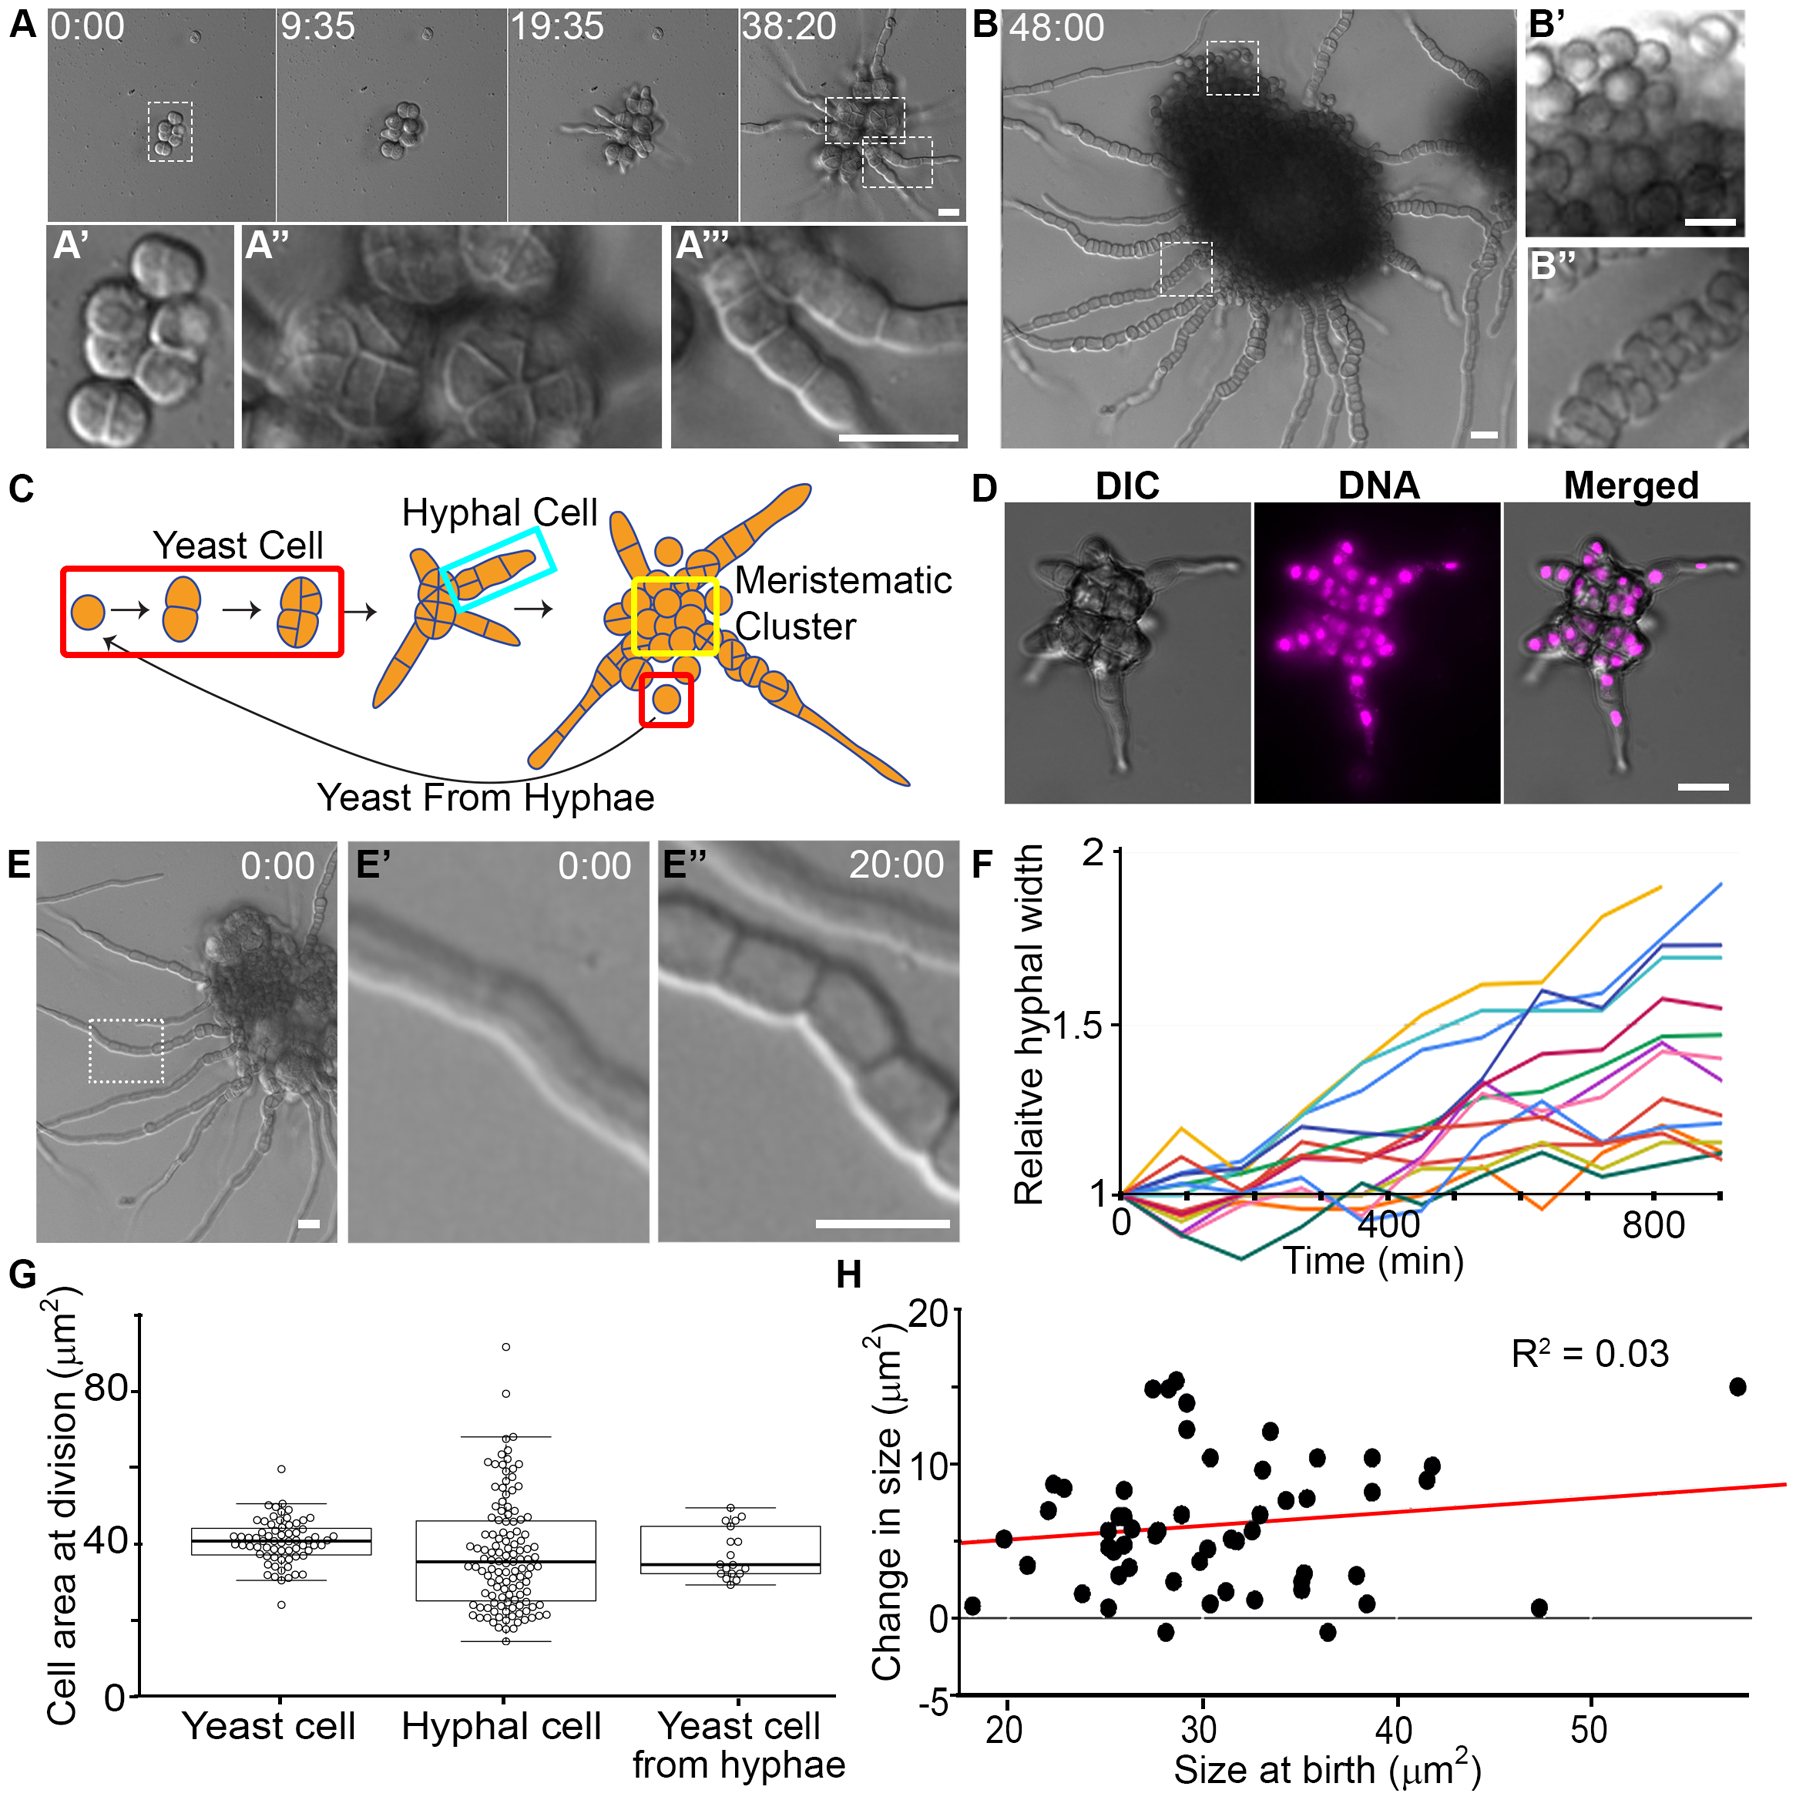
Fungi have been found in every marine habitat that has been explored; however, the diversity and functions of fungi in the ocean are poorly understood. In this study, fungi were cultured from the marine environment in the vicinity of Woods Hole, MA, USA, including from plankton, sponge, and coral. Our sampling resulted in 35 unique species across 20 genera. We observed many isolates by time-lapse, differential interference contrast (DIC) microscopy and analyzed modes of growth and division. Several black yeasts displayed highly unconventional cell division cycles compared to those of traditional model yeast systems. Black yeasts have been found in habitats inhospitable to other life and are known for halotolerance, virulence, and stress resistance. We find that this group of yeasts also shows remarkable plasticity in terms of cell size control, modes of cell division, and cell polarity. Unexpected behaviors include division through a combination of fission and budding, production of multiple simultaneous buds, and cell division by sequential orthogonal septations. These marine-derived yeasts reveal alternative mechanisms for cell division cycles that seem likely to expand the repertoire of rules established from classic model system yeasts.

Keywords: Aureobasidium pullulans; Hortaea werneckii; Knufia petricola; Phaeotheca salicorniae; black yeast; cell cycle; cell division; marine fungi.


Conflict of interest statement

Declaration of Interests

The authors have no competing interests to declare.

Figures

Figure 1.
Figure 1.. Culturing marine fungi from marine and coastal environments around Woods Hole, MA.
(A) Collection sites. Solid dark blue lines denote cruise tracks of plankton tows. The dotted blue line denotes the approximate cruise track of a Great Harbor tow. Black dots mark beach sediment samples and the red triangle marks where coral and sponge were collected. (B) Collection and culture methodology. Water column samples were collected by conducting plankton tows 1–1.2 km offshore using a 504 μm mesh net (left). 1.0 L water was concentrated using a 0.22 μm filter (center). Cultures were grown on various media for 1–2 weeks at 18–20 °C. (C) DIC imaging methodology. Samples were prepared six per slide on agar pads. Images were collected at 5 min intervals at 18–20 °C. (D) Genus abundance. Numeric labels indicate number of isolates found belonging to each of the 20 different genera we found. We found 16 different genera of Ascomycota (in color) and 4 Basidiomycota (grayscale).
Figure 2.
Figure 2.. Overview of cultured marine-derived fungal diversity.
(A) Macroscopic colony morphology of identified marine fungi grown for 10 days on YPD + 0.6M NaCl. Related to Figure S1. (B) Macroscopic colony morphology of the four black yeasts chosen for further characterization. (C) Representative DIC images of each species showing division patterns. These images are used again in Figure 3A (H. werneckii), Figure 4A (K. petricola), Figure 5A (A. pullulans), and Figure 6A (P. salicorniae) and are stills from Video S1, Video S2, Video S3, and Video S6. Scale bar, 10 μm. (D) Schematic diagrams of colony growth for each species.
Figure 3.
Figure 3.. Hortaea werneckii cells divide via septation and budding.
(A) H. werneckii cell growth and development under 40x DIC. These images are stills from Video S1. Scale bar, 10 μm. Time, Hours:Minutes. (B) DNA staining in fixed cells. H. werneckii cells contain one nucleus per compartment. Mitosis seems to occur across the axis of cell division. Nuclei were stained using Hoechst. Scale bar, 10 μm. (C) Quantifying sequence of cell division events. In this strain of H. werneckii we observed two cell division event types, budding and septation. Septation and budding events are represented by “S” and “B”, respectively. Dotted lines in the accompanying schematics indicate the latest division event type in that sequence. The diagram is interpreted as follows: of 139 total cells observed, all underwent septation as a first division event. Of those cells, 128 budded next (S → B) and 11 septated again (S → B). 52 of the 128 S → B cells divided again, 28 of which budded (S → B → B) and 24 septated (S → B → S). (D) Mother’s length at septation. Mothers grew to an average length of 11.2 μm before septating (N = 48, SD = 1.7, CV = 15.2%). (E) Mother’s birth length (μm) vs. cell cycle length (min). Birth length is defined as the length of a cell it breaks off from its mother. Red line denotes linear fit. Larger cells have a shorter division time (N = 24, R2 = 0.070). (F) Cell cycle duration of H. werneckii (min). This is a measurement of the full cell cycle duration (N = 24, mean = 730, SD = 158, CV = 21.6%). (G) Time before first bud (min). Time until a mother cell begins producing its first daughter cell (N = 24, mean = 253, SD = 124, CV = 49.0%).
Figure 4.
Figure 4.. K. petricola growth through highly polarized patterning of spherical buds.
(A) Representative DIC time lapse images of K. petricola colony growth and development (40x). These stills are from Video S2. Scale bar, 10 μm. Time, Hours:Minutes. (B) Final frames from four different colonies. These stills provide more examples of colony growth. Scale bars, 10 μm. Time, Hours:Minutes. (C) Methodological framework of measuring angles between cells. Based on the last frame of each DIC movie we locate the center of each cell (red circles) and define cell lineages (red lines). (D) Angle between daughter (D), mother (M), and grandmother (G) cells. This analysis includes 237 G-M-D lineages, and only considers cases where a cell produces zero or one daughter(s); it excludes cells where branching occurs. The angle θ measures how linear three generations within the same lineage are (see schematic above), where θ = 0° means that the lineage is perfectly linear and θ = 180° means that the daughter buds back in the direction of its grandmother. Positive and negative angles indicate clockwise and counterclockwise growth, respectively. Circular mean of budding angle was 0.07°, indicated by the angle of the red vector, and circular variance was 0.45, indicated by the length of the red vector. (E) Angle between sibling cells. θ is the angle between sibling cells if a mother cell produces multiple daughters, where θ = 0° means that the daughters budded in the same direction and θ = 180° means they budded in opposite directions (see schematic above) (N = 84). Positive and negative angles indicate clockwise and counterclockwise growth, respectively. Circular mean of budding angle was 89.6° and circular variance was 0.26. (F) Time before budding. Cells are capable of a remarkably quick turnaround time of 10 min, but could also take as long as 320 min (N = 28, mean = 110, SD = 64.6, CV = 58.7%). (G) Cell cycle duration (min). Cell cycle duration is highly variable (N = 28, mean = 499, SD = 121, CV = 24.3%). (H) DNA staining in fixed cells. Cells are uninucleate. Scale bar, 10 μm.
Figure 5.
Figure 5.. A. pullulans is multinucleate and is capable of producing multiple buds simultaneously.
(A) Representative DIC images of A. pullulans cell growth and budding at 40x. Cells may produce multiple buds at once, and sometimes do so in quick succession and from the same site. Scale bar, 10 μm. Time, Hours:Minutes. These stills are from Video S3. Additional images of cells are provided in Video S4. (B) Percentage of population that produce multiple buds. In grey are the percentage of cells that become pseudohyphal (PH), produce one or multiple simultaneous buds (N =75). 59 cells (79%) produce multiple simultaneous buds. Of those, 38 cells (64%) repeatedly produce multiple simultaneous buds, indicated by the black bar. (C) Cell cycle length (min). This is a measurement of the full cell cycle duration (N = 82, mean = 159.5 min, median = 150, SD = 80.5, CV= 50.5%). C’) Cell cycle length based on number of buds that a mother produces. The number of simultaneous daughter cells that a mother produces does not seem to affect the length of its cell cycle. Box widths are representative of sample size. (D) DNA staining in fixed cells reveals that mother cells are multinucleate. Buds are predominantly uninucleate, but some appear to have no nuclei. Scale bar, 10 μm. (E) Number of nuclei in mother cells binned by the number of buds it produces. This counts only the nuclei that are in the mother cells (N = 371). Data were scored from fixed cells. Mothers that produce more buds appear to have more nuclei. (F) Total number of nuclei in buds. This counts the number of nuclei in buds from the same mother (N = 127 family groups). Data were scored from fixed cells. While this does not explicitly reflect the number of nuclei in each bud, we observed no multinucleate buds.
Figure 6.
Figure 6.. P. salicorniae colony growth involves meristematic division and filamentation.
(A) Representative DIC micrographs of P. salicorniae colony growth over the course of 38 hr. Insets show different features of the colony A’ yeast cell, A” wedge shaped cells, A’’’ hyphal cells. These stills are from Video S6. Scale bar, 10 μm. Time, Hours:Minutes. (B) Representative DIC micrograph of a P. salicorniae colony 48 hr after the start of growth. Insets (B’ B”) show different cell types within the colony. These stills are from Video S6. Scale bar, 10 μm. Time, Hours:Minutes. (C) Model for the growth of a P. salicorniae from a single colony. Initial growth begins with a yeast cell (red box). Growth is isotropic and divisions bisect the cell resulting in wedge shaped cells (see A”). At some point some yeast cells begin to grow hyphae (turquoise box), while other cells within the colony divide to form yeast cells (yellow box). Hyphal cells continue to divide until eventually the hyphae burst with cells that are morphologically similar to the initial yeast cell. (D) DNA staining in fixed cells. P. salicorniae compartments contain only a single nucleus. Representative image of a P. salicorniae colony in DIC, stained with DAPI, and in merge. Scale bar, 10 μm. (E) P. salicorniae hyphae continue grow wider while elongating. A representative image of a colony at the start of filming. Inset (E’, E”) showing hyphal width at the start of filming (0:00) and the conclusion of filming (12:00). These stills are from Video S6. Scale bar, 10 μm. Time, Hours:Minutes. (F) Quantification of the change in relative hyphal thickness from the start to end of filming. Each line represents an individual hypha, all hyphae increase in thickness over the length of filming. (G) Quantification of cell size at division in various cell types. The mean size at division is not significantly different between cell types (p > 0.05, t-test) but hyphal divisions are significantly more variable than yeast cells exhibiting both much larger and much smaller cells (p < 0.01, f-test). (H) Quantification of the cell size at birth vs. the cell size at division for hyphal cells and yeast cells.

Comment in

References

    1. de Vargas C, Audic S, Henry N, Decelle J, Mahé F, Logares, Lara E, Berney C, Le Bescot N, Probert I, et al. (2015). Eukaryotic plankton diversity in the sunlit ocean. Science 348, 1261605.1261601–1261605.1261611. - PubMed
    1. Kohlmeyer J, and Kohlmeyer E (1979). Marine Mycology The Higher Fungi, (Academic Press; ).
    1. Blum LK, Mills AL, Zieman JC, and Zieman RT (1988). Abundance of bacteria and fungi in seagrass and mangrove detritus. Mar Ecol Prog Ser 42, 73–78.
    1. Takami H, Inoue A, Fuji F, and Horikoshi K (1997). Microbial flora in the deepest sea mud of the Mariana Trench. FEMS Microbiol Lett 152, 279–285. - PubMed
    1. Kim K, Harvell CD, Kim PD, Smith GW, and Merkel SM (2000). Fungal disease resistance of Caribbean sea fan corals (Gorgonia spp.). Mar Biol 136, 259–267.

Publication types

LinkOut - more resources