. 2019 Nov 12;13(5):847-861.
doi: 10.1016/j.stemcr.2019.09.005. Epub 2019 Oct 10.

Human Cortical Organoids Expose a Differential Function of GSK3 on Cortical Neurogenesis

Affiliations

Human Cortical Organoids Expose a Differential Function of GSK3 on Cortical Neurogenesis

Alejandro López-Tobón et al. Stem Cell Reports. .

Abstract

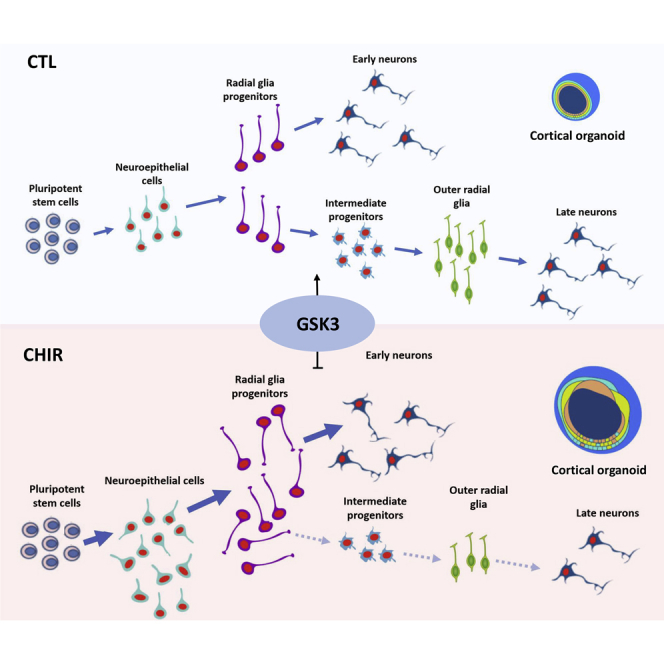
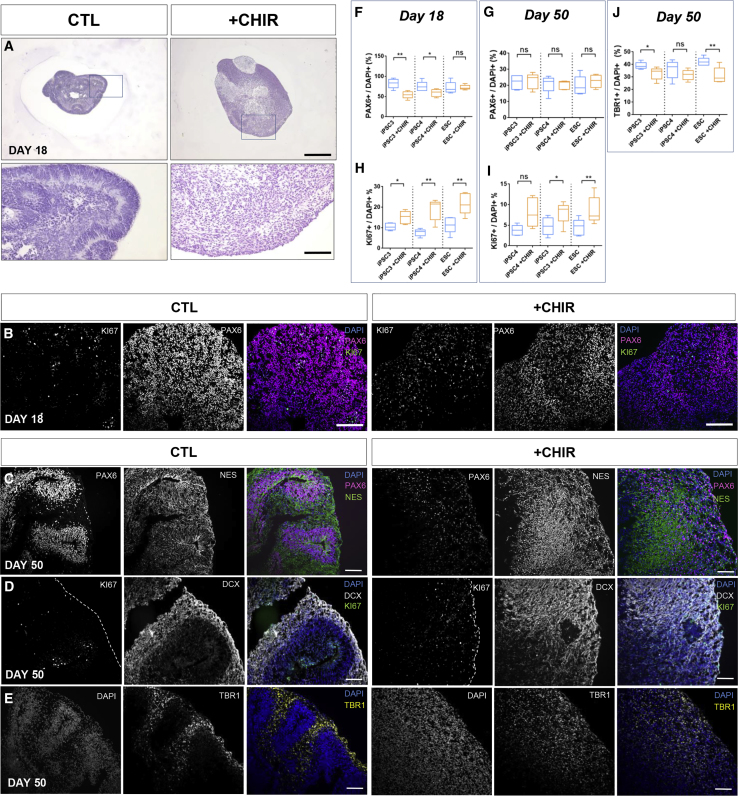
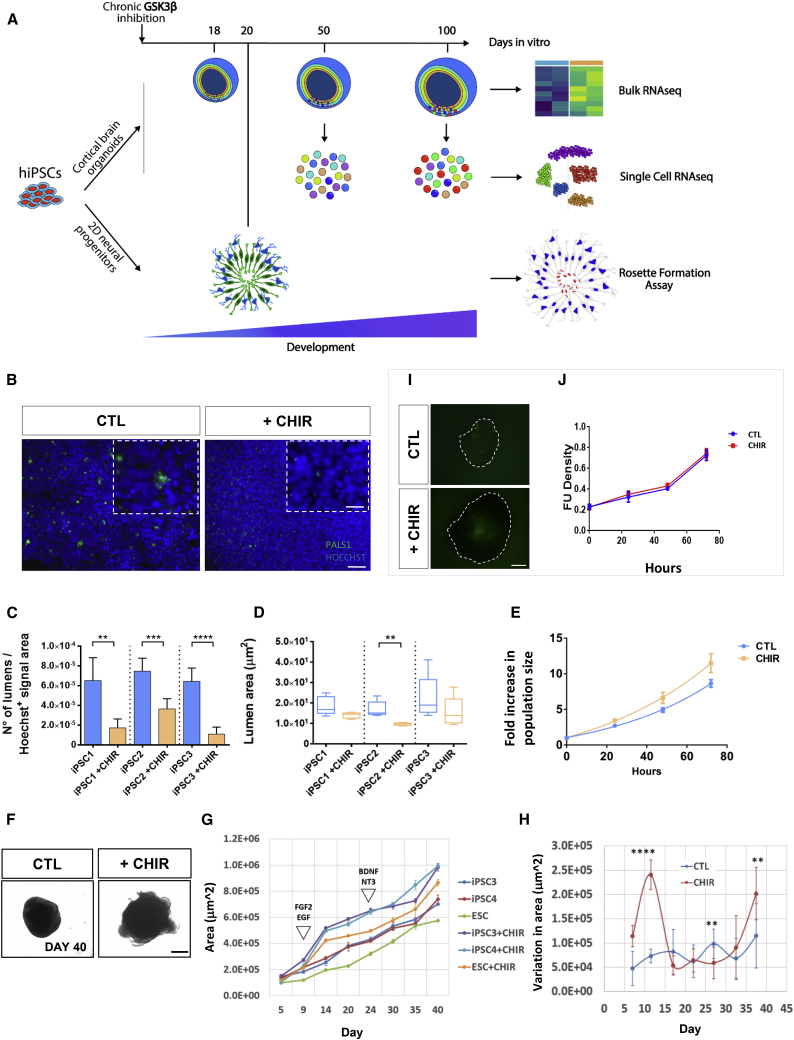
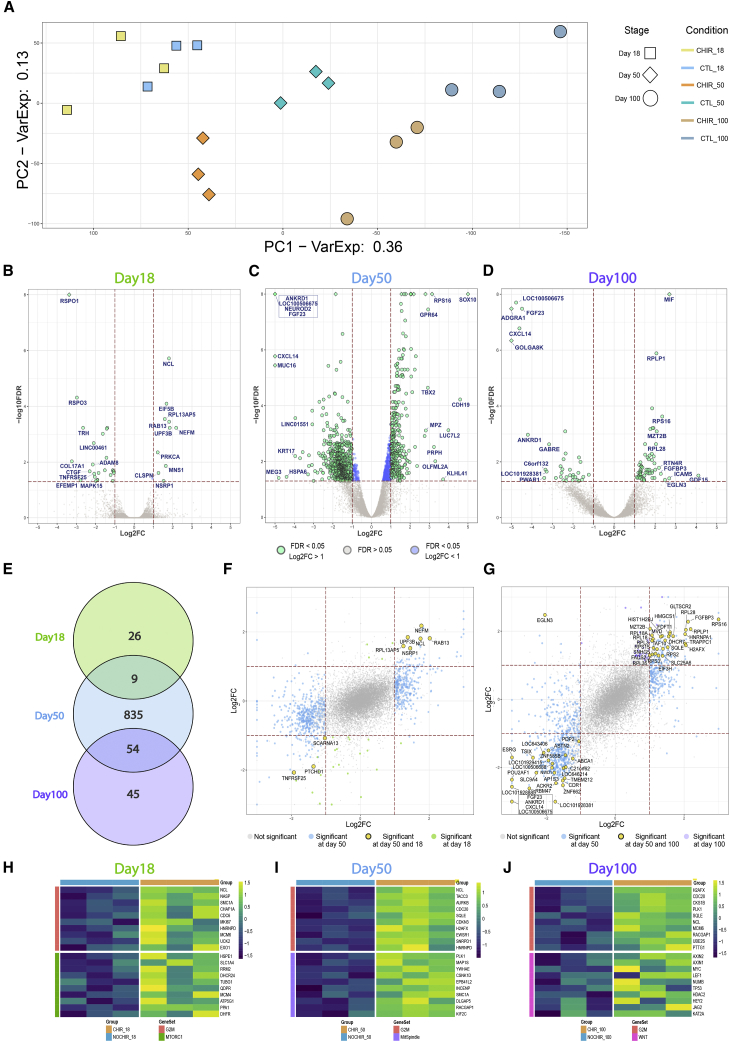
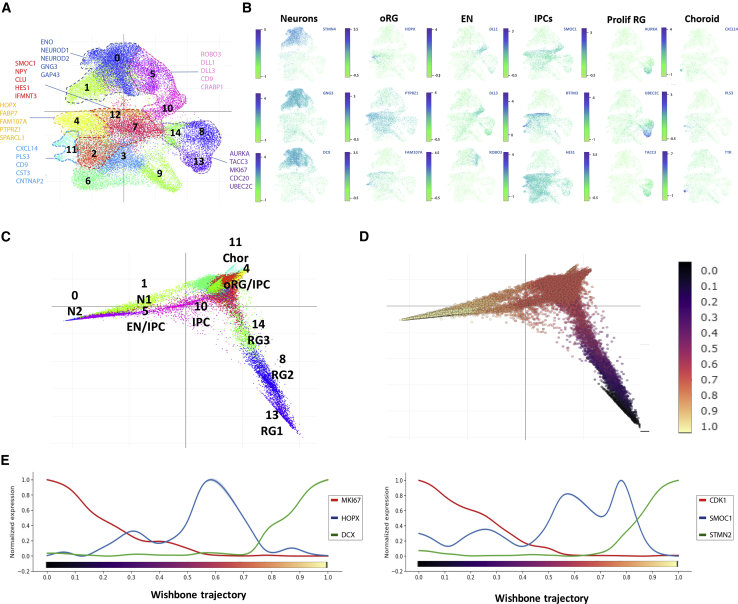
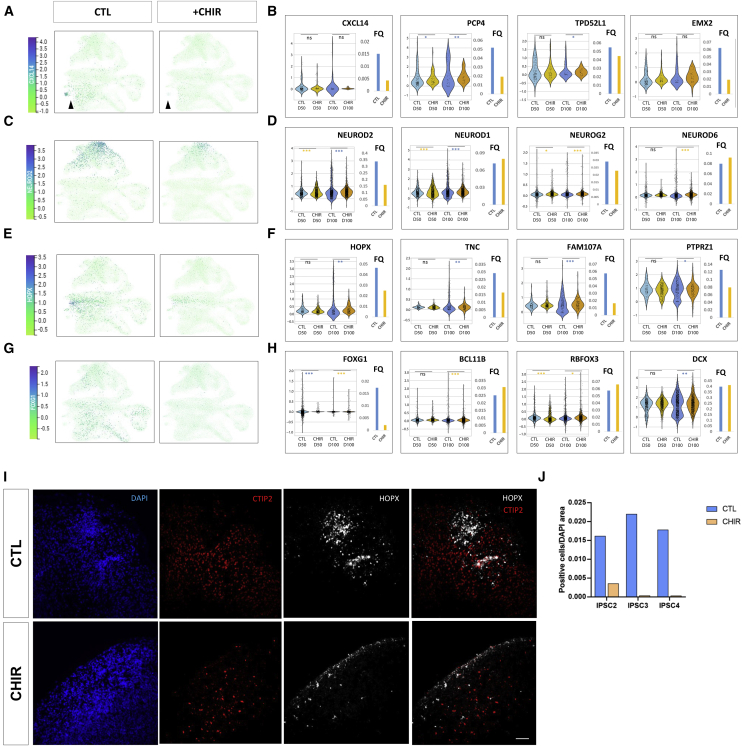
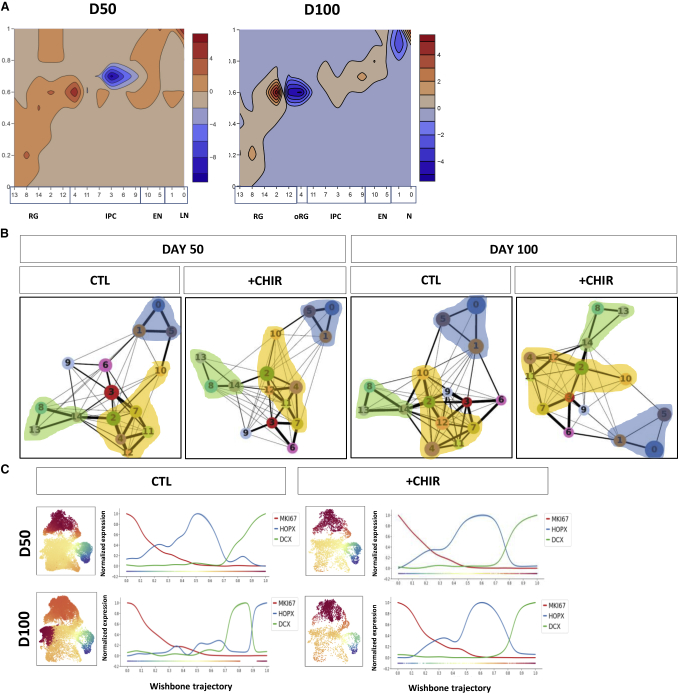
The regulation of the proliferation and polarity of neural progenitors is crucial for the development of the brain cortex. Animal studies have implicated glycogen synthase kinase 3 (GSK3) as a pivotal regulator of both proliferation and polarity, yet the functional relevance of its signaling for the unique features of human corticogenesis remains to be elucidated. We harnessed human cortical brain organoids to probe the longitudinal impact of GSK3 inhibition through multiple developmental stages. Chronic GSK3 inhibition increased the proliferation of neural progenitors and caused massive derangement of cortical tissue architecture. Single-cell transcriptome profiling revealed a direct impact on early neurogenesis and uncovered a selective role of GSK3 in the regulation of glutamatergic lineages and outer radial glia output. Our dissection of the GSK3-dependent transcriptional network in human corticogenesis underscores the robustness of the programs determining neuronal identity independent of tissue architecture.

Keywords: GSK3; corticogenesis; human brain organoids; outer radial glia; single cell transcriptomics.


Figures

None
Graphical abstract
Figure 1
Figure 1
Morphogenetic Alterations Caused by Chronic GSK3 Inhibition (A) Representative captions of cortical organoids at day 18, stained with H&E (magnifications: upper, 10×; lower, 63×). Scale bars, 200 and 10 μm, respectively. (B) Representative images from day 18 organoids immunostained with anti-PAX6 (red), anti-KI67 (green), and DAPI (blue), wide-field fluorescence images. Scale bar, 50 μm. (C–E) Representative images from day 50 organoids immunostained with: (C) anti-PAX6 (red), anti-Nestin (green), and DAPI (blue), (D) anti-DCX (white), anti-KI67 (green), and DAPI (blue), and (E) anti-TBR1 (yellow) and DAPI (blue). Scale bars, 50 μm. (F and G) Quantification of the proportion of PAX6+ nuclei relative to total nuclei (DAPI) at (F) day 18 and (G) day 50 of differentiation. (H and I) Quantification of the proportion of KI67+ nuclei relative to total nuclei (DAPI) at (H) day 18 and (I) day 50 of differentiation. (J) Quantification of the proportion of TBR1+ nuclei relative to total nuclei (DAPI) in day 50 organoids. All quantifications were performed in five organoids per line, three independent hPSC lines (N = 15, n = 3), unpaired t test; p < 0.05, ∗∗p < 0.01, ∗∗∗p < 0.001.
Figure 2
Figure 2
GSK3 Inhibition Disrupts Lumen Organization and Progenitor Proliferation Rate (A) Experimental design: hPSCs differentiated following two parallel protocols, in 3D (up) cortical organoids or 2D (down) dual-smad inhibition. In both cases, parallel rounds were either exposed or not to GSK3 inhibitor CHI99021 (1 μM) starting from day 0 until the indicated sample collection time point. (B) Representative captions from immunostaining performed for anti-Pals1(green)/Hoechst(blue), wide-field fluorescence images acquisition, 20×. Scale bar, 50 μm (zoom panel, 10 μm). (C) Bar plots represent the average lumen number ± SD of five independent images for lines/conditions. (D) Lumen area quantification was performed by CellProfiler software; unpaired t test; ∗∗p < 0.01, ∗∗∗p < 0.001, ∗∗∗∗p < 0.0001. (E) Cell proliferation rate was estimated by CellTiter-Glo luminescence assay, with measurements every 24 h for 96 h in triplicate, three independent hPSC lines (n = 3). (F) Representative bright-field captions of day 40 organoids. Scale bar, 500 μm. (G) Growth curve performed in organoids differentiated for 40 days. Bright-field captions were taken at days 5, 9, 14, 20, 24, 30, 35, and 40. Points represent the average of 4 organoids per line. Size quantifications were performed with a custom-made FIJI function. (H) Derivative of the growth-rate delta between time points. The delta was computed on the average of untreated or treated samples. SD was calculated as a cumulative SD across all replicates and samples from each condition of three independent hPSC lines (n), four organoids measured per line/time point (N) (N = 72, n = 3), unpaired t test; ∗∗p < 0.01, ∗∗∗∗p < 0.0001. (I) Representative images from day 50 organoids stained with CellTox green as a marker of cytotoxicity after 72 h of growth factor starvation (depletion B27 and growth factors). Scale bar, 200 μm. (J) Quantification of CellTox fluorescence at 0, 24, 48, and 72 h after growth factor starvation.
Figure 3
Figure 3
Impact of GSK3 Inhibition on the Transcriptional Landscape (A) Principal component analysis performed on the whole transcriptome of untreated and CHIR-treated brain organoids at three stages of development: days 18, 50, and 100. (B–D) Volcano plots illustrating the differential expression analysis for CHIR treatment at day 18 (B), day 50 (C), and day 100 (D). Results are reported for the pool of tested genes as –log10 false discovery rate (FDR) and log2 fold change (FC). Genes identified as significantly modulated (FDR < 5% and absolute log2FC > 1) are shown in green, while those respecting only the FDR threshold are depicted in blue and not significant genes (FDR > 5%) in gray. Gene symbols highlight the top 10 upregulated and downregulated genes (ranked by fold change) in each stage. (E) Venn diagram depicting the overlap of modulated genes across developmental stages. (F and G) Scatterplots representing the relationship of the fold change induced by GSK3 inhibition at day 50 on the x axis and day 18 on the y axis (F) or day 50 on the x axis and day 100 on the y axis (G), for the subset of genes tested in both conditions. DEGs shared between the two examined conditions are reported in yellow, while DEGs specific for days 18, 50, or 100 are in green, blue, or violet, respectively. Correlation coefficient calculated according the Spearman metrics––0.45 in (F) and 0.62 in (G). (H–J) Gene expression profiles for selected gene sets significantly associated with CHIR treatment by GSEA: (H) day 18; (I) day 50; and (J) day 100. Expression levels (as Z score) for the top 10 ranking genes in the leading edge are visualized for each gene set. All analyses were done in three independent hPSC lines/time point (N = 18, n = 3).
Figure 4
Figure 4
Cortical Organoids Recapitulate the Main Features of Cortical Development (A) Louvain clusters in UMAP plot colored by cluster identity; lines depict population areas defined by contrast with markers obtained from human fetal brain dataset (radial glia, 8, 13, and 14; intermediate progenitor cells, 2, 7, and 12; outer radial glia, 4; early neurons, 5 and 10; neurons, 0 and 1; choroid 11). (B) UMAP plots. For each sub-panel, cells (represented as dots) are colored according to the expression levels of representative cell-type markers: STMN4, GNG3, DCX, neurons; HOPX, PTPRZ1, FAM107A, outer radial glia; DLL1, DLL3, ROBO3, early neurons; SMOC1, IFITM3, HES1, intermediate progenitors; AURKA, UBEC2C, TACC3, proliferating progenitors; CXCL14, PLS3, TTR, choroid. (C and D) Diffusion map representing the developmental trajectory of the system. Cells (dots) are colored according to cluster identity (C) and to pseudotime trajectory (D), from origin in black to terminal state in light yellow according to wishbone algorithm. (E) Visualization of the expression levels of representative genes along pseudotime: CDK1 and MKI67, proliferating progenitors; DCX and STMN2, neurons; HOPX, outer radial glia; SMOC1, intermediate progenitors. Analyses done in 33,293 cells from 6 hPSC lines from day 50 and 5 hPSC lines from day 100.
Figure 5
Figure 5
Effects of GSK3 Inhibition at a Single-Cell Level in Day 50 and 100 Cortical Organoids (A–H) Visualization of normalized expression levels for genes identifying specific populations either in UMAP divided by CHIR-treated and control samples (A, C, E, and G). Sub-sampled cluster-specific expression levels (violin plots), Fisher test; ∗∗∗p < 0.001, ∗∗p < 0.01, p < 0.05. FQ, normalized cell frequencies of cells expressing detectable levels/total population (bar plots) (B, D, F, and H). The following genes are examined: (A and B) CXCL14 in UMAP and CXCL14, PCP4, TDP52L1, EMX2 in violin plots on cluster 11 for choroid population; (C and D) NEUROD2 in UMAP and NEUROD2, NEUROD1, NEUROG2, and NEUROD6 on clusters 0, 1, and 5 for neuronal markers; (E and F) HOPX in UMAP and HOPX, TNC, FAM107A, and PTPRZ1 on cluster 4 for oRG markers; (G and H) FOXG1 in UMAP and FOXG1 (total) and BCL11B, RBFOX3, and DCX on clusters 0, 1, and 5 for dorsal telencephalon markers. Sub-sampling has been applied in order to randomly compare an equal number of cells for each category. (I) Representative wide-field fluorescence images from day 100 organoids immunostained with anti-CTIP2 (red), anti-HOPX (gray), and DAPI (blue). Scale bar, 20 μm. (J) Semiquantitative estimation of HOPX positive cells/DAPI area. Quantification corresponds to three organoids per line, three independent hPSC lines. Analyses done in 33,293 cells from 6 hPSC lines from day 50 and 5 hPSC lines from day 100.
Figure 6
Figure 6
Effects of GSK3 Inhibition at a Single-Cell Level in Day 50 and Day 100 Cortical Organoids (A) Contour plot representing the difference in frequency distribution in clusters and pseudotime intervals of treated versus untreated cells at days 50 and 100. Red depicts values higher in CHIR-treated cells, while blue depicts values higher in CTL-treated cells. (B) Partition-based graph abstraction analysis applied stage- and treatment-wise on the 15 clusters identified on the complete dataset. Circle diameter represents the fraction of cells assigned to each cluster; edge thickness visualizes the strength of connections across cells of the related clusters. Shadows highlight areas: progenitors (green), neurons (blue), and intermediate progenitors (yellow). (C) Over-imposition of pseudotime analyses performed separately for each experimental condition as a color scale on a UMAP calculated on the complete system. Blue (origin) and dark red (terminal state) according to wishbone trajectories. Visualization of the expression levels of representative genes along the condition-specific pseudotime. Analyses done in 33,293 cells from 6 hPSC lines from day 50 and 5 hPSC lines from day 100.

References

    1. Aberle H., Bauer A., Stappert J., Kispert A., Kemler R. β-Catenin is a target for the ubiquitin-proteasome pathway. EMBO J. 1997;16:3797–3804. - PMC - PubMed
    1. Amiri A., Coppola G., Scuderi S., Wu F., Roychowdhury T., Liu F., Pochareddy S., Shin Y., Safi A., Song L. Transcriptome and epigenome landscape of human cortical development modeled in organoids. Science. 2018;362:eaat6720. - PMC - PubMed
    1. Beattie R., Postiglione M.P., Burnett L.E., Laukoter S., Streicher C., Pauler F.M., Xiao G., Klezovitch O., Vasioukhin V., Ghashghaei T.H. Mosaic analysis with double markers reveals distinct sequential functions of Lgl1 in neural stem cells. Neuron. 2017;94:517–533.e3. - PubMed
    1. Bershteyn M., Nowakowski T.J., Pollen A.A., Di Lullo E., Nene A., Wynshaw-Boris A., Kriegstein A.R. Human iPSC-derived cerebral organoids model cellular features of lissencephaly and reveal prolonged mitosis of outer radial glia. Cell Stem Cell. 2017;20:435–449.e4. - PMC - PubMed
    1. Betizeau M., Cortay V., Patti D., Pfister S., Gautier E., Bellemin-Ménard A., Afanassieff M., Huissoud C., Douglas R.J., Kennedy H. Precursor diversity and complexity of lineage relationships in the outer subventricular zone of the primate. Neuron. 2013;80:442–457. - PubMed

Publication types

Substances