Review
. 2020 Jul;13(7):1577-1590.
doi: 10.1016/j.jcmg.2019.09.006. Epub 2019 Oct 11.

Cardiovascular Imaging Techniques to Assess Microvascular Dysfunction

Affiliations
Review

Cardiovascular Imaging Techniques to Assess Microvascular Dysfunction

Roshin C Mathew et al. JACC Cardiovasc Imaging. 2020 Jul.

Abstract

The understanding of microvascular dysfunction without evidence of epicardial coronary artery disease pales in comparison with that of obstructive epicardial coronary artery disease. A primary limitation in the past had been the lack of development of noninvasive methods of detecting and quantifying microvascular dysfunction. This limitation has particularly affected the ability to study the pathophysiology, morbidity, and treatment of this disease. More recently, almost all of the noninvasive cardiac imaging modalities have been used to quantify blood flow and advance understanding of microvascular dysfunction.

Keywords: cardiac magnetic resonance; computed tomography; echocardiography; microvascular dysfunction; positron emission tomography; quantitative perfusion.


Figures

Figure 1:
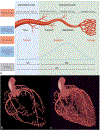
Figure 1:. Coronary circulation schematic
Components of the coronary circulation (a). Schematic of the macrocirculation (b) and microcirculation(c). FFR-fractional flow reserve, IMR- index of microvasculatory resistance, CFR-coronary flow reserve. (Permission obtained and adapted from De Bruyne, B et al. Microvascular (Dys)Function and Clinical Outcome in Stable Coronary Disease J Am Coll Cardiol. 2016; 67(10):1170–1172. and Taqueti VR, et al. Coronary Microvascular Disease Pathogenic Mechanisms and Therapeutic Options: JACC State-of-the-Art Review. J Am Coll Cardiol. 2018 Nov 27;72(21):2625–2641.)
Figure 2:
Figure 2:. Time Intensity Curves
Schematic of time intensity curves for the arterial input function (AIF) and the tissue function (TF) in a normal coronary segment and an abnormal coronary segment (a). CMR obtained stress AIF and TF signal intensity curves (b). PET stress/rest perfusion imaging with resulting AIF and myocardial time intensity curves (c). (Permission obtained and adapted from Patel, AR et al. Assessment of advanced coronary artery disease: advantages of quantitative cardiac magnetic resonance perfusion analysis. J Am Coll Cardiol. 2010; 56(7):561–9.)
Figure 3:
Figure 3:. Echocardiography derived coronary flow volume reserve and computed tomography of derived coronary luminal volume to myocardial mass
Using transthoracic doppler echocardiography to obtain mean diastolic velocities at rest and stress allows for the derivation of coronary flow volume reserve (a). Computational modeling allows for calculation of luminal volume to myocardial mass (V/M) ratio (b). Example of V/M ratio and fractional flow reserve in 2 patients with non-obstructive CAD (c). The patient with the reduced FFR has a corresponding reduced V/M ratio. CFVR-coronary flow volume reserve, V-luminal volume, M-myocardial mass, FFR-fractional flow reserve. (Permission obtained from Kakuta, K et al. Comparison of Coronary Flow Velocity Reserve Measurement by Transthoracic Doppler Echocardiography With 320-Row Multidetector Computed Tomographic Coronary Angiography in the Detection of In-Stent Restenosis in the Three Major Coronary Arteries. Am J Cardiol. 2012;110(1):13–20. and Taylor CA, et al. Effect of the ratio of coronary arterial lumen volume to left ventricle myocardial mass derived from coronary CT angiography on fractional flow reserve. J Cardiovasc Comput Tomogr. 2017; 11(6):429–436.)
Central Illustration:
Central Illustration:. Abnormal MPR in non-obstructive coronary artery disease
PET quantification of MBF shows reduced MPR of 1.6 in this 48 year old female with non-obstructive CAD (a). Rest and stress CMR derived segmental quantification of myocardial blood flow with a global MPR of 2.1 in a 59 year old male with non-obstructive CAD. LAD-left anterior descending artery, LCX-left circumflex artery, RCA-right coronary artery, TOT-total, MC-motion corrected, Str-Stress, Rst-Rest (b).

References

    1. Fihn SD, Blankenship JC, Alexander KP, et al. 2014 ACC/AHA/AATS/PCNA/SCAI/STS focused update of the guideline for the diagnosis and management of patients with stable ischemic heart disease. J Am Coll Cardiol 2014;64:1929–49. - PubMed
    1. O’Gara PT, Kushner FG, Ascheim DD, et al. 2013 ACCF/AHA guideline for the management of ST-elevation myocardial infarction. J Am Coll Cardiol 2013;61:e78–140. - PubMed
    1. Amsterdam EA, Wenger NK, Brindis RG, et al. 2014 AHA/ACC guideline for the management of patients with non–ST-elevation acute coronary syndromes. J Am Coll Cardiol 2014;64:e139–228. - PubMed
    1. Pijls NHJ, Fearon WF, Tonino PAL, et al. Fractional flow reserve versus angiography for guiding percutaneous coronary intervention in patients with multivessel coronary artery disease: 2-year follow-up of the FAME study. J Am Coll Cardiol 2010;56:177–84 - PubMed
    1. De Bruyne B, Pijls NHJ, Kalesan B, et al. Fractional flow reserve guided PCI versus medical therapy in stable coronary disease. N Engl J Med 2012;367:991–1001. - PubMed

Publication types