. 2020 Mar;22(3):490-499.
doi: 10.1038/s41436-019-0672-1. Epub 2019 Oct 14.

Diagnostic utility of transcriptome sequencing for rare Mendelian diseases

Affiliations

Diagnostic utility of transcriptome sequencing for rare Mendelian diseases

Hane Lee et al. Genet Med. 2020 Mar.

Abstract

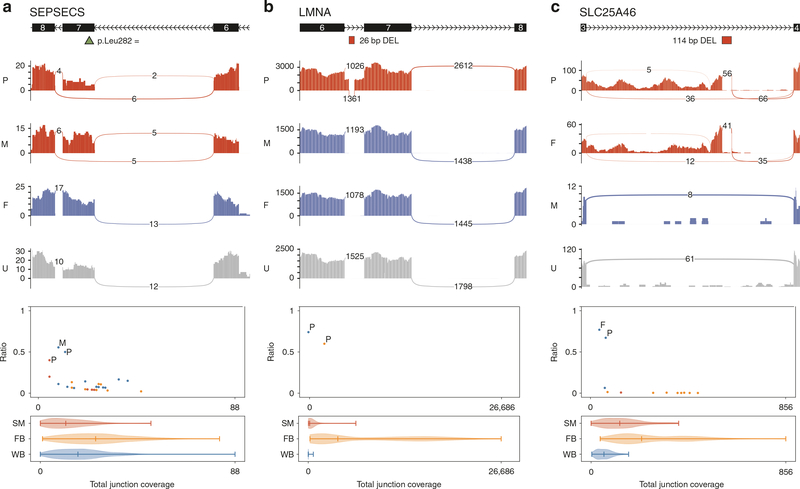
Purpose: We investigated the value of transcriptome sequencing (RNAseq) in ascertaining the consequence of DNA variants on RNA transcripts to improve the diagnostic rate from exome or genome sequencing for undiagnosed Mendelian diseases spanning a wide spectrum of clinical indications.

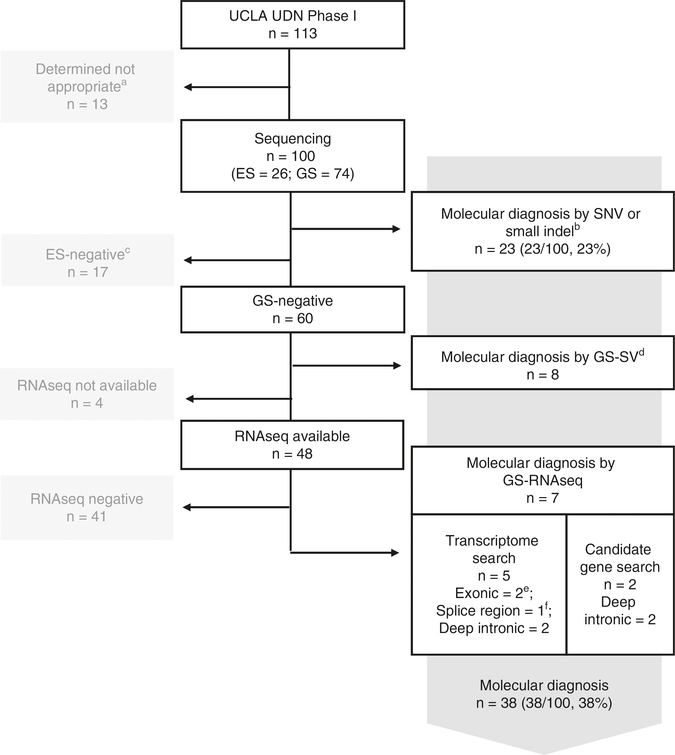
Methods: From 234 subjects referred to the Undiagnosed Diseases Network, University of California-Los Angeles clinical site between July 2014 and August 2018, 113 were enrolled for high likelihood of having rare undiagnosed, suspected genetic conditions despite thorough prior clinical evaluation. Exome or genome sequencing and RNAseq were performed, and RNAseq data was integrated with genome sequencing data for DNA variant interpretation genome-wide.

Results: The molecular diagnostic rate by exome or genome sequencing was 31%. Integration of RNAseq with genome sequencing resulted in an additional seven cases with clear diagnosis of a known genetic disease. Thus, the overall molecular diagnostic rate was 38%, and 18% of all genetic diagnoses returned required RNAseq to determine variant causality.

Conclusion: In this rare disease cohort with a wide spectrum of undiagnosed, suspected genetic conditions, RNAseq analysis increased the molecular diagnostic rate above that possible with genome sequencing analysis alone even without availability of the most appropriate tissue type to assess.

Keywords: exome sequencing; genome sequencing; molecular diagnosis; transcriptome sequencing; undiagnosed rare Mendelian diseases.


Conflict of interest statement

DISCLOSURE

The authors declare no conflicts of interest.

Figures

Fig. 1
Fig. 1. Molecular diagnostic rate in the 113 Undiagnosed Diseases Network-University of California–Los Angeles (UDN-UCLA) clinical site cohort enrolled between July 2014 and August 2018.
aDetermined not appropriate for UDN genetic study after clinical evaluation. bSingle-nucleotide variant (SNV)/small indel variants within coding exons (includes essential splice site (+/−2 bp) variants) that are predicted to be nonsynonymous or loss-of-function: of the 23 probands, 9 were diagnosed with exome sequencing (35%; includes 1 proband who was diagnosed with a recurrent deep intronic pathogenic variant in COL6A1) and 14 with genome sequencing (19%). cExome-negative cases were removed from further analysis for this study due to the lack of DNA sequencing data in the noncoding genomic region. dSV: Structural variants affecting coding exons (includes mixed triploidy and repeat expansion). eVariants that are synonymous or in untranslated region (UTR). fVariants within +/−3 to +/−10 bp from the exon-intron boundaries. ES exome sequencing, GS genome sequencing.
Fig. 2
Fig. 2. Sashimi plots and noncanonical junction coverage ratio plots.
a SEPSECS exon skipping. b LMNA intron retention. c SLC25A46 intron retention and intronic pseudoexon inclusion. For the sashimi plots, the exon coverage and the splice junctions for the family members carrying the genomic variant are in red, for the family members not carrying the genomic variant are in blue, and for the unrelated individuals not carrying the genomic variant are in gray. Canonical exons and the genomic variants are shown above the respective sashimi plots with the exon number and the transcription direction indicated. For the noncanonical junction coverage ratio plots, the x-axis is the total number of reads at the junction (sum of canonical and noncanonical junctions) and the y-axis is the noncanonical junction coverage ratio (noncanonical junction coverage/total junction coverage). Family members carrying the noncanonical junctions are noted by P (proband), M (mother), or F (father) in respective color of the tissues observed and unrelated individuals carrying the noncanonical junctions are noted in dots in respective color of the tissues observed (blue: blood; yellow: fibroblast; red: muscle). Below each plot is a violin plot showing the coverage distribution from all samples at each junction for different tissues (FB fibroblast, SM muscle, WB blood).

References

    1. Yang Y, Muzny DM, Xia F, et al. Molecular findings among patients referred for clinical whole-exome sequencing. JAMA. 2014;312: 1870–1879. - PMC - PubMed
    1. Lee H, Deignan JL, Dorrani N, et al. Clinical exome sequencing for genetic identification of rare Mendelian disorders. JAMA. 2014;312:1880–1887. - PMC - PubMed
    1. Skinner D, Raspberry KA, King M. The nuanced negative: meanings of a negative diagnostic result in clinical exome sequencing. Sociol Health Illn. 2016;38:1303–1317. - PMC - PubMed
    1. Biesecker LG, Shianna KV, Mullikin JC. Exome sequencing: the expert view. Genome Biol. 2011;12:128. - PMC - PubMed
    1. Lionel AC, Costain G, Monfared N, et al. Improved diagnostic yield compared with targeted gene sequencing panels suggests a role for whole-genome sequencing as a first-tier genetic test. Genet Med. 2018;20:435–443. - PMC - PubMed

Publication types