. 2020 Jan;41(1):47-55.
doi: 10.1038/s41401-019-0308-7. Epub 2019 Oct 13.

Shikonin attenuates hyperhomocysteinemia-induced CD4+ T cell inflammatory activation and atherosclerosis in ApoE-/- mice by metabolic suppression

Affiliations

Shikonin attenuates hyperhomocysteinemia-induced CD4+ T cell inflammatory activation and atherosclerosis in ApoE-/- mice by metabolic suppression

Si-Lin Lü et al. Acta Pharmacol Sin. 2020 Jan.

Abstract

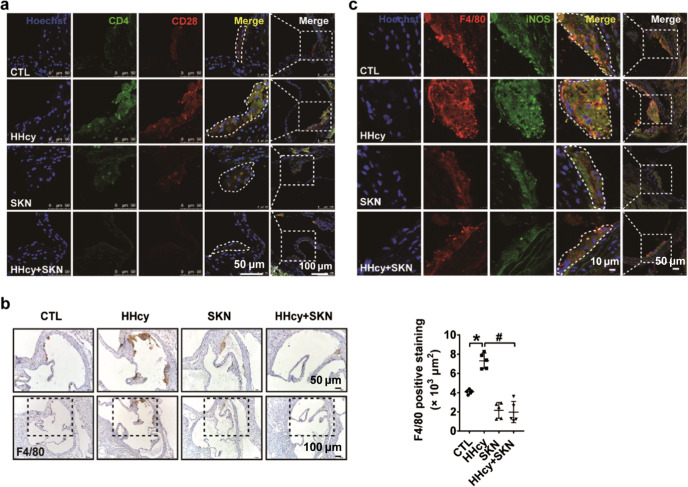
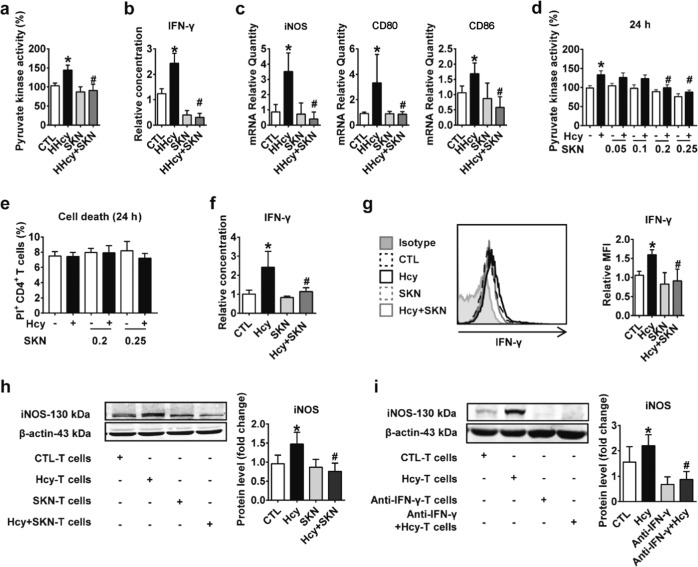
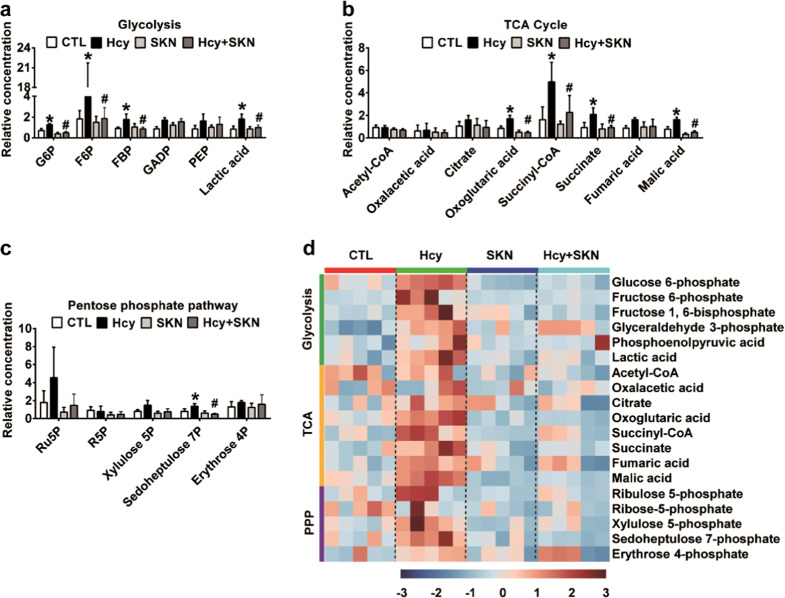
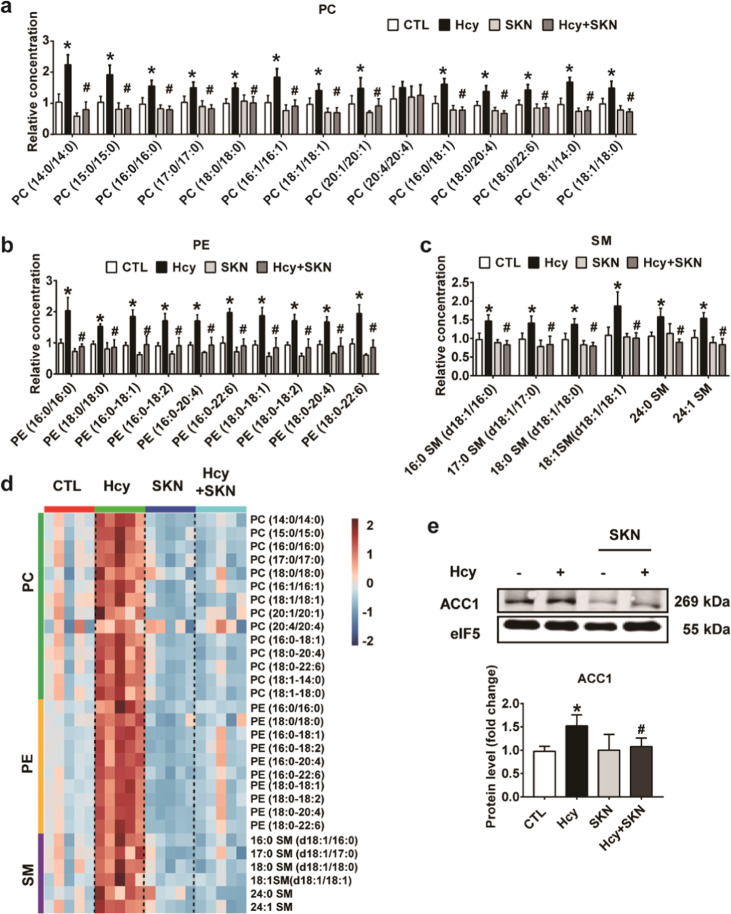
T cell metabolic activation plays a crucial role in inflammation of atherosclerosis. Shikonin (SKN), a natural naphthoquinone with anti-inflammatory activity, has shown to exert cardioprotective effects, but the effect of SKN on atherosclerosis is unclear. In addition, SKN was found to inhibit glycolysis via targeting pyruvate kinase muscle isozyme 2 (PKM2). In the present study, we investigated the effects of SKN on hyperhomocysteinemia (HHcy)-accelerated atherosclerosis and T cell inflammatory activation in ApoE-/- mice and the metabolic mechanisms in this process. Drinking water supplemented with Hcy (1.8 g/L) was administered to ApoE-/- mice for 2 weeks and the mice were injected with SKN (1.2 mg/kg, i.p.) or vehicle every 3 days. We showed that SKN treatment markedly attenuated HHcy-accelerated atherosclerosis in ApoE-/- mice and significantly decreased inflammatory activated CD4+ T cells and proinflammatory macrophages in plaques. In splenic CD4+ T cells isolated from HHcy-ApoE-/- mice, SKN treatment significantly inhibited HHcy-stimulated PKM2 activity, interferon-γ secretion and the capacity of these T cells to promote macrophage proinflammatory polarization. SKN treatment significantly inhibited HHcy-stimulated CD4+ T cell glycolysis and oxidative phosphorylation. Metabolic profiling analysis of CD4+ T cells revealed that Hcy administration significantly increased various glucose metabolites as well as lipids and acetyl-CoA carboxylase 1, which were reversed by SKN treatment. In conclusion, our results suggest that SKN is effective to ameliorate atherosclerosis in HHcy-ApoE-/- mice and this is at least partly associated with the inhibition of SKN on CD4+ T cell inflammatory activation via PKM2-dependent metabolic suppression.

Keywords: ApoE−/− mice; CD4+ T cell; atherosclerosis; hyperhomocysteinemia; metabolic suppression; naphthoquinone; shikonin.


Conflict of interest statement

The authors declare no competing interests.

Figures

Fig. 1
Fig. 1
SKN attenuates the HHcy-induced CD4+ T cell and macrophage inflammatory response in the atherosclerotic lesions of ApoE−/− mice. HHcy was induced in ApoE−/− mice by supplementing drinking water with Hcy (1.8 g/L) for 2 weeks. SKN (1.2 mg/kg) or solvent was intraperitoneally injected every 3 days. a Immunofluorescence staining for CD4 and CD28 in the plaques of aortic roots (n = 5 mice per group). b Macrophages (F4/80-positive) in the atherosclerotic plaques of aortic roots were detected by immunohistochemical staining. Quantification is shown in the right panel (n = 5 mice per group). c Immunofluorescence staining for F4/80 and iNOS in the plaques of aortic roots (n = 5 mice per group). The data are shown as mean ± SD. One-way ANOVA followed by Tukey’s test was used for multiple comparisons. *P < 0.05 compared with the CTL group; #P < 0.05 compared with the HHcy group
Fig. 2
Fig. 2
SKN inhibits HHcy-induced IFN-γ secretion in CD4+ T cells and subsequently reduces T cell-mediated proinflammatory macrophage polarization. a Splenic CD4+ T cells isolated from CTL and HHcy mice treated with or without SKN (1.2 mg/kg) were stimulated with anti-CD3 (1 μg/mL) for 24 h ex vivo. PKM2 activity was measured (n = 6 mice per group). b IFN-γ in the supernatant of splenic CD4+ T cells treated as in a was detected by ELISA (n = 7 mice per group). c Splenic CD4+ T cells treated as in a were cocultured with normal macrophages in fresh medium for 12 h. The mRNA levels of iNOS, CD80, and CD86 were detected by RT-PCR (n = 7 mice per group). dh Splenic CD4+ T cells were first treated with SKN (0.05–0.25 μM) for 30 min and then stimulated with or without Hcy (100 μM) for 24 h. PKM2 activity is shown in d (n = 5). Cell death was detected by PI staining (e) (n = 5). IFN-γ secretion was detected by ELISA (f) (n = 9) and FACS (g) (n = 5). After treatment with SKN (0.2 μM) and Hcy (100 μM) for 24 h, these splenic CD4+ T cells were then cocultured with normal macrophages in fresh medium for another 24 h. The protein level of iNOS in macrophages was detected by Western blotting (h) (n = 5). i Splenic CD4+ T cells were simulated with Hcy (100 μM) for 24 h and then cocultured with normal macrophages in fresh medium in the presence of IFN-γ-neutralizing antibodies for another 24 h. The protein level of iNOS in macrophages was detected by Western blotting (n = 5). The data are shown as mean ± SD. One-way ANOVA followed by Tukey’s test was used for multiple comparisons. *P < 0.05 compared with the CTL group; #P < 0.05 compared with the HHcy or Hcy group
Fig. 3
Fig. 3
SKN inhibits HHcy-induced metabolic reprogramming in CD4+ T cells. a, b Splenic CD4+ T cells isolated from CTL and HHcy mice treated with or without SKN (1.2 mg/kg) were stimulated with anti-CD3 (1 μg/mL) for 24 h ex vivo. ECAR and OCR were detected by extracellular flux analysis (n = 5 mice per group). Rot rotenone, Anti A antimycin A. c, d Splenic CD4+ T cells were treated with or without SKN (0.2 μM) for 30 min and then stimulated with or without Hcy (100 μM) for 24 h. ECAR and OCR were detected by extracellular flux analysis (n = 5). The data are shown as mean ± SD. One-way ANOVA followed by Tukey’s test was used for multiple comparisons. *P < 0.05 compared with the CTL group; #P < 0.05 compared with the HHcy or Hcy group
Fig. 4
Fig. 4
SKN inhibits Hcy-induced CD4+ T cell glucose metabolism. Splenic CD4+ T cells were treated with or without SKN (0.2 μM) for 30 min and then stimulated with or without Hcy (100 μM) in the presence of anti-CD3 (1 μg/mL) for 24 h, following which T cell lysates were extracted and analyzed using LC-MS/MS to determine the levels of cellular metabolites. Relative levels of glycolytic intermediates (a) and intermediates in the TCA cycle (b) and the pentose phosphate pathway (c) are shown. G6P glucose-6-phosphate, F6P fructose-6-phosphate, FBP fructose-1,6-bisphosphate, GADP glyceraldehyde-3-phosphate, PEP phosphoenolpyruvate, Ru5P ribulose-5-phosphate, R5P ribose-5-phosphate, Xylulose 5P xylulose-5-phosphate, Sedoheptulose 7P sedoheptulose-7-phosphate, Erythrose 4P erythrose-4-phosphate (n = 5). d Heat map showing relative levels of metabolites involved in glycolysis, the TCA cycle, and the pentose phosphate pathway (n = 5). The data are shown as mean ± SD. One-way ANOVA followed by Tukey’s test was used for multiple comparisons. *P < 0.05 compared with the CTL group; #P < 0.05 compared with the Hcy group
Fig. 5
Fig. 5
SKN inhibits the Hcy-induced activation of the glycolytic-lipogenic axis in CD4+ T cells. Splenic CD4+ T cells were treated with or without SKN (0.2 μM) for 30 min and then stimulated with or without Hcy (100 μM) in the presence of anti-CD3 (1 μg/mL) for 24 h, following which T cell lysates were extracted and analyzed for cellular lipids using LC-MS/MS. Relative levels of the phospholipids PC (a), PE (b), and SM (c) are shown (n = 5). d Heat map showing an overview of lipidomic alterations (n = 5). e The protein level of ACC1 was detected by western blotting (n = 7). The data are shown as mean ± SD. One-way ANOVA followed by Tukey’s test was used for multiple comparisons. *P < 0.05 compared with the CTL group; #P < 0.05 compared with the Hcy group
Fig. 6
Fig. 6
A working model by which SKN ameliorates atherosclerosis by inhibiting CD4+ T cell metabolic activation. Hcy enhances glucose metabolism and the glycolytic–lipogenic axis in CD4+ T cells to promote IFN-γ secretion, which promotes macrophage proinflammatory polarization and finally accelerates atherosclerosis. Inhibition of PKM2 by SKN prevents these effects

References

    1. Lozano R, Naghavi M, Foreman K, Lim S, Shibuya K, Aboyans V, et al. Global and regional mortality from 235 causes of death for 20 age groups in 1990 and 2010: a systematic analysis for the Global Burden of Disease Study 2010. Lancet. 2012;380:2095–128. doi: 10.1016/S0140-6736(12)61728-0. - DOI - PMC - PubMed
    1. McCully KS. Homocysteine and vascular disease. Nat Med. 1996;2:386–9. doi: 10.1038/nm0496-386. - DOI - PubMed
    1. Guthikonda S, Haynes WG. Homocysteine as a novel risk factor for atherosclerosis. Curr Opin Cardiol. 1999;14:283–91. doi: 10.1097/00001573-199907000-00002. - DOI - PubMed
    1. Deng J, Lu S, Liu H, Liu B, Jiang C, Xu Q, et al. Homocysteine activates B cells via regulating PKM2-dependent metabolic reprogramming. J Immunol. 2017;198:170–83. doi: 10.4049/jimmunol.1600613. - DOI - PMC - PubMed
    1. Ma K, Lv S, Liu B, Liu Z, Luo Y, Kong W, et al. CTLA4-IgG ameliorates homocysteine-accelerated atherosclerosis by inhibiting T-cell overactivation in apoE(-/-) mice. Cardiovasc Res. 2013;97:349–59. doi: 10.1093/cvr/cvs330. - DOI - PubMed

MeSH terms