. 2019 Sep 25:13:1020.
doi: 10.3389/fnins.2019.01020. eCollection 2019.

Stereological Analysis of Early Gene Expression Using Egr-1 Immunolabeling After Spreading Depression in the Rat Somatosensory Cortex

Affiliations

Stereological Analysis of Early Gene Expression Using Egr-1 Immunolabeling After Spreading Depression in the Rat Somatosensory Cortex

Marcia Consentino Kronka Sosthenes et al. Front Neurosci. .

Abstract

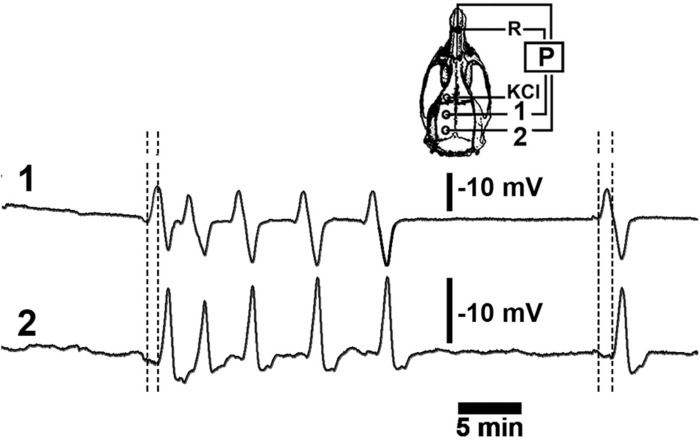
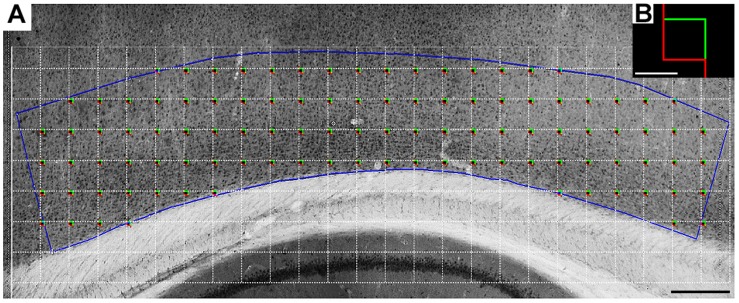
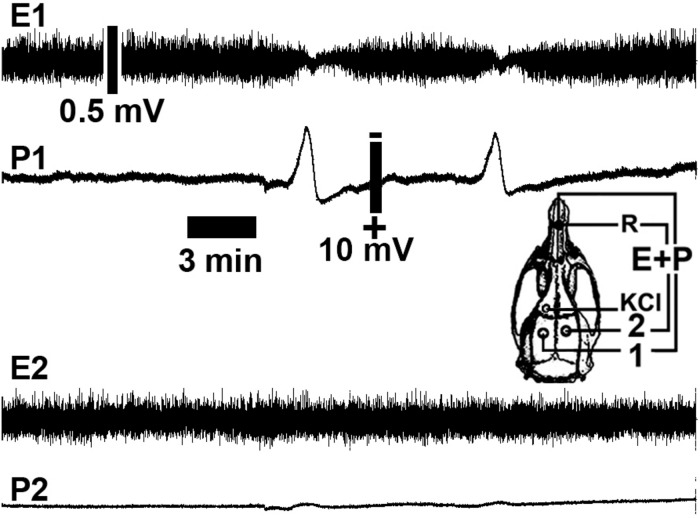
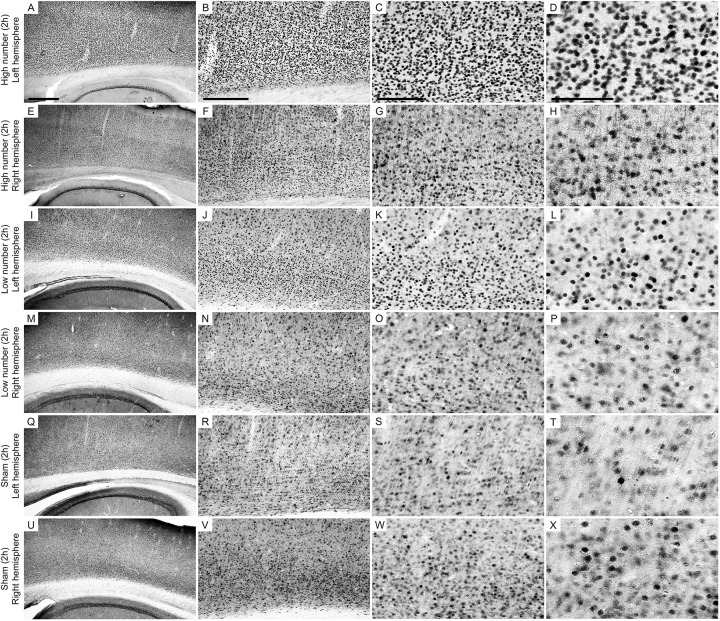
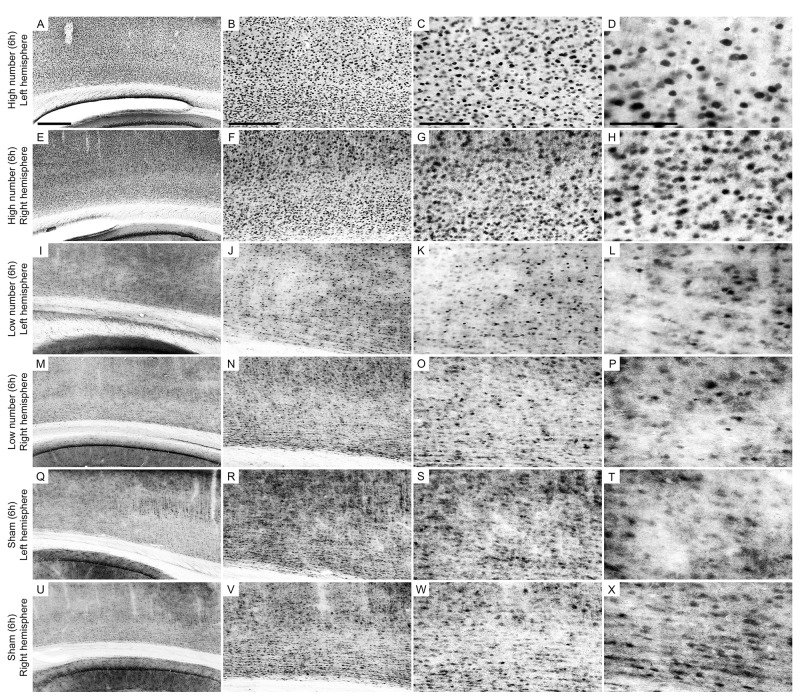
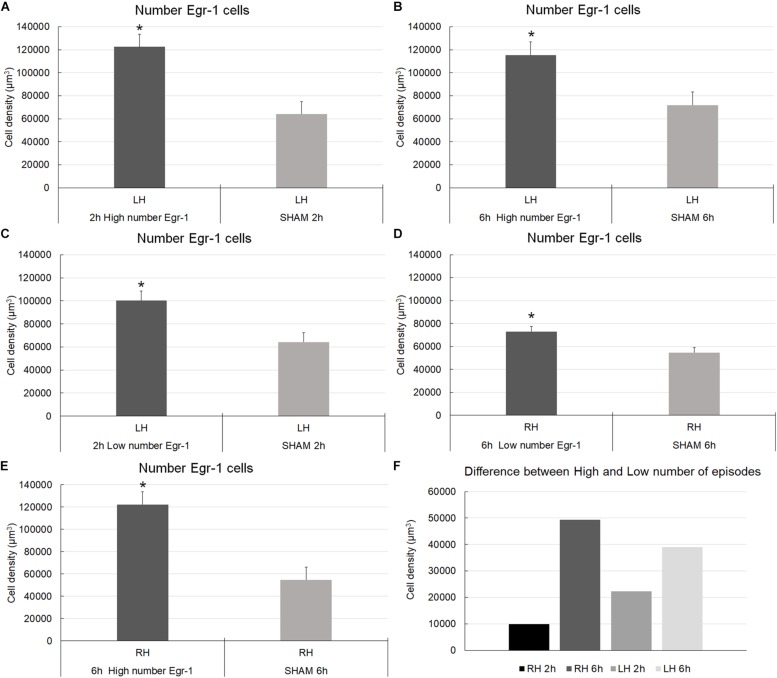
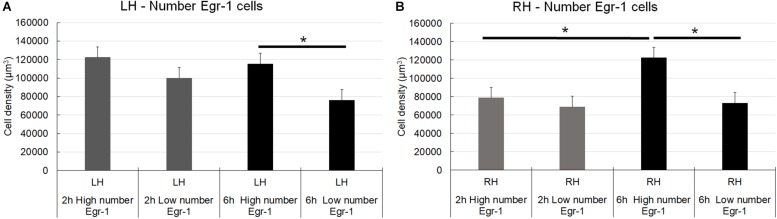
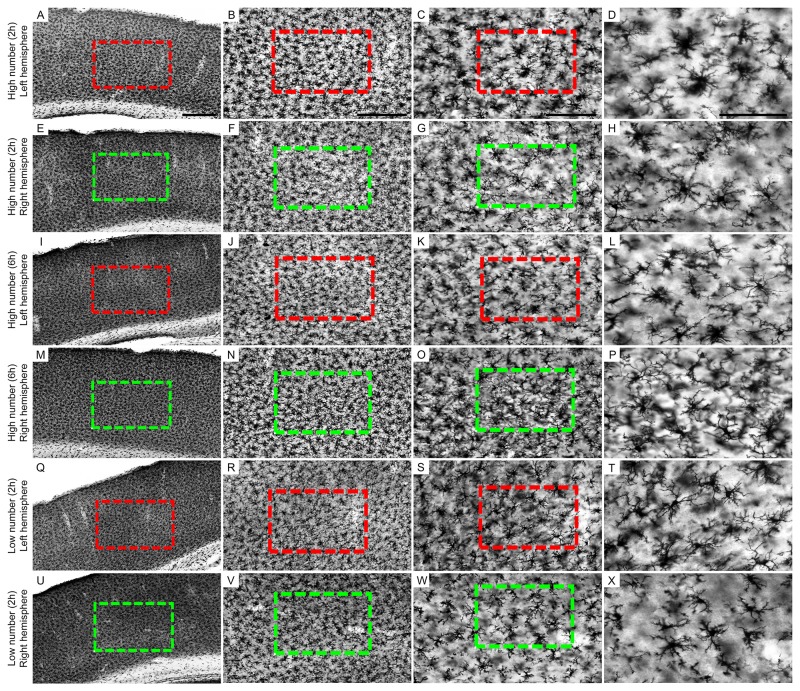
Early growth response-1 (Egr-1), defined as a zinc finger transcription factor, is an upstream master switch of the inflammatory response, and its expression can be used to investigate the spatial and temporal extent of inflammatory changes in the brain. Cortical spreading depression (CSD) is characterized as a slowly propagating (2-5 mm/min) depolarization wave through neurons and astrocytes in humans that contributes to migraines and possibly to other brain pathologies. In rodents, CSD can be induced experimentally, which involves unilateral depolarization that is associated with microglial and astrocyte responses. The impact of CSD on structures beyond the affected hemisphere has not been explored. Here, we used an optical fractionator method to investigate potential correlations between the number of and period of the eletrophysiologic record of CSD phenomena and Egr-1 expression in ipsilateral and contralateral hemispheres. CSD was elicited by the restricted application of a 2% KCl solution over the left premotor cortex. Electrophysiological events were recorded using a pair of Ag/AgCl agar-Ringer electrodes for 2 or 6 h. An optical fractionator was applied to count the Egr-1 positive cells. We found that CSD increased Egr-1 expression in a time- and event-dependent manner in the ipsilateral/left hemisphere. Although CSD did not cross the midline, multiple CSD inductions were associated with an increased number of Egr-1 positive cells in the contralateral/right hemisphere. Thus, repeated CSD waves may have far reaching effects that are more global than previously considered possible. The mechanism of contralateral expression is unknown, but we speculate that callosal projections from the depolarized hemisphere may be related to this phenomenon.

Keywords: Egr-1; contralateral hemisphere; cortical spreading depression; optical fractionator; somatosensorial cortex.


Figures

FIGURE 1
FIGURE 1
A representative recording of DC slow potential changes during cortical spreading depression (CSD). Six episodes of CSD were elicited by applying a cotton ball soaked with a 2% KCl solution on the frontal cortex over a 30-min period at the point marked “KCl” on the skull diagram. The left hemisphere (skull diagram) shows recording positions 1 and 2 on the parietal cortex as well as the position of the reference electrode (R) on the nasal bones. Vertical calibration bars equal to 10 mV for the P recordings. Horizontal bar equals 5-min.
FIGURE 2
FIGURE 2
A representative low-power photomicrograph of a rat Egr-1-immunolabeled section of the somatosensorial infragranular cortical layers. (A) Blue line contour shows the border of the region of interest in a sagittal section. The white grid indicates the intervals between the square red/green boxes (shown larger in panel B) and shows the systematic random sampling approach. The total number of counting boxes in each section was proportional to the area covered by the somatosensory cortex infragranular layers. The antero-posterior limits of the contour were drawn using lines orthogonal to the pia mater. These lines originated at the border of the underlying hippocampal pyramidal cell layer. Because the area and the volume inside the contours could change within and between experimental groups, we estimated and compared volumetric cell densities rather than the total number of cells. Scale bar, 300 μm (A), 20 μm (B).
FIGURE 3
FIGURE 3
Representative cortical spreading depression (CSD) and electrocorticogram recordings from a rat in a 6-h recording group showing a low number of CSD episodes (two CSD episodes). The spontaneous electrical activity (electrocorticogram; E) and the slow change in potential (P) of CSD were recorded at two points (point 1 in the left hemisphere and point 2 in the right hemisphere) on the rat cortical surface. The skull diagram shows recording points 1 and 2, the point on the ipsilateral hemisphere that was stimulated with KCl to elicit CSD (KCl), and the point over the nasal bones where the common reference electrode (R) was placed. Note that CSD was restricted to the stimulated (left) hemisphere. Calibration bars show the respective values.
FIGURE 4
FIGURE 4
Low-power and high-power photomicrographs of the infragranular somatosensorial (ss) cortical layers in the indicated 2 h recording groups. The sections that were immunolabeled with anti-Egr-1 antibody showed qualitative differences between the 2 h recording groups: high number of CSD episodes in the left/ipsilateral hemisphere (A–D); high number of CSD episodes in the right/contralateral hemisphere (E–H); low number of CSD episodes in the left/ipsilateral hemisphere (I–L); low number of CSD episodes in the right/contralateral hemisphere (M–P); sham left/ipsilateral hemisphere (Q–T); and sham right/contralateral hemisphere (U–X). Scale bars in panels (A,E,I,M,Q,U) = 500 μm; in panels (B,F,J,N,R,V) = 300 μm; in panels (C,G,K,O,S,W) = 150 μm; and in panels (D,H,L,P,T,X) = 100 μm.
FIGURE 5
FIGURE 5
Low-power and high-power photomicrographs of the infragranular somatosensorial (ss) cortical layers in the indicated 6 h recording groups. The sections that were immunolabeled with anti-Egr-1 antibody showed qualitative differences between the 6 h recording groups: high number of CSD episodes in the left/ipsilateral hemisphere (A–D); high number of CSD episodes in the right/contralateral hemisphere (E–H); low number of CSD episodes in the left/ipsilateral hemisphere (I–L); low number of CSD episodes in the right/contralateral hemisphere (M–P); sham left/ipsilateral hemisphere (Q–T); and sham right/contralateral hemisphere (U–X). Scale bars in panels (A,E,I,M,Q,U) = 500 μm; in panels (B,F,J,N,R,V) = 300 μm; in panels (C,G,K,O,S,W) = 150 μm; and in panels (D,H,L,P,T,X) = 100 μm.
FIGURE 6
FIGURE 6
Graphic representation of the density of Egr-1–positive cells in the somatosensorial cortex. The graphs show stereological estimates of Egr-1–positive cell density (μm3; mean) in the infragranular layers of the somatosensorial cortex according to the indicated recording time (2 or 6 h) and according to the number of episodes of cortical spreading depression (high number and low number). (A–E) () Statistically significant differences (parametric statistical analyses using t-tests – with samples with equal and unequal variances); (F) Differences in mean of stereological numerical estimates between the groups (higher number of CSD episodes minus who showed smaller number of episodes); overall significance level, 0.05; 2 and 6 h, 2 and 6 h of recording; high and low number, high and low number of CSD episodes; sham, zero episodes.
FIGURE 7
FIGURE 7
Graphic representation of the density of Egr-1–positive cells in the somatosensorial cortex. The graphs show stereological estimates of Egr-1–positive cell density (μm3; mean) in the infragranular layers of the somatosensorial cortex according to the indicated recording time (2 or 6 h) and according to the number of episodes of cortical spreading depression (high number and low number). (A) Left hemisphere; (B) Right hemisphere. Horizontal bars and () indicate statistically indicate statistically significant differences using two-way analysis of variance, Holm-Sidak method; overall significance level, 0.05; 2 and 6 h, 2 and 6 h of recording; high and low number, high and low number of CSD episodes; sham, zero episodes.
FIGURE 8
FIGURE 8
Low-power and high-power photomicrographs of the somatosensorial (ss) cortical layers in the indicated 6 and 2 h recording groups. The sections that were immunolabeled with anti-Iba-1 antibody showed qualitative differences between the 6 and 2 h recording groups: high number of CSD episodes (2-h recording) in the left/ipsilateral hemisphere (A–D); high number of CSD episodes (2-h recording) in the right/contralateral hemisphere (E–H); high number of CSD episodes (6-h recording) in the left/ipsilateral hemisphere (I–L); high number of CSD episodes (6-h recording) in the right/contralateral hemisphere (M-P); low number of CSD episodes (2-h recording) in the left/ipsilateral hemisphere (Q–T); low number of CSD episodes (2-h recording) in the right/contralateral hemisphere (U–X). Scale bars in panels (A,E,I,M,Q,U) = 500 μm; in panels (B,F,J,N,R,V) = 300 μm; in panels (C,G,K,O,S,W) = 150 μm; and in panels (D,H,L,P,T,X) = 100 μm.

Similar articles

Cited by

References

    1. Abadie-Guedes R., Santos S. D., Cahu T. B., Guedes R. C., de Souza Bezerra R. (2008). Dose-dependent effects of astaxanthin on cortical spreading depression in chronically ethanol-treated adult rats. Alcohol. Clin. Exp. Res. 32 1417–1421. 10.1111/j.1530-0277.2008.00710.x - DOI - PubMed
    1. Bento-Torres J., Sobral L. L., Reis R. R., de Oliveira R. B., Anthony D. C., Vasconcelos P. F., et al. (2017). Age and environment influences on mouse prion disease progression: behavioral changes and morphometry and stereology of hippocampal astrocytes. Oxid. Med. Cell Longev. 2017:4504925. 10.1155/2017/4504925 - DOI - PMC - PubMed
    1. Carvalho-Paulo D., de Morais Magalhaes N. G., de Almeida Miranda D., Diniz D. G., Henrique E. P., Moraes I. A. M., et al. (2017). Hippocampal astrocytes in migrating and wintering semipalmated sandpiper Calidris pusilla. Front. Neuroanat. 11:126. 10.3389/fnana.2017.00126 - DOI - PMC - PubMed
    1. Cho C., MacDonald R., Shang J., Cho M. J., Chalifour L. E., Paudel H. K. (2017). Early growth response-1-mediated down-regulation of drebrin correlates with loss of dendritic spines. J. Neurochem. 142 56–73. 10.1111/jnc.14031 - DOI - PubMed
    1. Cruz-Orive L. M. (1994). Toward a more objective biology. Neurobiol. Aging 15 377–378. discussion 379–380 10.1016/0197-4580(94)90039-6 - DOI - PubMed

LinkOut - more resources