. 2019 Sep 19:13:426.
doi: 10.3389/fncel.2019.00426. eCollection 2019.

Early-Stage Ocular Hypertension Alters Retinal Ganglion Cell Synaptic Transmission in the Visual Thalamus

Affiliations

Early-Stage Ocular Hypertension Alters Retinal Ganglion Cell Synaptic Transmission in the Visual Thalamus

Ashish Bhandari et al. Front Cell Neurosci. .

Abstract

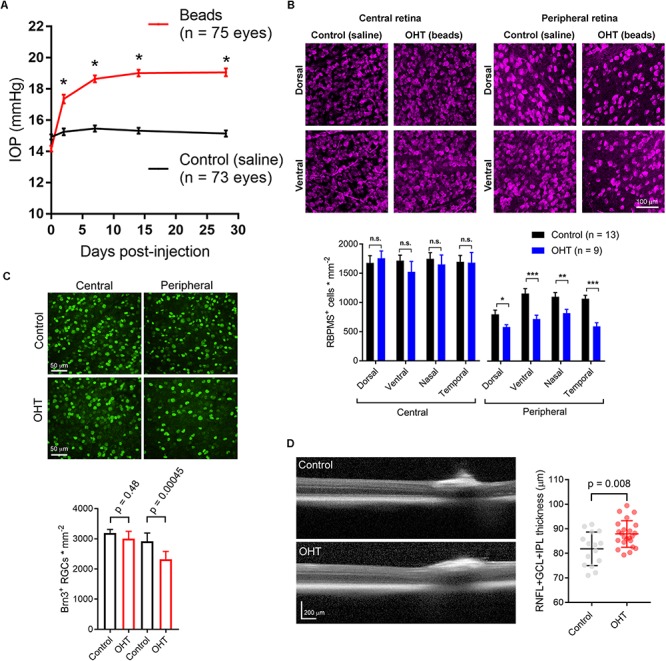
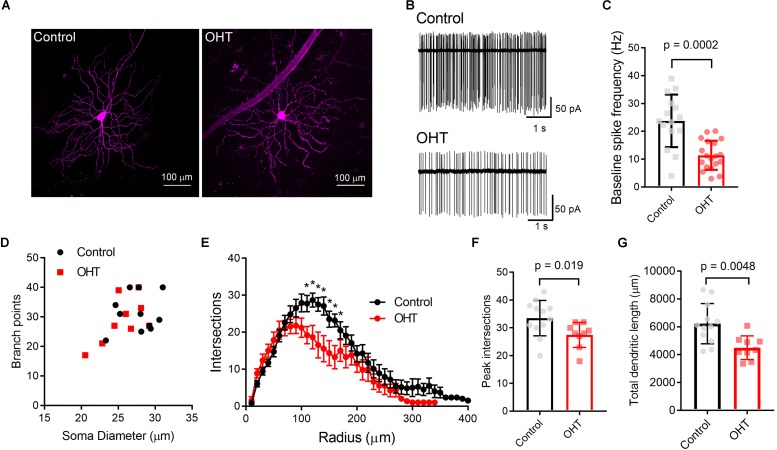
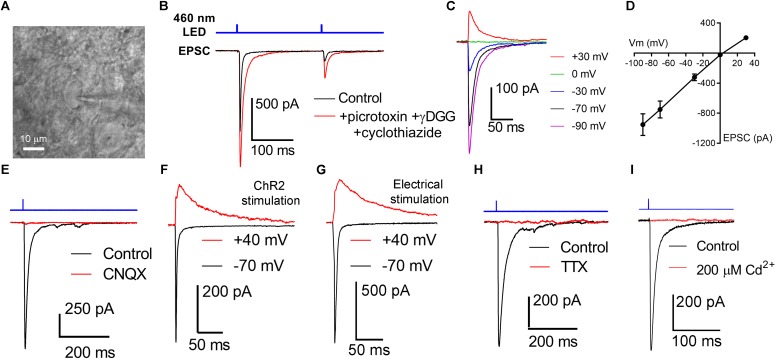
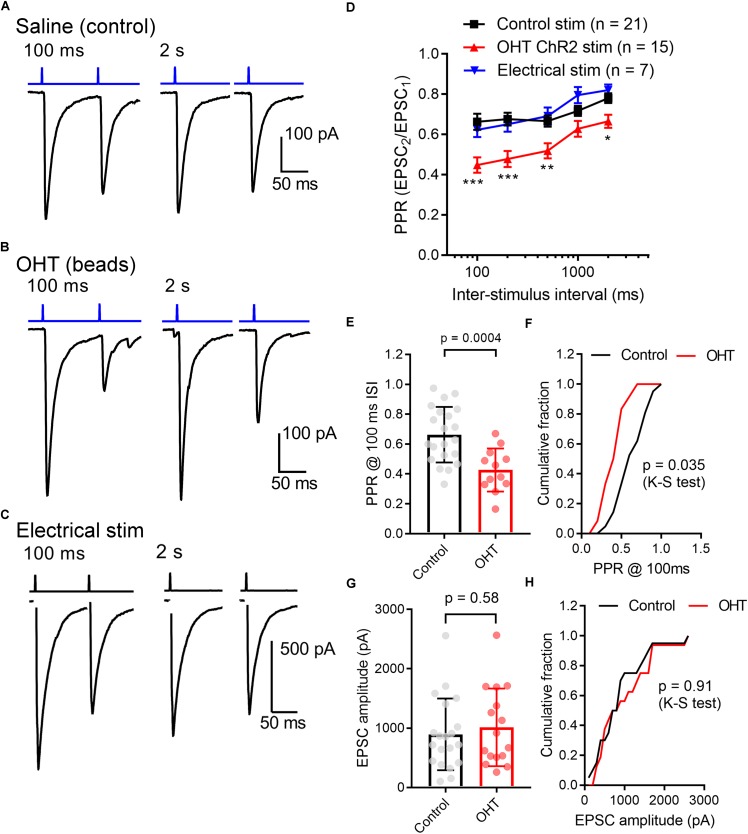
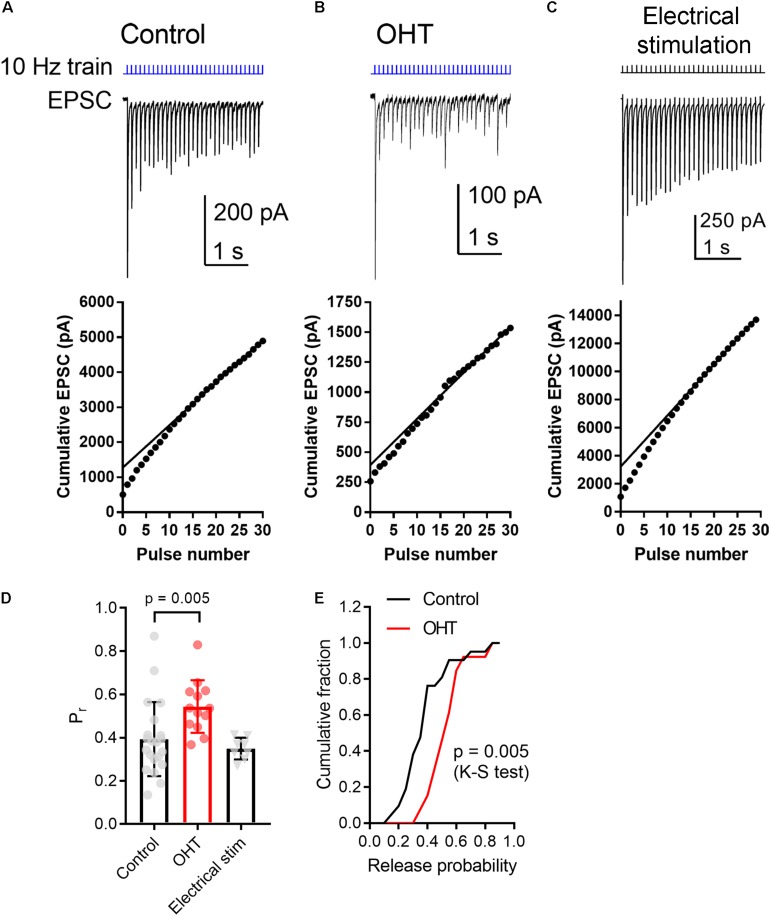
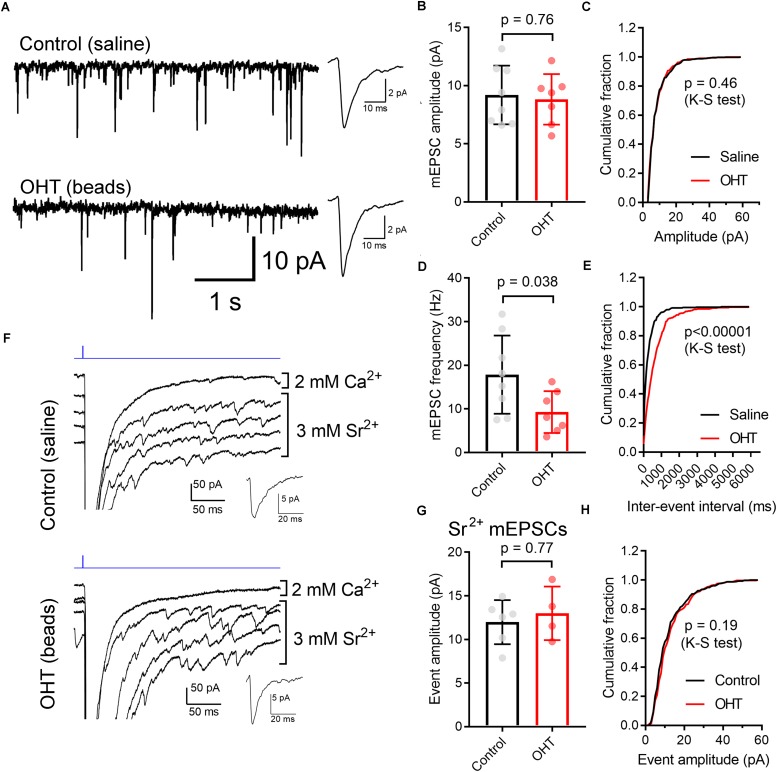
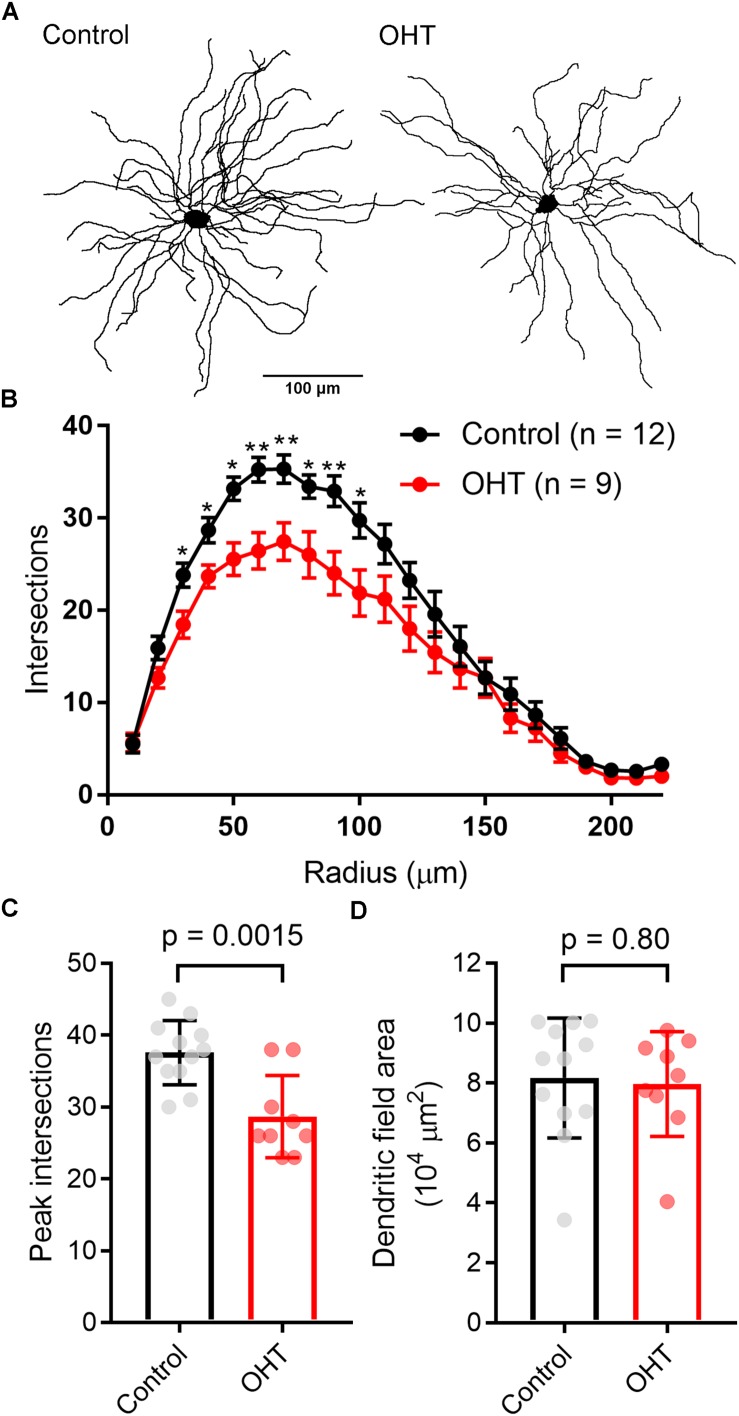
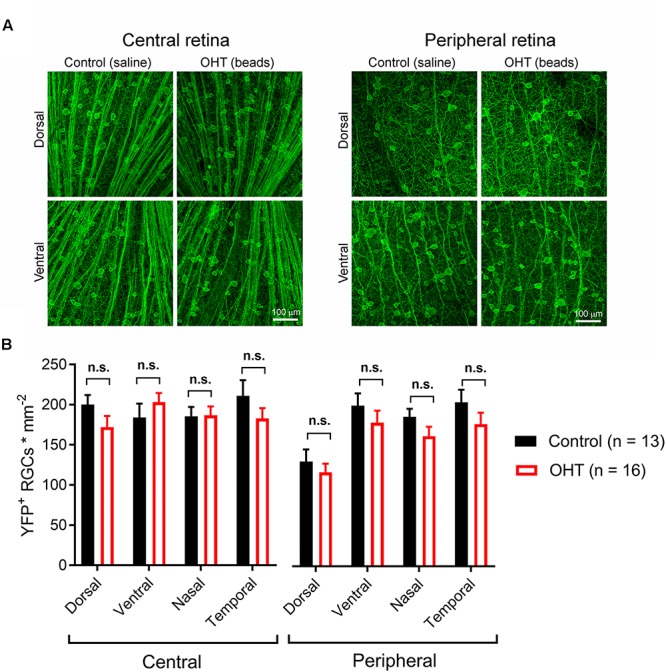
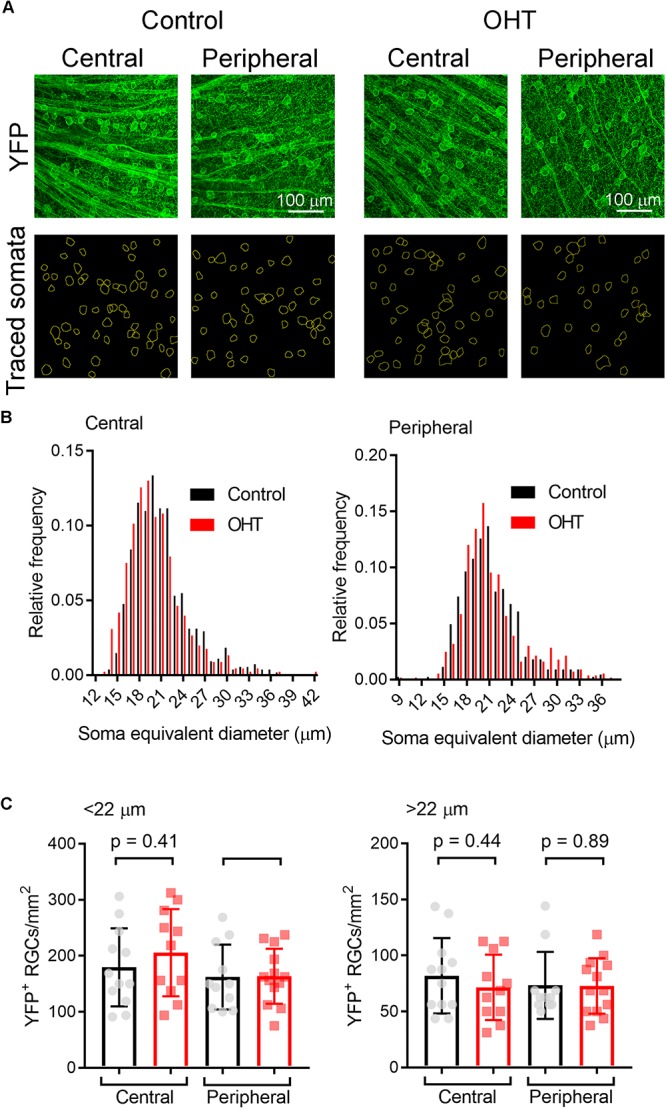
Axonopathy is a hallmark of many neurodegenerative diseases including glaucoma, where elevated intraocular pressure (ocular hypertension, OHT) stresses retinal ganglion cell (RGC) axons as they exit the eye and form the optic nerve. OHT causes early changes in the optic nerve such as axon atrophy, transport inhibition, and gliosis. Importantly, many of these changes appear to occur prior to irreversible neuronal loss, making them promising points for early diagnosis of glaucoma. It is unknown whether OHT has similarly early effects on the function of RGC output to the brain. To test this possibility, we elevated eye pressure in mice by anterior chamber injection of polystyrene microbeads. Five weeks post-injection, bead-injected eyes showed a modest RGC loss in the peripheral retina, as evidenced by RBPMS antibody staining. Additionally, we observed reduced dendritic complexity and lower spontaneous spike rate of On-αRGCs, targeted for patch clamp recording and dye filling using a Opn4-Cre reporter mouse line. To determine the influence of OHT on retinal projections to the brain, we expressed Channelrhodopsin-2 (ChR2) in melanopsin-expressing RGCs by crossing the Opn4-Cre mouse line with a ChR2-reporter mouse line and recorded post-synaptic responses in thalamocortical relay neurons in the dorsal lateral geniculate nucleus (dLGN) of the thalamus evoked by stimulation with 460 nm light. The use of a Opn4-Cre reporter system allowed for expression of ChR2 in a narrow subset of RGCs responsible for image-forming vision in mice. Five weeks following OHT induction, paired pulse and high-frequency stimulus train experiments revealed that presynaptic vesicle release probability at retinogeniculate synapses was elevated. Additionally, miniature synaptic current frequency was slightly reduced in brain slices from OHT mice and proximal dendrites of post-synaptic dLGN relay neurons, assessed using a Sholl analysis, showed a reduced complexity. Strikingly, these changes occurred prior to major loss of RGCs labeled with the Opn4-Cre mouse, as indicated by immunofluorescence staining of ChR2-expressing retinal neurons. Thus, OHT leads to pre- and post-synaptic functional and structural changes at retinogeniculate synapses. Along with RGC dendritic remodeling and optic nerve transport changes, these retinogeniculate synaptic changes are among the earliest signs of glaucoma.

Keywords: electrophysiology; glaucoma; lateral geniculate nucleus; ocular hypertension; optogenetics; retinal ganglion cell; synapse.


Figures

FIGURE 1
FIGURE 1
Ocular hypertension leads to retinal ganglion cell loss and inner retinal pathology. (A) Anterior chamber injection of 10-micron microspheres led to an increase in intraocular pressure (IOP) while injection of saline did not. p < < 0.005. (B) 2-photon image of retinal ganglion cells labeled with an anti-RBPMS antibody. Images from ventral and dorsal quadrants are in central and peripheral retina (∼500 and ∼1700 μm from optic nerve head) from saline- and bead-injected mice are shown. Lower panel shows quantification of RBPMS antibody-stained RGC density in central and peripheral retina showing lower RGC density in peripheral, but not central, retina in bead-injected mice. p < 0.05; ∗∗p < 0.01; ∗∗∗p < 0.001. (C) Images from central and peripheral retinas of RGCs labeled with and anti-Brn3 antibody. One eye received anterior chamber microbead injections while the contralateral eye received saline. Lower panel is quantification of Brn3+ RGC density showing a lower density in peripheral retina. Significance was assessed with a paired t-test (n = 7 retinas from bead-injected and n = 7 retinas from contralateral saline-injected eyes). (D) Optical coherence tomography image showing identification of retinal layers. The RNFL + GCL + IPL thickness was measured. Right, quantification of OCT imaging (measured at 500 μm from Bergmeister’s Papilla), shows a modest inner retinal thickening in ocular hypertensive mice. The RNFL + GCL + IPL thickness is plotted individually for each eye and the error bars are standard deviation.
FIGURE 2
FIGURE 2
Ocular hypertension alters the structure and function of M4-type RGCs. (A) Maximum intensity projection images of dye-filled M4/On-αRGCs filled with CF568 dye during whole cell recording in flat mount retinas. (B,C) In cell-attached measurements of spontaneous spiking (in the dark, in the absence of stimulus), the spontaneous spike frequency was lower in OHT than control. (D) Plot of soma size and number of dendritic branch points for filled RGCs. Control and OHT populations overlapped and resembled previous reports of parameters for M4 melanopsin-expressing RGCs. (E) Sholl analysis of M4 dendrites shows that dendritic complexity was slightly reduced relative to control cells. (F) Comparison of peak number of Sholl intersections in control and OHT M4 RGCs. (G) Total dendritic length was reduced in M4 RGCs from OHT retinas. Values for each cell are plotted individually in (C,F,G) and the bar graphs represent mean ± standard deviation. p < 0.05.
FIGURE 3
FIGURE 3
Activation of channelrhodopsin in dLGN brain slices evokes post-synaptic responses in TC neurons. (A) Thalamocortical neurons were targeted for whole-cell patch-clamp recording in dLGN brain slices. (B) Stimulation with a pair of full strength flashes from the TLED (0.5 ms duration, 200 ms interval, 1.5 mW) evoked large currents displaying paired pulse depression. Current amplitude was enhanced and decay kinetics slowed by addition of 200 μM γDGG and 100 μM cyclothiazide. Sixty mM picrotoxin was added to block inhibition. (C,D) In a current-voltage experiment, currents reversed near the cationic equilibrium potential (∼0 mV). (E) ChR2-evoked currents were sensitive to the AMPA receptor blocker CNQX, consistent with responses being excitatory post-synaptic currents (EPSC). (F) Slower, presumptive NMDA receptor-mediated EPSCs could be detected at depolarized potentials. (G) The AMPA/NMDA ratio was similar when the optic tract was stimulated using an extracellular electrode in parasagittal brain slices. (H) EPSCs were blocked by the Na+ channel blocked Tetrodotoxin (1–2 μM). (I) EPSCs were blocked by the Ca2+-channel blocked Cd2+ (200 μM).
FIGURE 4
FIGURE 4
Ocular hypertension increases synaptic depression at retinogeniculate synapses. (A) In brain slices from control animals, stimulation with a pair of 0.5 ms 460 nm LED flashes delivered through the microscope objective triggered post-synaptic currents displaying synaptic depression. In OHT (B), depression was more pronounced. (C) Paired pulse experiment in which the optic tract was stimulated with an extracellular electrode in a parasagittal brain slice through the dLGN. The PPR was similar to the ChR2-evoked response in brain slices from saline-injected (control mice). The stimulus artifact was deleted for display. (D) The paired pulse ratio (EPSC2/EPSC1) plotted against stimulus interval showed that although PPR increased with increasing stimulus interval, it was lower in bead-injected OHT mice than in controls. PPR values recorded in response to electrical stimulation of the optic tract in parasagittal slices are shown for comparison. Unpaired t-test was used to compare PPR from control and OHT mouse brain slices. ∗∗p < 0.005, ∗∗∗p < 0.001, p < 0.01. (E,F) The paired pulse ratio measured at a 100-ms interval was lower in OHT brain slices relative to controls. (G,H) There was no significant difference in the EPSC amplitude evoked by a saturating (1.5 mW) LED stimulus. Values are plotted for each individual cell in (E,G) and the bar graphs represent mean ± standard deviation.
FIGURE 5
FIGURE 5
OHT increases presynaptic vesicle release probability at retinogeniculate synapses. A train of LED stimuli (10 Hz, 30 stimuli) was used to assess synaptic vesicle release probability at RGC synapses onto TC neurons in control (A) and OHT (B) dLGN slices. Upper panels show the EPSC and lower panels show the cumulative EPSC with a straight line fit to stimuli 15–30 and extrapolated to the vertical axis. The ratio of the amplitude of the first EPSC to the vertical intercept of the fit is the release probability. (C) Responses to 10 Hz electrical stimuli delivered to the optic tract in parasagittal brain slices were similar to responses evoked by ChR2 stimulation in brain slices from saline-injected (control) mice. (D) The release probability (Pr) was elevated in recordings from OHT mice relative to recordings from saline-injected controls. The Pr measured from extracellular optic tract stimulation in parasagittal slices (“Electrical stim”) was similar to control values obtained with ChR2 stimulation. Values for each recorded cell are plotted individually and the bar graphs display mean ± standard deviation. (E) Cumulative probability distribution of Pr values in control and OHT.
FIGURE 6
FIGURE 6
Sensitivity of the optic tract to LED stimulation of ChR2 was not altered by OHT. (A,B) An extracellular electrode was positioned in the optic tract in coronal sections from saline-injected (control) or OHT mice in order to record population spiking in response to ChR2 activation with a series of LED stimulus intensities (2 μW – 1.2 mW). Each trace is an average of 3–10 individual responses at each intensity. Stimulus timing (0.5 ms LED flash) is marked above the traces in blue. (C) A plot of normalized response amplitudes shows that optic tract sensitivity to ChR2 was not altered by OHT.
FIGURE 7
FIGURE 7
Influence of OHT on single-vesicle synaptic currents in TC neurons in the dLGN. (A) mEPSCs recorded in the dLGN of TC cells in the absence of stimulation. These TC cells displayed evoked multiquantal EPSCs in response to ChR2 stimulation with 460 nm stimulation. Insets show mean mEPSC waveforms 100 individual mEPSCs detected in these recordings. (B,C) The mEPSC amplitude was not significantly different between control and OHT TC neurons. (D,E) The mEPSC frequency was significantly lower in OHT recordings whether assessed with an unpaired t-test (D) or with a Komolgorov–Smirnov test used to compare the cumulative distributions of 100 mEPSC inter-event intervals per recorded cell (E). (F) To record properties of single-vesicle events evoked by ChR2 stimulation, CaCl2 in the aCSF was replaced with 3 mM SrCl2. A single trace recorded in with Ca2+ and four traces recorded with Sr2+ are shown. Insets show waveforms of detected mEPSC events. (G,H) The amplitude of single-vesicle events evoked by ChR2 stimulation in Sr2+-containing aCSF were not significantly different between recordings from control and OHT mice. Values are plotted from individual cells in panels (B,D,G) and the bar graphs show mean ± standard deviation.
FIGURE 8
FIGURE 8
Five weeks modest OHT does not alter vGlut2 staining in the dLGN. (A) 2-photon images of a 1.5 micron optical section of dLGN stained for vGLut2, which marks RGC axon terminals in control and OHT conditions. Lower panels show vGlut2 puncta that were automatically detected in ImageJ. (B–D) Neither the density nor the size of vGlut2 puncta differed between control and OHT dLGN. The density and size of puncta for each brain slice are plotted individually and the mean ± SD is plotted in the bar graph (B,C). (D) The cumulative distribution of 300 detected vGlut2 puncta per brain slice was nearly identical for control and OHT.
FIGURE 9
FIGURE 9
Dendritic complexity of TC neurons in the dLGN is reduced by OHT. (A) dLGN TC neurons (Y-type profiles) were filled with neurobiotin during whole-cell recording for later 2-photon imaging and tracing of their dendritic profiles. (B) Sholl analysis of TC neuron dendritic complexity shows a reduction in the number of dendrite crossings in OHT TC neurons, consistent with some dendritic pruning or retraction. p < 0.05, ∗∗p < 0.01. (C) The peak number of intersections was lower in TC neurons from OHT brain slices. (D) The dendritic field area, measured by drawing a convex polygon contacting distal dendritic tips, was not significantly different between OHT and control groups. In (C,D), vGlut2 density and puncta size are plotted individually from each brain slice and the bar graphs show mean ± standard deviation.
FIGURE 10
FIGURE 10
Five weeks of OHT does not lead to a detectable loss of melanopsin-expressing RGCs. (A) In order to test for changes in the density of RGCs expressing the ChR2-YFP reporter, the somata, axons, and dendrites of ChR2-YFP expressing RGCs were stained using anti-GFP primary antibodies in retinal flat mounts. RGC somata were counted in central retina (∼500 microns from optic nerve head) and peripheral retina (∼1700 microns from optic nerve head) in dorsal, ventral, nasal, and temporal quadrants (determined by co-staining for S-opsin). (B) YFP ± RGC somata density in four quadrants of central and peripheral retina. RGC density did not significantly differ between control and OHT groups (n.s., p > 0.05).
FIGURE 11
FIGURE 11
Analysis of ChR2-YFP RGC density by soma size. (A) 2-photon images of retinas showing ChR2-YFP expression (enhanced with immunofluorescence staining with an anti-GFP antibody) in central and peripheral regions of ventral retinas. Lower panels show somatic regions of interest traced by hand in ImageJ. (B) Distribution of equivalent soma diameters of traced somata in central and peripheral retina from control and OHT eyes. (C) Measurements of RGC density for cells with somata with diameters <22 μm (left) and >22 μm (right). Data points of density for each image are shown and the bar graph represents mean ± SD (central control, n = 12 retinas; peripheral control, n = 11 retinas; central OHT, n = 11 retinas; peripheral OHT, n = 13 retinas).

References

    1. Abbott C. J., Choe T. E., Lusardi T. A., Burgoyne C. F., Wang L., Fortune B. (2014). Evaluation of retinal nerve fiber layer thickness and axonal transport 1 and 2 weeks after 8 hours of acute intraocular pressure elevation in rats. Invest. Ophthalmol. Vis. Sci. 55 674–687. 10.1167/iovs.13-12811 - DOI - PMC - PubMed
    1. Applebury M. L., Antoch M. P., Baxter L. C., Chun L. L., Falk J. D., Farhangfar F., et al. (2000). The Murine cone photoreceptor: a single cone type expresses both S and M opsins with retinal spatial patterning. Neuron 27 513–523. - PubMed
    1. Avwenagha O., Bird M. M., Lieberman A. R., Yan Q., Campbell G. (2006). Patterns of expression of brain-derived neurotrophic factor and tyrosine kinase B mRNAs and distribution and ultrastructural localization of their proteins in the visual pathway of the adult rat. Neuroscience 140 913–928. 10.1016/j.neuroscience.2006.02.056 - DOI - PubMed
    1. Berson D. M., Castrucci A. M., Provencio I. (2010). Morphology and mosaics of melanopsin-expressing retinal ganglion cell types in mice. J. Comp. Neurol. 518 2405–2422. 10.1002/cne.22381 - DOI - PMC - PubMed
    1. Berson D. M., Dunn F. A., Takao M. (2002). Phototransduction by retinal ganglion cells that set the circadian clock. Science 295 1070–1073. 10.1126/science.1067262 - DOI - PubMed

LinkOut - more resources