. 2019 Sep 23:10:2083.
doi: 10.3389/fmicb.2019.02083. eCollection 2019.

Analysis of 1,000 Type-Strain Genomes Improves Taxonomic Classification of Bacteroidetes

Affiliations

Analysis of 1,000 Type-Strain Genomes Improves Taxonomic Classification of Bacteroidetes

Marina García-López et al. Front Microbiol. .

Abstract

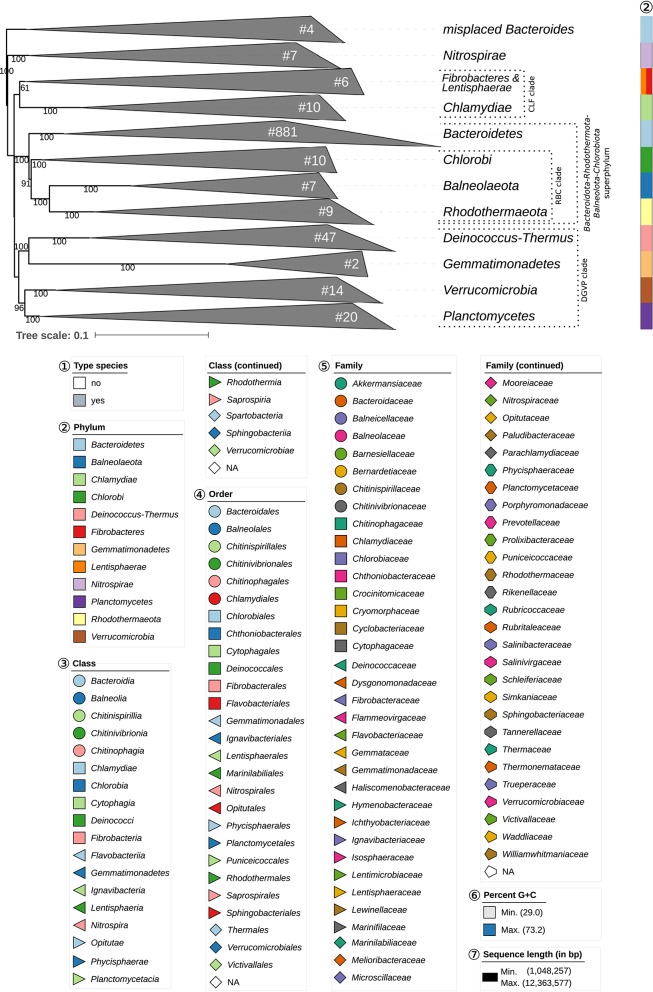
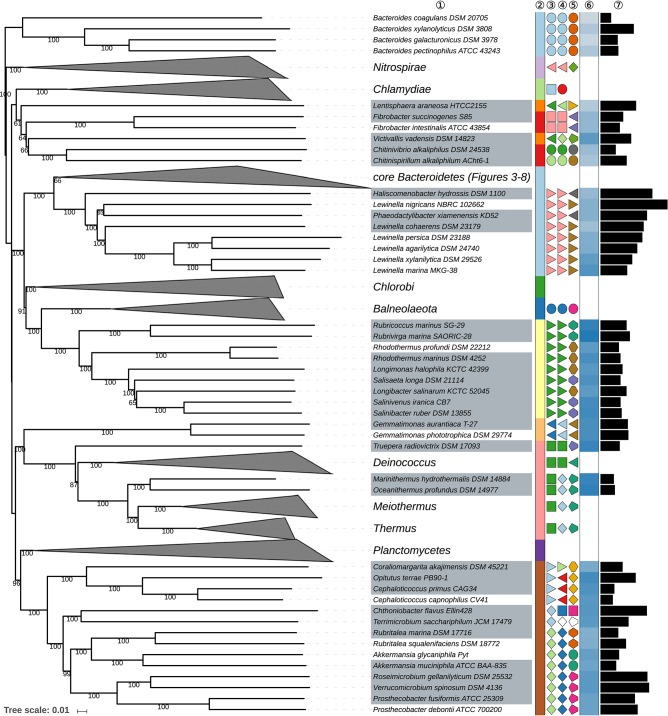
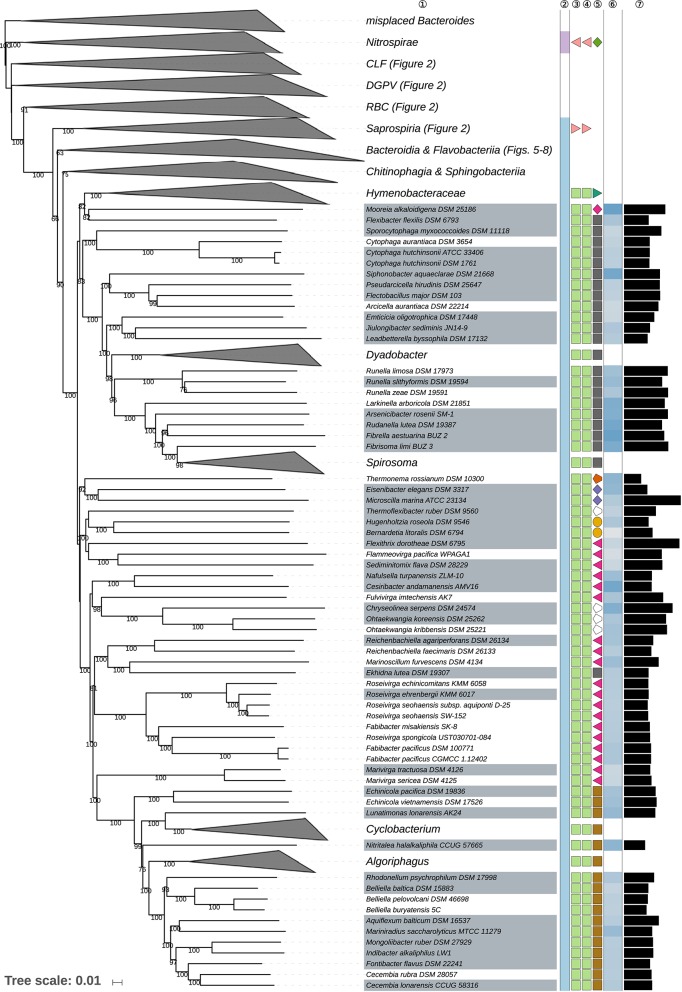
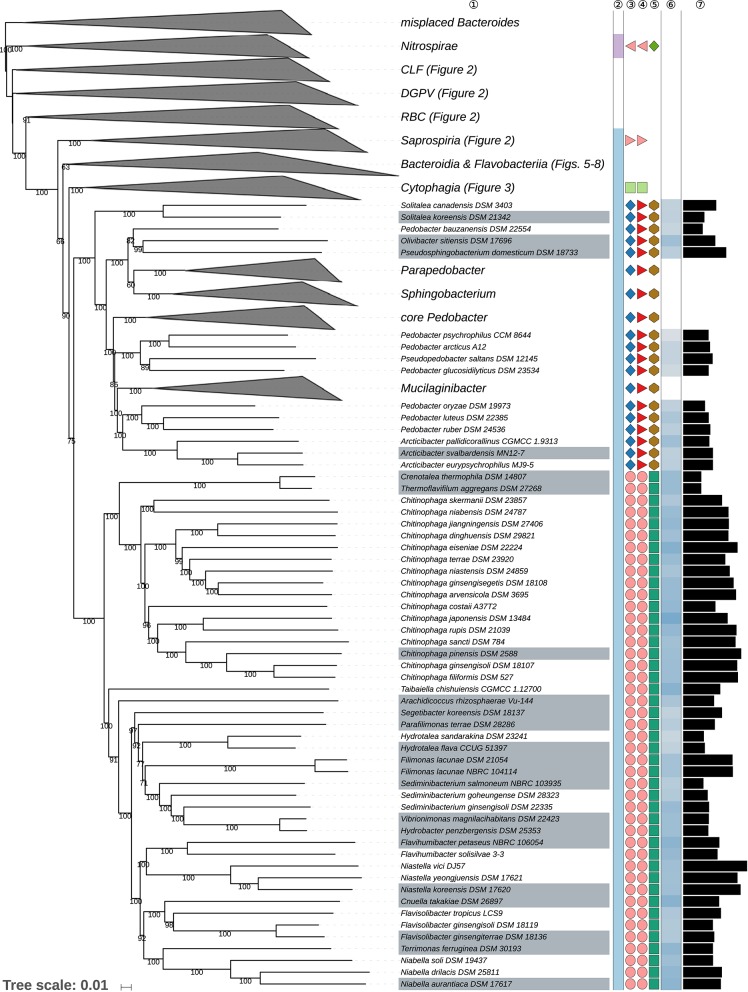
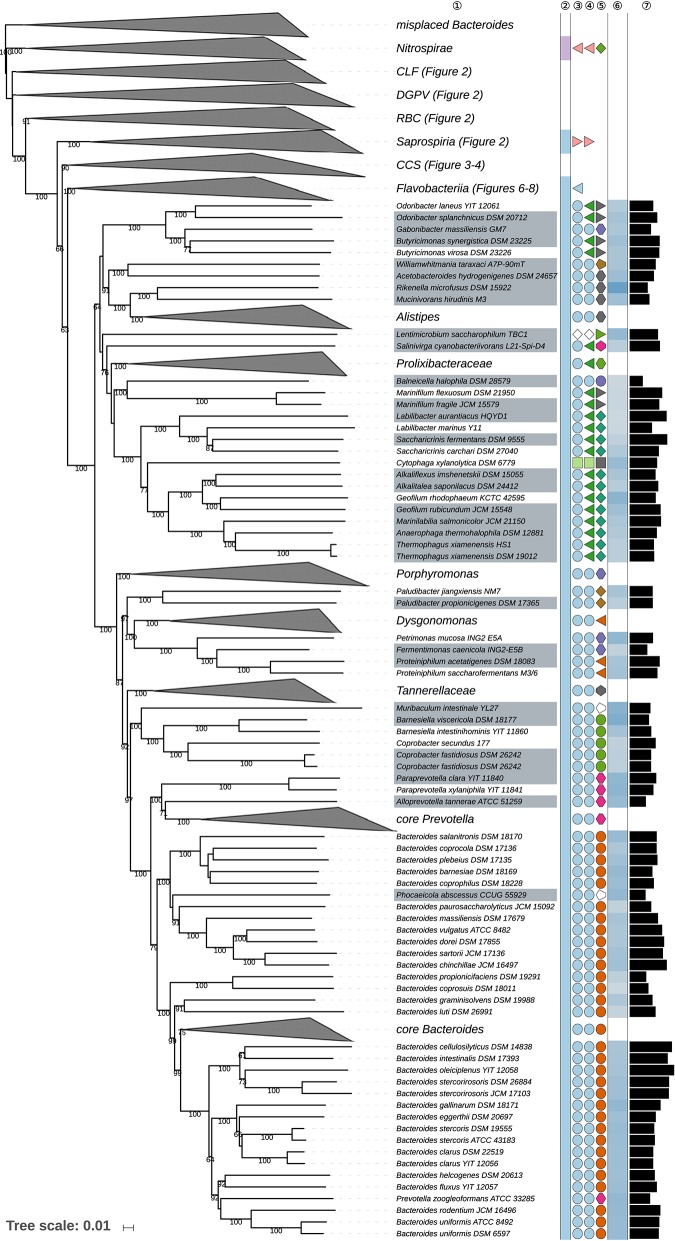
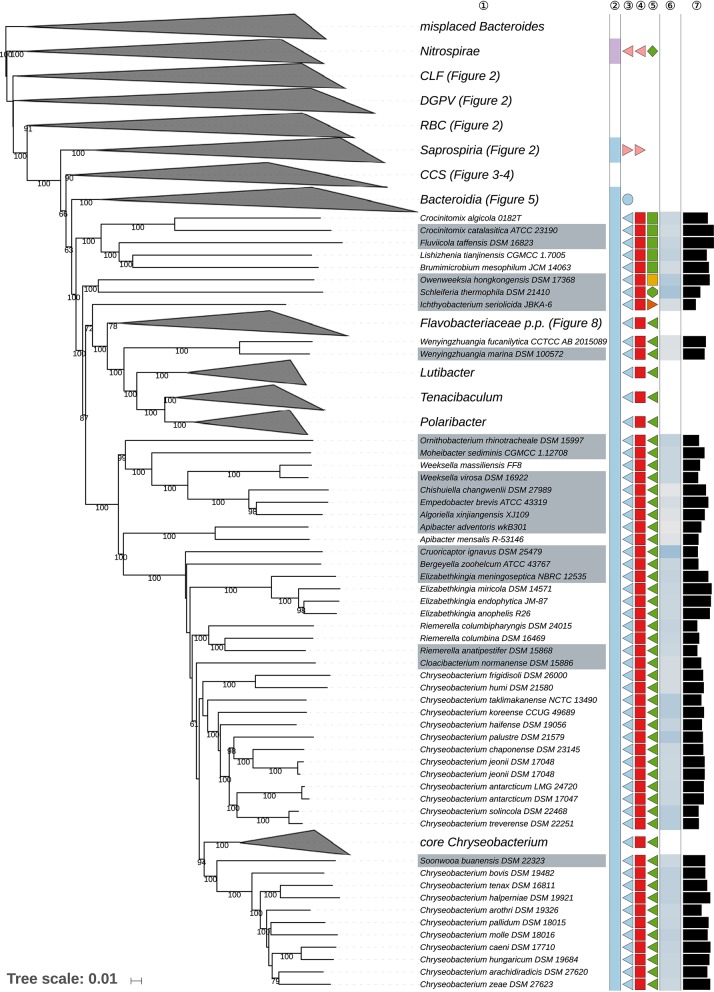
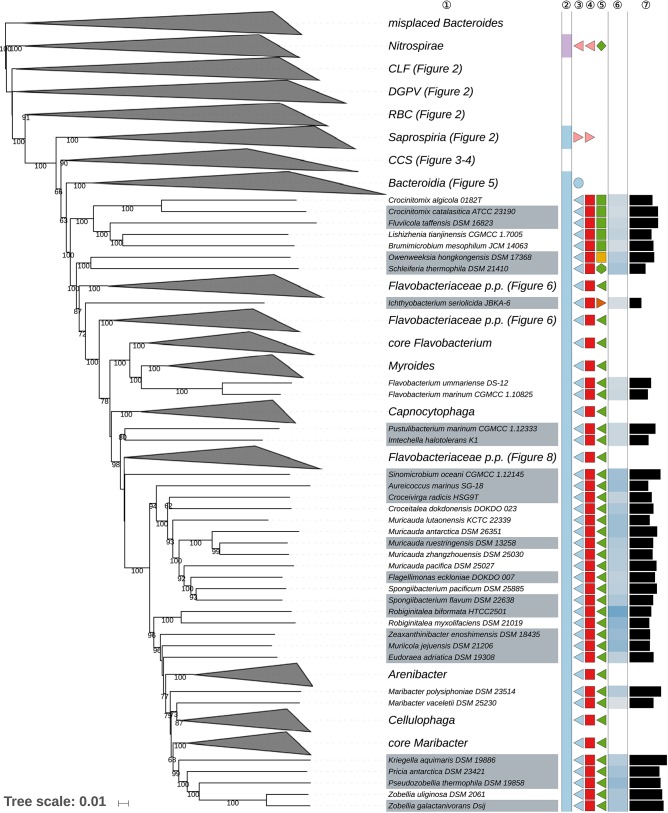
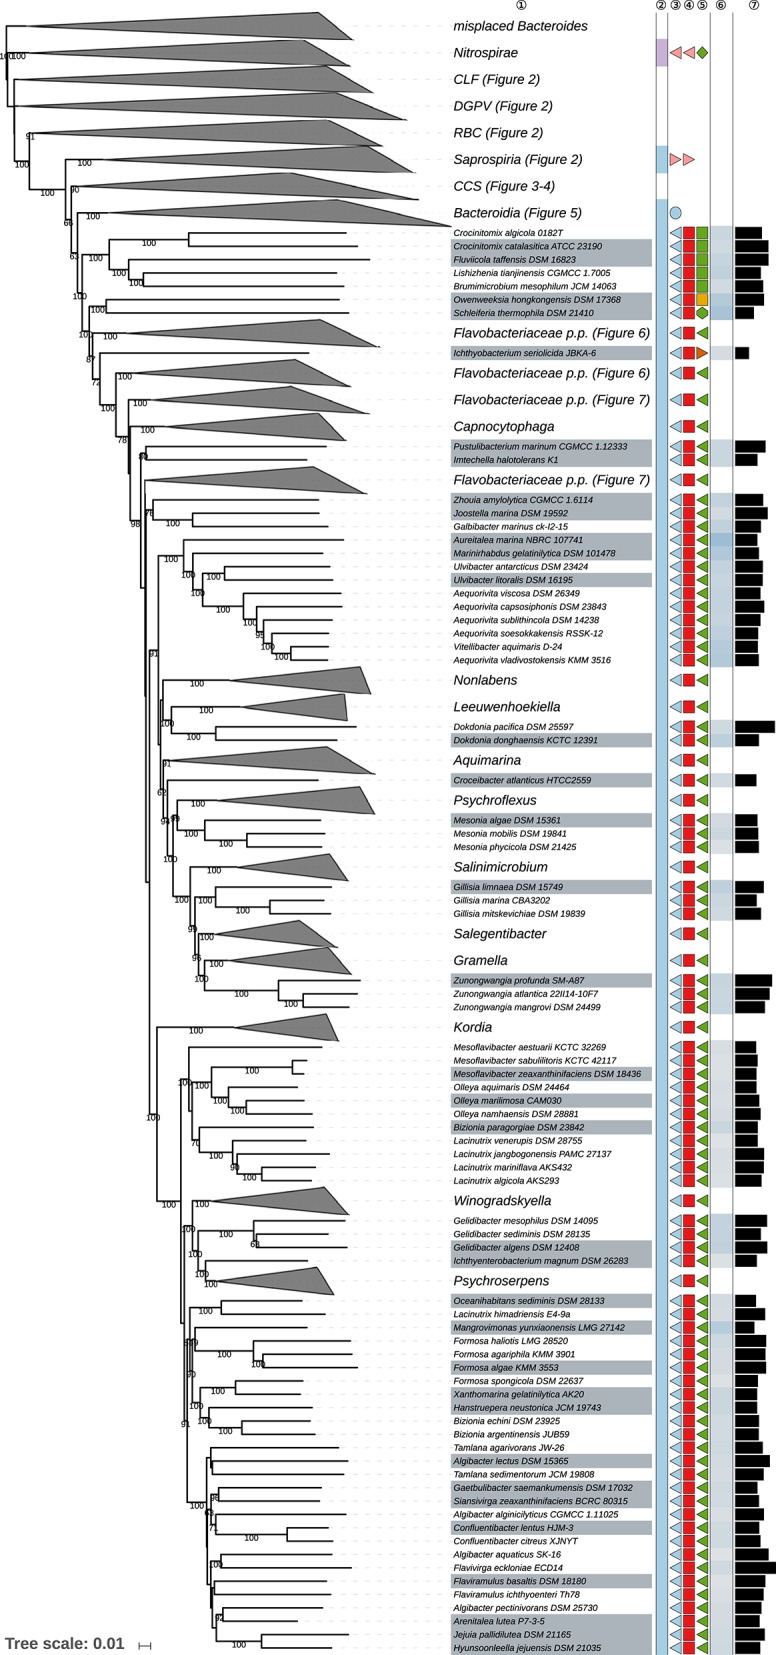
Although considerable progress has been made in recent years regarding the classification of bacteria assigned to the phylum Bacteroidetes, there remains a need to further clarify taxonomic relationships within a diverse assemblage that includes organisms of clinical, piscicultural, and ecological importance. Bacteroidetes classification has proved to be difficult, not least when taxonomic decisions rested heavily on interpretation of poorly resolved 16S rRNA gene trees and a limited number of phenotypic features. Here, draft genome sequences of a greatly enlarged collection of genomes of more than 1,000 Bacteroidetes and outgroup type strains were used to infer phylogenetic trees from genome-scale data using the principles drawn from phylogenetic systematics. The majority of taxa were found to be monophyletic but several orders, families and genera, including taxa proposed long ago such as Bacteroides, Cytophaga, and Flavobacterium but also quite recent taxa, as well as a few species were shown to be in need of revision. According proposals are made for the recognition of new orders, families and genera, as well as the transfer of a variety of species to other genera. In addition, emended descriptions are given for many species mainly involving information on DNA G+C content and (approximate) genome size, both of which can be considered valuable taxonomic markers. We detected many incongruities when comparing the results of the present study with existing classifications, which appear to be caused by insufficiently resolved 16S rRNA gene trees or incomplete taxon sampling. The few significant incongruities found between 16S rRNA gene and whole genome trees underline the pitfalls inherent in phylogenies based upon single gene sequences and the impediment in using ordinary bootstrapping in phylogenomic studies, particularly when combined with too narrow gene selections. While a significant degree of phylogenetic conservation was detected in all phenotypic characters investigated, the overall fit to the tree varied considerably, which is one of the probable causes of misclassifications in the past, much like the use of plesiomorphic character states as diagnostic features.

Keywords: G+C content; chemotaxonomy; genome BLAST distance phylogeny; genome size; morphology; phylogenetic systematics; phylogenomics.


Figures

Figure 1
Figure 1
Overview of the phylogenomic tree inferred with FastME from GBDP distances calculated from whole proteomes. The numbers above branches are GBDP pseudo-bootstrap support values from 100 replications. Collapsed clades are displayed as triangles whose side lengths are proportional to the branch-length distances to least and most distant leave, respectively. The total number (#) of leaves per collapsed clade is shown within the triangles. The legend indicates the symbols and colors used in all subsequent figures, which show details of all clades of interest. These clades are composed of the following phyla: CLF, Chlamydiae-Lentisphaerae-Fibrobacteres clade; DGPV, Deinococcus-Thermus-Gemmatimonadetes-Planctomycetes-Verrucomicrobia clade; RBC, Rhodothermaeota-Balneolaeota-Chlorobi clade. These clades are weakly supported and annotated for display purposes only; they are not suggested as reliable groupings. Figures 2–8 show specific sections of the same tree in greater detail; while the underlying topology is exactly the same, the ordering of the clades may slightly differ.
Figure 2
Figure 2
First part of the GBDP tree shown in Figure 1, focusing on misplaced Bacteroides species, on taxa outside the phylum Bacteroidetes and on the class Saprospiria. Tip labels with gray background indicate type species of genera, colors, and symbols to the right of the tips indicate, from left to right, phylum, class, order, and family; for details and abbreviations (see Figure 1). The blue color gradient right indicates the G+C content as calculated from the genome sequences, followed by black bars indicating the (approximate) genome size in base pairs.
Figure 3
Figure 3
Second part of the GBDP tree shown in Figure 1, focusing on the class Cytophagia. Tip labels with gray background indicate type species of genera, colors, and symbols to the right of the tips indicate, from left to right, phylum, class, order, and family; for details and abbreviations (see Figure 1). The blue color gradient right indicates the G+C content as calculated from the genome sequences, followed by black bars indicating the (approximate) genome size in base pairs.
Figure 4
Figure 4
Third part of the GBDP tree shown in Figure 1, focusing on the classes Chitinophagia and Sphingobacteriia. Tip labels with gray background indicate type species of genera, colors, and symbols to the right of the tips indicate, from left to right, phylum, class, order, and family; for details and abbreviations (see Figure 1). The blue color gradient right indicates the G+C content as calculated from the genome sequences, followed by black bars indicating the (approximate) genome size in base pairs.
Figure 5
Figure 5
Fourth part of the GBDP tree shown in Figure 1, focusing on the class Bacteroidia. Tip labels with gray background indicate type species of genera, colors, and symbols to the right of the tips indicate, from left to right, phylum, class, order, and family; for details and abbreviations (see Figure 1). The blue color gradient right indicates the G+C content as calculated from the genome sequences, followed by black bars indicating the (approximate) genome size in base pairs. CCS, Cytophagia-Chitinophagia-Sphingobacteriia clade.
Figure 6
Figure 6
Fifth part of the GBDP tree shown in Figure 1, focussing on parts of the class Flavobacteriia. Tip labels with gray background indicate type species of genera, colors, and symbols to the right of the tips indicate, from left to right, phylum, class, order, and family; for details and abbreviations (see Figure 1). The blue color gradient right indicates the G+C content as calculated from the genome sequences, followed by black bars indicating the (approximate) genome size in base pairs. CCS, Cytophagia-Chitinophagia-Sphingobacteriia clade.
Figure 7
Figure 7
Sixth part of the GBDP tree shown in Figure 1, focussing on parts of the class Flavobacteriia. Tip labels with gray background indicate type species of genera, colors, and symbols to the right of the tips indicate, from left to right, phylum, class, order, and family; for details and abbreviations (see Figure 1). The blue color gradient right indicates the G+C content as calculated from the genome sequences, followed by black bars indicating the (approximate) genome size in base pairs. CCS, Cytophagia-Chitinophagia-Sphingobacteriia clade.
Figure 8
Figure 8
Seventh part of the GBDP tree shown in Figure 1, focussing on parts of the class Flavobacteriia. Tip labels with gray background indicate type species of genera, colors, and symbols to the right of the tips indicate, from left to right, phylum, class, order, and family; for details and abbreviations (see Figure 1). The blue color gradient right indicates the G+C content as calculated from the genome sequences, followed by black bars indicating the (approximate) genome size in base pairs. CCS, Cytophagia-Chitinophagia-Sphingobacteriia clade.

References

    1. Ahn J.-H., Weon H.-Y., Kim S.-J., Hong S.-B., Seok S.-J., Kwon S.-W. (2014). Spirosoma oryzae sp. nov., isolated from rice soil and emended description of the genus Spirosoma. Int. J. Syst. Evol. Microbiol. 64, 3230–3234. 10.1099/ijs.0.062901-0 - DOI - PubMed
    1. Al Masalma M., Raoult D., Roux V. (2009). Phocaeicola abscessus gen. nov., sp. nov., an anaerobic bacterium isolated from a human brain abscess sample. Int. J. Syst. Evol. Microbiol. 59, 2232–2237. 10.1099/ijs.0.007823-0 - DOI - PubMed
    1. Alain K., Tindall B. J., Catala P., Intertaglia L., Lebaron P. (2010). Ekhidna lutea gen. nov., sp. nov., a member of the phylum Bacteroidetes isolated from the South East Pacific Ocean. Int. J. Syst. Evol. Microbiol. 60, 2972–2978. 10.1099/ijs.0.018804-0 - DOI - PubMed
    1. Albert R. A., Waas N. E., Pavlons S. C., Pearson J. L., Ketelboeter L., Rosselló-Móra R., et al. (2013). Sphingobacterium psychroaquaticum sp. nov., a psychrophilic bacterium isolated from Lake Michigan water. Int. J. Syst. Evol. Microbiol. 63, 952–958. 10.1099/ijs.0.043844-0 - DOI - PubMed
    1. Albert R. A., Zitomer D., Dollhopf M., Schauer-Gimenez A. E., Struble C., King M., et al. (2014). Proposal of Vibrionimonas magnilacihabitans gen. nov., sp. nov., a curved Gram-stain-negative bacterium isolated from lake water. Int. J. Syst. Evol. Microbiol. 64, 613–620. 10.1099/ijs.0.056663-0 - DOI - PubMed