. 2019 Sep 24:10:2191.
doi: 10.3389/fmicb.2019.02191. eCollection 2019.

Diel Oscillation of Microbial Gene Transcripts Declines With Depth in Oligotrophic Ocean Waters

Affiliations

Diel Oscillation of Microbial Gene Transcripts Declines With Depth in Oligotrophic Ocean Waters

Alice Vislova et al. Front Microbiol. .

Abstract

Diel oscillations in primary and secondary production, growth, metabolic activity, and gene expression commonly occur in marine microbial communities in ocean surface waters. Diel periodicity of gene transcription has been demonstrated in photoautotrophic and heterotrophic microbes in both coastal and open ocean environments. To better define the spatiotemporal distribution and patterns of these daily oscillations, we investigated how diel periodicity in gene transcripts changed with depth from the surface waters to the upper mesopelagic. We postulated that diel oscillation of transcript abundances would diminish at greater depths across the collective microbial community due to decreasing light availability. The results showed that the number and total proportion of gene transcripts and taxa exhibiting diel periodicity were greatest in the shallow sunlit mixed layer, diminished rapidly with increasing depth to the base of the euphotic zone, and could not be detected in the mesopelagic. The results confirmed an overall decrease in microbial diel transcript oscillation with depth through the euphotic zone and suggested a relationship between abundance of diel oscillating transcripts and the daily integrated light exposure experienced by planktonic microbes in the water column. Local dissolved macronutrient concentration also appeared to influence the diel transcriptional patterns of specific microbial genes. The diminishing diel transcript oscillations found at increasing depths suggest that diel patterns of other microbial processes and interactions may likewise be attenuated at depth.

Keywords: bacterioplankton; diel; oceanography; oligotrophic; phytoplankton; transcriptome.


Figures

Figure 1
Figure 1
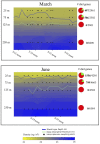
Hydrography and total proportion of transcriptomic periodicity at different depths. Depth profiles of density across the sampling periods during the two cruises included in the analysis, illustrating the shallower mixed layer during the June relative to the March cruise. Pie charts indicate the overall proportions of expressed genes exhibiting statistically significant 24-h periodicity (green wedge in the pie chart) in each dataset according to the RAIN algorithm. Numbers to the right of the pie chart indicate total number of periodic genes (in bold), over the total number of genes detected. Blue lines indicate the mixed layer depth across each sampling period, green lines indicate the depth of the deep chlorophyll maxim, and black dots indicate sampling points for transcriptomic analysis.
Figure 2
Figure 2
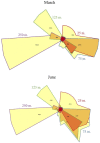
Venn diagrams of transcripts matching specific genes at each depth sampled. The diagram depicts the number of genes that mapped to transcripts in each depth. Overlap between any two depths is shown by the color of their outline (e.g., gene transcripts shared between 125 and 250 m number 263 are shown in the wedge having the half purple, half green outline). Distinct sets of gene transcripts appeared below the euphotic zone during both cruises, as well as an increase in the number of unique genes expressed in the shallower mixed layer in June at 25 m, relative to 25 m in March.
Figure 3
Figure 3
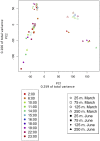
Principle component analysis of samples based on transcript counts over time. PCA arranges samples in space based on their similarity with respect to genes present and their relative expression levels. Transcript counts were averaged across samples taken at the same time over multiple days. The shape of the point indicates the sample depth, color indicates sample time, and shading indicates whether the sample belonged to the March or the June dataset. Samples clustered primarily based on depth sampled and secondarily based on the time of year (March vs. June). About 25 and 75 m samples cluster together, especially during March when both depths were encompassed in the upper mixed layer.
Figure 4
Figure 4
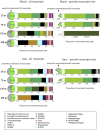
Taxonomic origins of gene transcripts. This figure illustrates taxonomic compositions of the meta-transcriptomes. Pie charts indicate the relative abundances of annotated vs. unknown transcripts while bar charts indicate the relative taxonomic composition of annotated transcripts, averaged across each time series. The March cruise is shown on the top two panels, the June cruise on the bottom two panels. The two panels on the left represent the entire metratranscriptomes, illustrating a gradual shift in transcriptomically active taxa with depth through the euphotic zone below the upper mixed layer, as well as a major change in taxonomic composition below the euphotic zone. In pie charts next to the two panels on the left, the green portion represents, at each depth, the proportion of all transcripts with known annotations, and gray portion indicates the proportion of all transcripts which are of unknown origin. The two panels on the right represent just the significantly periodic transcripts according to the RAIN algorithm, illustrating the dominance of phytoplankton within the significantly periodic pool. In the pie charts next to the panels on the right, the white portions represent non-periodic transcripts, the gray corresponds to significantly periodic transcripts with no functional or taxonomic annotation, and green are significantly periodic transcripts mapping to known annotated genes.
Figure 5
Figure 5
NMDS clustering of genes based on distance matrix of transcript abundance patterns over time. This figure illustrates two-dimensional non-metric multidimensional scaling of all genes in each dataset based on pairwise distances between them. Each point represents a gene in the dataset and the distances between points represent their similarity in expression profiles over time. Each NMDS plot is shown three times, colored differently each time: by taxonomic annotation, by functional annotation and by peak time. Filled-in circles indicate that the temporal expression of that gene was periodic according to the RAIN algorithm. Hollow circles were not significantly diel. Significantly periodic genes near the surface belonged mostly to Prochlorococcus and formed distinct clusters, differentiable by their functional annotations and peak transcript abundance times. Diel patterns of transcript abundance diminished with depth, and were undetectable below the euphotic zone.

References

    1. Axmann I. M., Duhring U., Seeliger L., Arnold A., Vanselow J. T., Kramer A., et al. . (2009). Biochemical evidence for a timing mechanism in Prochlorococcus. J. Bacteriol. 191, 5342–5347. 10.1128/JB.00419-09, PMID: - DOI - PMC - PubMed
    1. Aylward F. O., Eppley J. M., Smith J. M., Chavez F. P., Scholin C. A., DeLong E. F. (2015). Microbial community transcriptional networks are conserved in three domains at ocean basin scales. Proc. Natl. Acad. Sci. USA 112, 5443–4338. 10.1073/pnas.1502883112, PMID: - DOI - PMC - PubMed
    1. Azam F., Malfatti F. (2007). Microbial structuring of marine ecosystems. Nat. Microbiol. 5, 782–791. 10.1038/nrmicro1747, PMID: - DOI - PubMed
    1. Bell-Pedersen D., Cassone V. M., Earnest D. J., Golden S. S., Hardin P. E., Thomas T. L., et al. . (2005). Circadian rhythms from multiple oscillators: lessons from diverse organisms. Nat. Rev. Genet. 6, 544–556. 10.1038/nrg1633, PMID: - DOI - PMC - PubMed
    1. Bennett S. (2004). Solexa Ltd. Pharmacogenomics 5, 433–438. 10.1517/14622416.5.4.433, PMID: - DOI - PubMed

LinkOut - more resources