. 2019 Sep 19:10:863.
doi: 10.3389/fgene.2019.00863. eCollection 2019.

Elimination of Reference Mapping Bias Reveals Robust Immune Related Allele-Specific Expression in Crossbred Sheep

Affiliations

Elimination of Reference Mapping Bias Reveals Robust Immune Related Allele-Specific Expression in Crossbred Sheep

Mazdak Salavati et al. Front Genet. .

Abstract

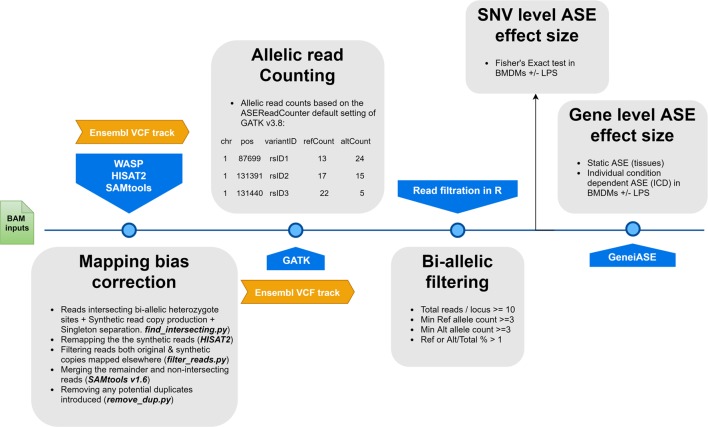
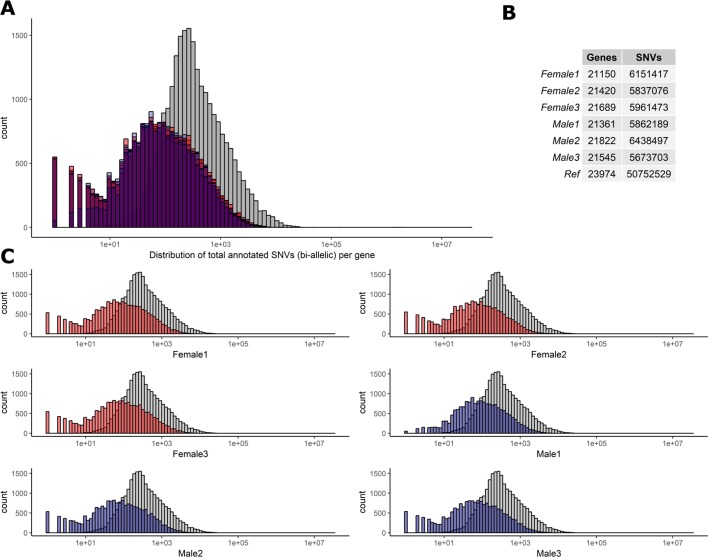
Pervasive allelic variation at both gene and single nucleotide level (SNV) between individuals is commonly associated with complex traits in humans and animals. Allele-specific expression (ASE) analysis, using RNA-Seq, can provide a detailed annotation of allelic imbalance and infer the existence of cis-acting transcriptional regulation. However, variant detection in RNA-Seq data is compromised by biased mapping of reads to the reference DNA sequence. In this manuscript, we describe an unbiased standardized computational pipeline for allele-specific expression analysis using RNA-Seq data, which we have adapted and developed using tools available under open license. The analysis pipeline we present is designed to minimize reference bias while providing accurate profiling of allele-specific expression across tissues and cell types. Using this methodology, we were able to profile pervasive allelic imbalance across tissues and cell types, at both the gene and SNV level, in Texel×Scottish Blackface sheep, using the sheep gene expression atlas data set. ASE profiles were pervasive in each sheep and across all tissue types investigated. However, ASE profiles shared across tissues were limited, and instead, they tended to be highly tissue-specific. These tissue-specific ASE profiles may underlie the expression of economically important traits and could be utilized as weighted SNVs, for example, to improve the accuracy of genomic selection in breeding programs for sheep. An additional benefit of the pipeline is that it does not require parental genotypes and can therefore be applied to other RNA-Seq data sets for livestock, including those available on the Functional Annotation of Animal Genomes (FAANG) data portal. This study is the first global characterization of moderate to extreme ASE in tissues and cell types from sheep. We have applied a robust methodology for ASE profiling to provide both a novel analysis of the multi-dimensional sheep gene expression atlas data set and a foundation for identifying the regulatory and expressed elements of the genome that are driving complex traits in livestock.

Keywords: GeneiASE; RNA-Seq; WASP; allele-specific expression; mapping bias; sheep; transcriptome.


Figures

Figure 1
Figure 1
A flowchart of the allele-specific expression analysis pipeline applied to the sheep gene expression atlas data set and optimized for WASP and GeneiASE programs. The remapping was carried out using HISAT2 (Kim et al., 2015) in combination with SAMtools (Li et al., 2009). The Genome Analysis Toolkit v 3.8 was used for the ASE read counting section.
Figure 2
Figure 2
Distribution of biallelic SNVs expressed per gene in each of the six T×BF sheep. The total number of SNVs was averaged across thymus, liver, ileum, and spleen for every animal. Over 5×10⁷ SNVs were gathered using Ensembl v.92 VCF track. The total number of SNVs per genes is averaged across four tissue RNA-Seq in each animal (∼5.9 × 10⁶). (A) Histogram of SNVs per gene counts in the reference track (Ensembl in grey) and six sheep in red (females) and blue (males) overlaid. (B). The overall numbers of genes and SNVs detected in each animal (averaged over four tissues). (C) Individual histograms from section A with females in red and males in blue.
Figure 3
Figure 3
The histogram of a global reference allelic ratio at every locus in the tissues. The distribution of ref allelic ratio showed a balanced profile without any 0 or 1 inflation which is observed in the presence of reference mapping bias. The allelic ratio above 0.51 is shown in blue and below 0.49 in red while balanced bi-allelic expression (0.49–0.51) is colored in gray. Ref.dp, read counts for reference allele; Alt.dp, read counts for alternate allele. The y axis is square root scaled. As discussed in the text SNP that display MAE are not present in any of the samples analyzed, indicating there was no inflation in either 0 or 1 allelic ratio.
Figure 4
Figure 4
Genes exhibiting static ASE shared across tissues from all six sheep. The x axis represents the mean allelic imbalance (averaged static ASE across sheep in each tissue). (A) Genes shared by four tissues with significant (false discovery rate [FDR], < 0.1) static ASE. (B) ASE genes private to Ileum. (C) Private to liver. (D) Private to spleen. (E) Private to thymus.
Figure 5
Figure 5
Intersectionality analysis of genes expressing significant ASE across all six sheep. In each tissue from left to right, the set count of genes (dots connected by lines) illustrates the number of sheep sharing the gene. The private sets of genes are located at the far right of each graph (single dots with no line). The intersections are colored in to illustrate the size of the set of shared genes (red [common to all six sheep], green [shared by five or four sheep], yellow [only in females] and purple [only in males]). Detailed lists of genes with ASE shared by at least four sheep are presented above each graph for (A) ileum, (B) liver, (C) spleen, and (D) thymus. Two sex-specific sets of genes are highlighted: 16 genes showing ASE only in females (in yellow) and five genes only in males (in purple).
Figure 6
Figure 6
Intersection analysis of SNVs under genes with significant ICD-ASE in the BMDMs ± LPS. From left to right, the set number of genes (dots connected by lines) has been illustrated in order according to the number of sheep sharing the SNV. The private sets of SNVs are located at the far right of each graph (single dots with no line).
Figure 7
Figure 7
Scatter plot of the adjusted p values from Fisher’s exact test (unified using Stouffer unification) in BMDMs comparing expression from different alleles at 0 vs 7 h at SNV level (LPS-inducible ASE). (A) The graph shows 646 loci exhibiting LPS-inducible allelic imbalance shared across all six sheep. (B) Four loci on chromosomes 3, 16, 17, and 21 with false discovery rate (FDR) < 1 × 10⁻⁸. FDR < 1 × 10⁻² red line (n = 16 SNVs) and FDR < 1 × 10⁻⁸ blue line (n = 4 SNVs).

References

    1. Álvarez I., Pérez-Pardal L., Traoré A., Fernández I., Goyache F. (2016). Lack of specific alleles for the bovine chemokine (C-X-C) receptor type 4 (CXCR4) gene in West African cattle questions its role as a candidate for trypanotolerance. Infect. Genet. Evol. 42, 30–33. 10.1016/j.meegid.2016.04.029 - DOI - PubMed
    1. Andersson L., Archibald A. L., Bottema C. D., Brauning R., Burgess S. C., Burt D. W., et al. (2015). Coordinated international action to accelerate genome-to-phenome with FAANG, the Functional Annotation of Animal Genomes project. Genome Biol. 16, 57. 10.1186/s13059-015-0622-4 - DOI - PMC - PubMed
    1. Barlow D. P., Bartolomei M. S. (2014). Genomic imprinting in mammals. Cold Spring Harb. Perspect. Biol. 6, a018382. 10.1101/cshperspect.a018382 - DOI - PMC - PubMed
    1. Barton S. J., Crozier S. R., Lillycrop K. A., Godfrey K. M., Inskip H. M. (2013). Correction of unexpected distributions of P values from analysis of whole genome arrays by rectifying violation of statistical assumptions. BMC Genomics 14, 161. 10.1186/1471-2164-14-161 - DOI - PMC - PubMed
    1. Benjamini Y., Hochberg Y. (1995). Controlling the false discovery rate: a practical and powerful approach to multiple testing on JSTOR. Source J. R. Stat. Soc. Ser. B 57, 289–300. 10.1111/j.2517-6161.1995.tb02031.x - DOI

LinkOut - more resources