. 2019;1(1):fcz002.
doi: 10.1093/braincomms/fcz002. Epub 2019 Jun 19.

Dysmature superficial white matter microstructure in developmental focal epilepsy

Affiliations

Dysmature superficial white matter microstructure in developmental focal epilepsy

Lauren M Ostrowski et al. Brain Commun. 2019.

Abstract

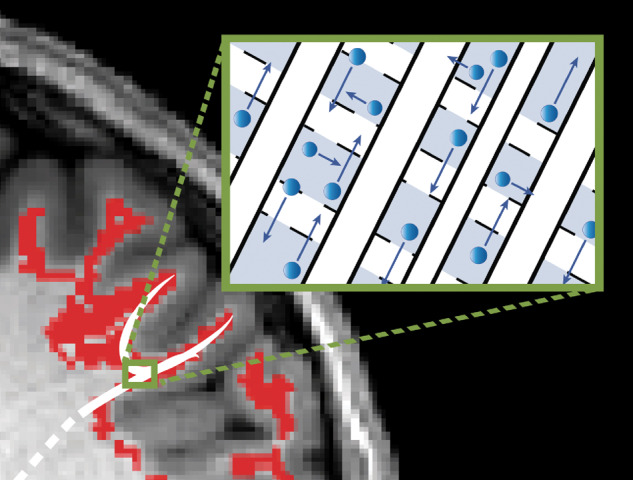
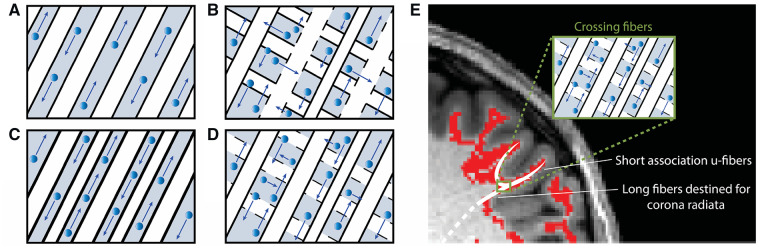
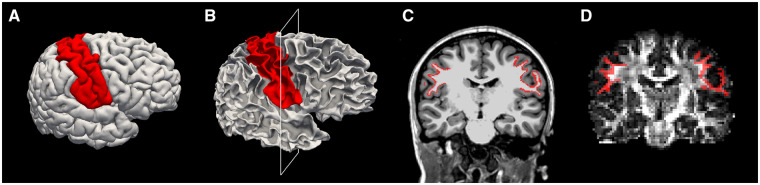
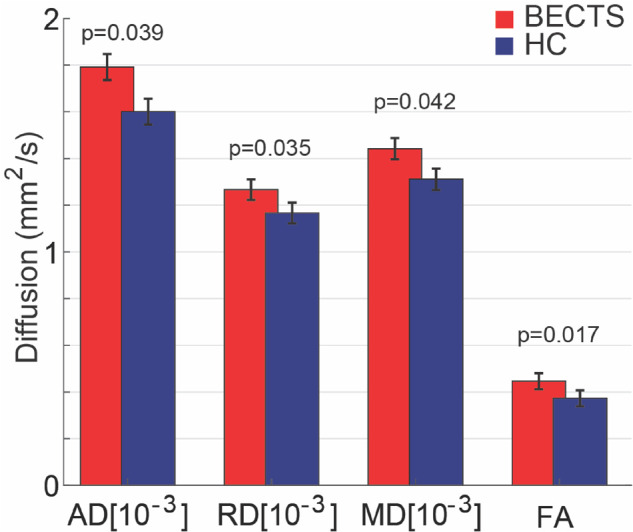
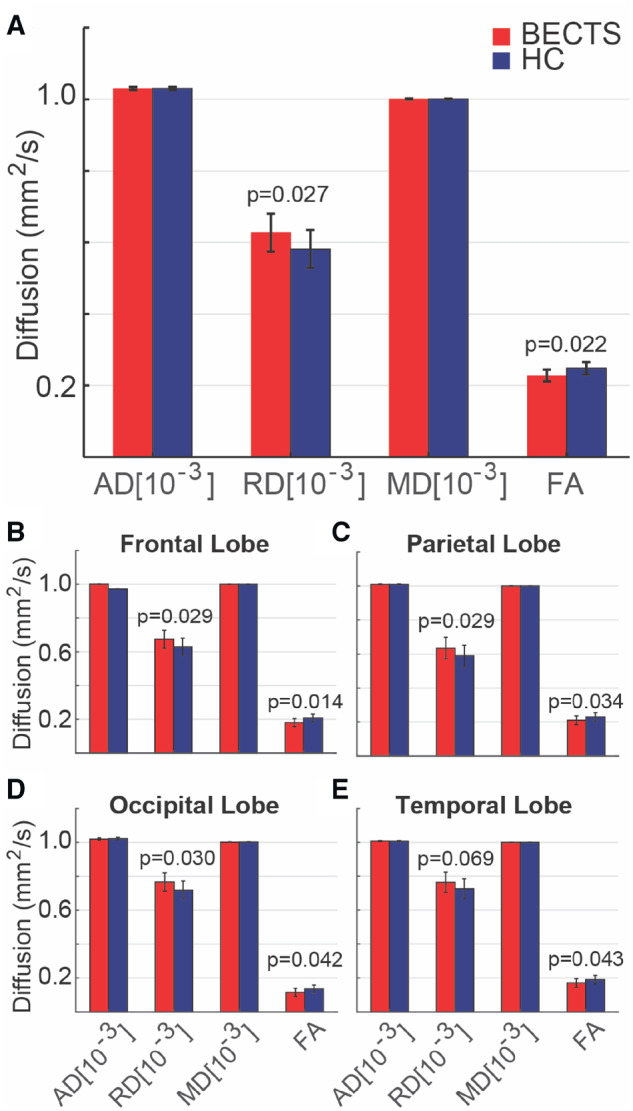
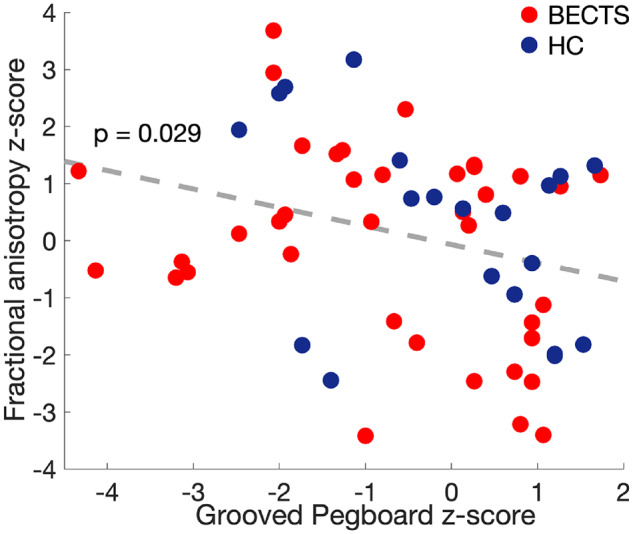
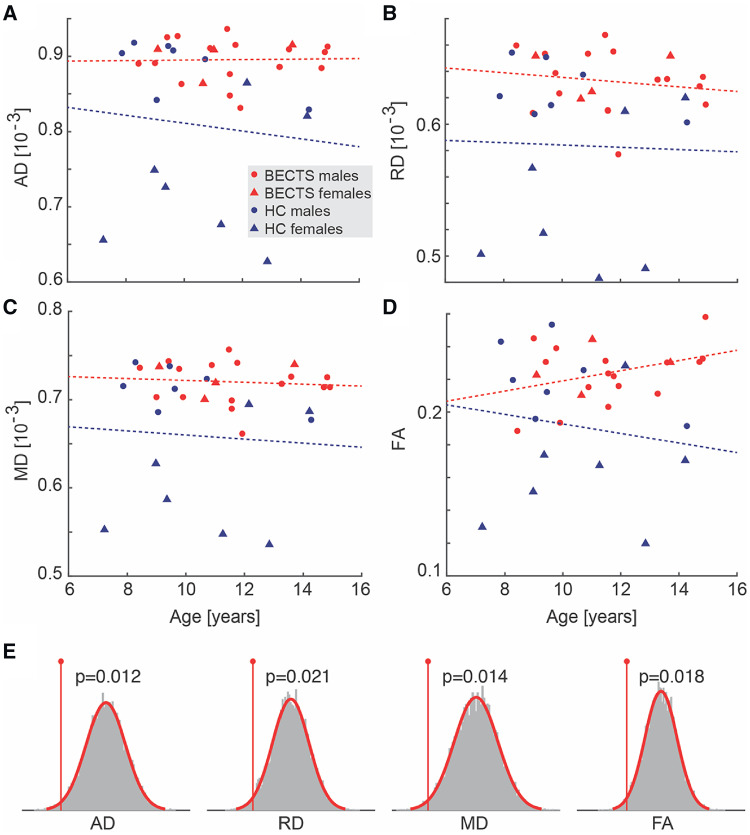
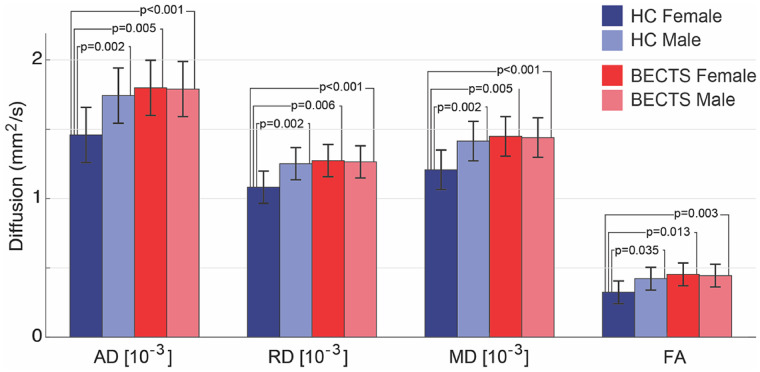
Benign epilepsy with centrotemporal spikes is a common childhood epilepsy syndrome that predominantly affects boys, characterized by self-limited focal seizures arising from the perirolandic cortex and fine motor abnormalities. Concurrent with the age-specific presentation of this syndrome, the brain undergoes a developmentally choreographed sequence of white matter microstructural changes, including maturation of association u-fibres abutting the cortex. These short fibres mediate local cortico-cortical communication and provide an age-sensitive structural substrate that could support a focal disease process. To test this hypothesis, we evaluated the microstructural properties of superficial white matter in regions corresponding to u-fibres underlying the perirolandic seizure onset zone in children with this epilepsy syndrome compared with healthy controls. To verify the spatial specificity of these features, we characterized global superficial and deep white matter properties. We further evaluated the characteristics of the perirolandic white matter in relation to performance on a fine motor task, gender and abnormalities observed on EEG. Children with benign epilepsy with centrotemporal spikes (n = 20) and healthy controls (n = 14) underwent multimodal testing with high-resolution MRI including diffusion tensor imaging sequences, sleep EEG recordings and fine motor assessment. We compared white matter microstructural characteristics (axial, radial and mean diffusivity, and fractional anisotropy) between groups in each region. We found distinct abnormalities corresponding to the perirolandic u-fibre region, with increased axial, radial and mean diffusivity and fractional anisotropy values in children with epilepsy (P = 0.039, P = 0.035, P = 0.042 and P = 0.017, respectively). Increased fractional anisotropy in this region, consistent with decreased integrity of crossing sensorimotor u-fibres, correlated with inferior fine motor performance (P = 0.029). There were gender-specific differences in white matter microstructure in the perirolandic region; males and females with epilepsy and healthy males had higher diffusion and fractional anisotropy values than healthy females (P ≤ 0.035 for all measures), suggesting that typical patterns of white matter development disproportionately predispose boys to this developmental epilepsy syndrome. Perirolandic white matter microstructure showed no relationship to epilepsy duration, duration seizure free, or epileptiform burden. There were no group differences in diffusivity or fractional anisotropy in superficial white matter outside of the perirolandic region. Children with epilepsy had increased radial diffusivity (P = 0.022) and decreased fractional anisotropy (P = 0.027) in deep white matter, consistent with a global delay in white matter maturation. These data provide evidence that atypical maturation of white matter microstructure is a basic feature in benign epilepsy with centrotemporal spikes and may contribute to the epilepsy, male predisposition and clinical comorbidities observed in this disorder.

Keywords: BECTS; DTI; diffusion; rolandic epilepsy; u-fibre.


Figures

Graphical Abstract
Graphical Abstract
Figure 1
Figure 1
Relationship between white matter microstructure and high diffusion metrics. For each schematic, axons are indicated in white, myelin in black borders, interstitial space in grey and water direction and degree of diffusion by blue arrows. (A) AD is the degree of diffusivity in the principle direction of diffusion. Here, axial diffusivity is high due to loosely bundled myelinated axons in parallel orientation, allowing water to diffuse freely in alignment with the axonal fibres. (B) RD is the average diffusivity orthogonal to the direction of principle diffusion and increases with white matter de- or dysmyelination or increased crossing fibres. Here, radial diffusivity is high due to loosely bundled and weakly myelinated (signified by dotted lines) axons and crossing fibres, supporting water diffusion orthogonal to the direction that most axons are aligned. MD (not shown) is the degree of diffusion averaged across all directions, and is also high when both axial and radial diffusivity are high. (C) FA is a variance metric that quantifies the proportion of water diffusion in a preferred direction. Here, fractional anisotropy is high due to strong myelination and dense axonal packing, restricting water to diffuse only in alignment with the axonal fibres. (D) High AD, RD, MD and FA. The superficial white matter adjacent to the seizure onset zone was found to have increased axial, radial and mean diffusion in addition to increased fractional anisotropy. As this region is composed of crossing fibres, these measures most likely reflect loosely packed white matter with a dominant axonal alignment and sparse or poorly myelinated crossing fibres. (E) Schematic of white matter microstructure in perirolandic ROIs. The white matter immediately underneath the perirolandic cortex includes a complex mixture of crossing fibres including long-range fibres destined for the corona radiata and short-range u-fibres integrating primary sensory and motor cortices. Decreased fibre bundling or dysmyelination of the u-fibres (as in D) would result in increased diffusion and FA values in this region.
Figure 2
Figure 2
Example perirolandic u-fibre ROI selection process. (A) Pre- and post-central gyri cortical surfaces were first labelled (red) in structural MRI space using FreeSurfer’s Desikan-Killiany gyral-based atlas. (B) The same labels (red) shown on the surface of the white matter. (C) The labels (red) are shown in a coronal view of a structural MRI, at the cross section identified by the white box in B. (D) To transform the labels to an appropriate volume in diffusion space, the labels were first projected radially into the white matter to capture the thin volume extending from 1 to 1.5 mm radially underlying the cortical surface. After co-registration with diffusion space, all voxels with a minimum of 70% overlap with the label were included in the final ROI. Here, an example coronal slice of the final ROI (red) is shown on a fractional anisotropy map in diffusion space.
Figure 3
Figure 3
Perirolandic u-fibre microstructural characteristics differ in BECTS and HCs. BECTS subjects had increased diffusivity (AD, RD, MD) and FA in the white matter adjacent to the seizure onset zone compared with HCs. Bars (vertical lines) indicate mean (standard deviation) for each measure. (Note that FA is unitless.)
Figure 4
Figure 4
Whole-brain white matter microstructural characteristics differ in BECTS and HCs. (A) BECTS subjects had increased RD and decreased FA in whole-brain white matter, and in the white matter restricted to each brain lobe, compared with HCs [(B) frontal; (C) parietal; (D) occipital; (E) temporal lobe]. Bars (vertical lines) indicate mean (standard deviation) for each measure. (Note that FA is unitless.)
Figure 5
Figure 5
Higher FA values correspond with worse fine motor performance. Scatterplot of contralateral perirolandic u-fibre FA values versus groove pegboard task (GPB) performance in the dominant and non-dominant hands for all subjects (circles). A linear fit to these data (grey-dotted line) reveals a negative relationship.
Figure 6
Figure 6
Gender variability in diffusion and FA values is high in HC and not BECTS subjects. (AD) Scatterplots of raw diffusion and FA values in the perirolandic u-fibre ROIs by group and gender (see legend). Increased variability appears in HCs compared with BECTS subjects, where HC females—but not BECTS females—tend to have lower diffusion and FA values. The red (blue) lines indicate linear fits to the data from BECTS (HC) subjects. (E) Bootstrap distributions of group differences in gender values generated from resampled data. The empirical difference in mean gender values between BECTS and HC data is shown as a red vertical line.
Figure 7
Figure 7
Diffusion and FA values differ between gender and groups. HC males have higher DTI values than HC females. BECTS males and BECTS females have higher DTI values than HC females. Bars (lines) indicate mean (standard deviation) for each measure. (Note that FA is unitless.)

References

    1. Andersen SL. Trajectories of brain development: point of vulnerability or window of opportunity? Neurosci Biobehav Rev 2003; 27: 3–18. - PubMed
    1. Ashtari M, Cervellione KL, Hasan KM, Wu J, McIlree C, Kester H, et al.White matter development during late adolescence in healthy males: a cross-sectional diffusion tensor imaging study. NeuroImage 2007; 35: 501–10. - PubMed
    1. Astradsson A, Olafsson E, Ludvigsson P, Björgvinsson H, Hauser WA.. Rolandic epilepsy: an incidence study in Iceland. Epilepsia 1998; 39: 884–6. - PubMed
    1. Baser CA, Ruff RM.. Construct validity of the San Diego Neuropsychological Test Battery. Arch Clin Neuropsychol 1987; 2: 13–32. - PubMed
    1. Behrens TEJ, Woolrich MW, Jenkinson M, Johansen-Berg H, Nunes RG, Clare S, et al.Characterization and propagation of uncertainty in diffusion-weighted MR imaging. Magn Reson Med 2003; 50:1077–88. - PubMed

LinkOut - more resources