

Individual cristae within the same mitochondrion display different membrane potentials and are functionally independent
- PMID: 31609012
- PMCID: PMC6856616
- DOI: 10.15252/embj.2018101056
Individual cristae within the same mitochondrion display different membrane potentials and are functionally independent
Abstract
The mitochondrial membrane potential (ΔΨm ) is the main driver of oxidative phosphorylation (OXPHOS). The inner mitochondrial membrane (IMM), consisting of cristae and inner boundary membranes (IBM), is considered to carry a uniform ΔΨm . However, sequestration of OXPHOS components in cristae membranes necessitates a re-examination of the equipotential representation of the IMM. We developed an approach to monitor ΔΨm at the resolution of individual cristae. We found that the IMM was divided into segments with distinct ΔΨm , corresponding to cristae and IBM. ΔΨm was higher at cristae compared to IBM. Treatment with oligomycin increased, whereas FCCP decreased, ΔΨm heterogeneity along the IMM. Impairment of cristae structure through deletion of MICOS-complex components or Opa1 diminished this intramitochondrial heterogeneity of ΔΨm . Lastly, we determined that different cristae within the individual mitochondrion can have disparate membrane potentials and that interventions causing acute depolarization may affect some cristae while sparing others. Altogether, our data support a new model in which cristae within the same mitochondrion behave as independent bioenergetic units, preventing the failure of specific cristae from spreading dysfunction to the rest.
Keywords: MICOS complex; Opa1; crista junction; cristae; membrane potential.
© 2019 The Authors. Published under the terms of the CC BY 4.0 license.
Conflict of interest statement
The authors declare that they have no conflict of interest.
Figures

- A
Images of IMM in living HeLa, L6, and H1975 cells, stained with 10‐N‐nonyl acridine orange (NAO). NAO preferentially binds phospholipids in the IMM, such as cardiolipin. Arrowheads indicate cristae in the IMM. Scale bar = 500 nm. N ≥ 3 independent experiments for each cell type.
- B
Mitochondrion cropped from HeLa cell shown in (A) (dashed line) and zoomed in to show cristae, inner boundary membrane (IBM), and matrix (arrows). Scale bar = 100 nm.
- C
H1975 cells transduced with matrix‐targeted DsRed and stained with NAO. Matrix‐targeted DsRed differentiates matrix from cristae stained with NAO. Arrowheads point to cristae. Scale bar = 500 nm. N = 1 independent experiment.
- D
The structure of the IMM in Mic13‐KO cells (HeLa), stained with NAO. The number of cristae is decreased in Mic13‐KO compared to control cells shown in panel (A), labeled with arrowheads. Scale bar = 500 nm. N = 3 independent experiments.
- E, F
Live‐cell imaging of the IMM in control and PTPMT1 KD H1975 cells, a model of cardiolipin deficiency. (E) A gallery of mitochondria from various control H1975 cells expressing scrambled shRNA and stained with NAO, showing cristae (arrowheads). Scale bars = 500 nm. N = 3 independent experiments. (F) A gallery of mitochondria from various H1975 cells expressing PTPMT1 shRNA and stained with NAO. Note the derangement of the ultrastructure (arrowheads). Scale bars = 500 nm. N = 3 independent experiments.

Representative image of Western blot, showing deletion of MIC13 in HeLa cells. N = 3 independent experiments.
Representative image of Western blot, showing deletion of PTPMT1 in H1975 cells. N = 3 independent experiments.
Representative image of Western blot, showing deletion of MIC60 and MIC10 in Hap1 cells. N = 3 independent experiments.
Representative image of Western blot, showing Opa1 KO and Opa1&Drp1 DKO in MEFs. N = 3 independent experiments.

Mitochondria from HeLa cell, co‐stained with NAO and TMRE. Area from dashed white box, zoomed to right, shows the red and green intensities of TMRE and NAO colocalized (arrowheads). Scale bars = 500 nm. N = 3 independent experiments.
Mitochondria in L6 myoblast, co‐stained with NAO and TMRE. Area from dashed white box, zoomed to right, shows colocalizing NAO and TMRE at the cristae membrane (arrowheads). Scale bars = 500 nm. N = 3 independent experiments.
Mitochondria in HeLa cells, stained with NAO alone (top row) vs. NAO + TMRE (bottom row), and simultaneously excited with 488‐ and 561‐nm lasers. Note that, mitochondria stained with NAO alone do not emit noticeable fluorescence in the red channel; only after adding TMRE does strong signal appear in the red channel, showing negligible bleed‐through. Scale bars = 500 nm. N = 2 independent experiments.

Mitochondria in HeLa cells co‐stained with MTG and TMRE. Zoomed‐in region from dashed white box highlights colocalization of dyes, showing that signal intensities vary together across the long axis (green and red lines); arrowheads indicate cristae membranes. Scale bar = 500 nm. N = 3 independent experiments.
Mitochondria in HeLa cell stained with ΔΨm‐dependent dye, Rho123; zoomed‐in mitochondrion cropped from dashed line highlights more intense signal at cristae (arrowheads). Scale bar = 500 nm. N = 3 independent experiments.

Time‐lapse Airyscan imaging of ΔΨm in living HeLa cell, co‐stained with MTG (ΔΨm‐insensitive after loading) and TMRE (ΔΨm sensitive). Arrowhead points to a flickering event where a mitochondrion depolarizes (˜ 9 s) and repolarizes (˜ 16 s), showing that heterogeneous signal from TMRE (but not MTG) disappears and reappears. Scale bar = 500 nm. N = 4 independent experiments.
Quantification of (A). Plot shows average TMRE fluorescence intensity (FI) of cristae (dark red line) vs. matrix (light red line) during the time series. The drop in TMRE FI during the depolarization phase of the flickering is the ΔΨm‐sensitive component of the TMRE signal. The remaining TMRE FI during depolarization can be considered as the ΔΨm‐insensitive portion of TMRE signal. Note that, the remaining TMRE FI after depolarization at the cristae and matrix is approximately identical, indicating that differences in TMRE FI between the cristae and matrix prior to depolarization are derived from differences in ΔΨm. N = 4 independent experiments.
- A
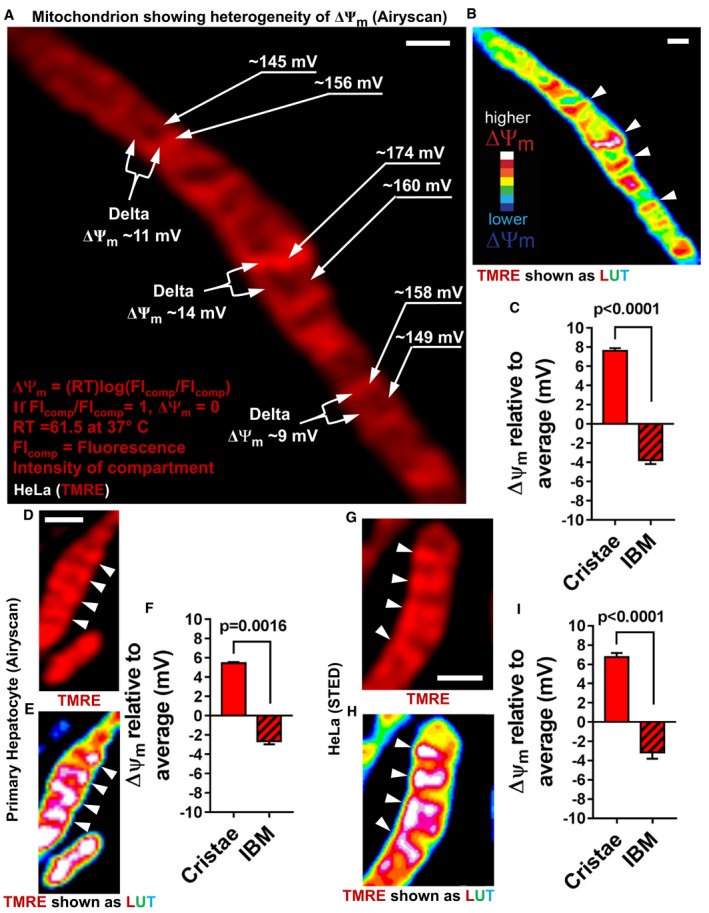
Live‐cell Airyscan image of mitochondrion in HeLa cell, showing different membrane potentials in different mitochondrial regions. Membrane potentials were calculated based on TMRE FI differences between compartments (FIcomp). Regions of interest from cristae and IBM used for ΔΨm calculations are labeled with arrows on the right‐hand side of the mitochondrion, using the cytosol as the reference compartment. Labeled with forks on the left‐hand side of the mitochondrion are the calculations of ΔΨm between individual cristae and their neighboring IBM. Nernst equation used to calculate different voltages. Scale bar = 500 nm.
- B
LUT of mitochondrion in HeLa cell shown in (A), color coding of TMRE FIs on scale of white (most intense) to blue (least intense): LUT scale shown in lower left‐hand corner. Arrowheads indicate cristae. Scale bar = 500 nm. Note that, most‐intense pixels (white) only associate with cristae.
- C
Quantification of ΔΨm (mV) at cristae and IBM relative to the average ΔΨm of the whole mitochondrion, calculated as in (A). Note: ΔΨm at cristae is significantly higher than ΔΨm at IBM, indicating electrochemical boundaries separate these two regions of the IMM. N = 3 independent experiments.
- D–F
Live‐cell Airyscan imaging of mitochondria in cultured primary mouse hepatocytes stained with TMRE. Arrowheads denote cristae. (D) Image showing TMRE‐labeled mitochondria. (E) LUT color coding of TMRE FI. (F) Quantification of ΔΨm differences using Nernst equation as shown in (A). Scale bar = 500 nm. N = 2 independent experiments.
- G–I
Live‐cell STED imaging of mitochondria in HeLa cell stained with TMRM. Arrowheads show cristae. Scale bar = 500 nm. (G) Image showing TMRM‐labeled mitochondrion. (H) LUT color coding of TMRM FI. (I) Quantification of ΔΨm differences using Nernst equation as shown in (A). Scale bar = 500 nm. N = 4 independent experiments. Note that, calculation of ΔΨm differences between the compartments based on images captured by STED and by Airyscan was very similar.

Quantification of total mitochondrial TMRE FI. N = 3 independent experiments.
Quantification of cristae ΔΨm relative to IBM (ΔΨCr‐IBM) in response to oligomycin compared to FCCP. F 1 F 0 ATP Synthase is exclusively localized to the cristae and significant increase in ΔΨCr‐IBM in response to blocking of F 1 F 0 ATP Synthase with oligomycin indicates that differences in TMRE FI between cristae and IBM are driven by oxidative phosphorylation. N = 3 independent experiments.
Representative Airyscan images showing mitochondria from living HeLa cells stained with MTG and TMRE. Cells were first stained for 1 h and only then treated with oligomycin or FCCP. Images show hyperpolarization of cristae under oligomycin (middle row; arrowheads) and depolarization of cristae under FCCP (bottom row; arrowheads) compared to control (top row; arrowheads). Scale bar = 500 nm. N = 3 independent experiments. Note that, the ΔΨm‐independent fraction of TMRE staining is < 5% of the signal in control conditions.
Zoomed‐in region of FCCP‐treated mitochondria in (C). Increased contrast was used to visualize TMRE to compensate for TMRE loss induced by FCCP. These images show diminished heterogeneity of ΔΨCr‐IBM values (arrowheads). Scale bar = 500 nm.

Quantification of mitochondrial circularity, where mitochondria with circularity closer to 1 resemble a circular object and mitochondria with circularity closer to 0 resemble a branched object. Note: FCCP results in significant increase in mitochondrial circularity, consistent with numerous studies indicating FCCP induces fragmentation. N = 3 independent experiments.
Quantification of mitochondrial aspect ratio (a ratio of the long axis of the mitochondrion to the short axis), where mitochondria with an aspect ratio closer to 1 are rounder, whereas mitochondria higher and higher than 1 are increasingly elongated. Note: FCCP also leads to a significant decrease in aspect ratio, indicating loss of membrane potential results in fragmentation. N = 3 independent experiments.

Representative images of mitochondria in control (top row) vs. Mic13‐KO (bottom row) HeLa cells. Note that, TMRE FI in Mic13‐KO mitochondria is distributed more evenly along the IMM, so that ΔΨCr‐IBM is decreased (arrowheads). Scale bar = 500 nm. N = 3 independent experiments.
Quantification of (A), showing deletion of Mic13 in HeLa cells results in significant decrease in ΔΨCr‐IBM. While Mic13‐KO cells show a substantial decrease in cristae number, the loss of cristae does not appear absolute, making it feasible to compare TMRE FI at cristae relative to IBM. N = 3 independent experiments.
Representative images of Hap1 control (top row) vs. Mic60 KO (middle row) and Mic10 KO (bottom row); Mic60‐KO mitochondria show very few cristae structures. TMRE staining along the IMM is relatively homogeneous, indicating decreased ΔΨCr‐IBM. In general, Mic10 KO in Hap1 cells results in decreased TMRE signal intensity at cristae relative to IBM (arrowheads) as compared to control cells. Deletion of Mic10 induces detachment of cristae from IBM (arrows; see Fig 8). Except for the detached cristae vesicles, the TMRE staining is homogeneously distributed in Mic10‐KO cells, indicating decreased ΔΨCr‐IBM. Scale bar = 500 nm. N = 3 independent experiments.
Quantification of (C), showing Mic60 KO in Hap1 cells results in significant decrease in ΔΨCr‐IBM. While Mic60‐KO cells show a marked loss of normal cristae structures, depletion of cristae does not appear absolute, making it possible to compare TMRE FI at cristae relative to IBM. N = 3 independent experiments.
Quantification of (C), showing Mic10 KO in Hap1 cells results in a significant decrease in ΔΨCr‐IBM. Note: quantification of ΔΨm at cristae relative to IBM was performed only on cristae structures that appeared to maintain attachment to IBM. N = 3 independent experiments.

Live‐cell Airyscan images of MEF control (top row) vs. Opa1 KO (bottom row), co‐stained with NAO and TMRE. Arrowheads indicate decreased intensity of TMRE FI at cristae compared to IBM. Note the more even distribution of TMRE staining, indicating the cristae and IBM are relatively equipotential. Scale bar = 500 nm.
Quantification of (A), showing Opa1‐KO MEFs have significantly decreased ΔΨCr‐IBM. N = 3 independent experiments.

Live‐cell Airyscan images of laser‐induced depolarization time series of Mic10 KO Hap1 cell stained with TMRE. Mitochondrion exposed to rapid, high 2‐photon laser power in region of white box, arrow (˜ 0.3 s); large, hyperpolarized vesicle (arrowhead) remains polarized after the rest of the mitochondrion loses ΔΨm, indicating electrochemical discontinuity between hyperpolarized vesicles and the rest of the mitochondrion, including the IBM. Scale bar = 500 nm. N = 2 independent experiments.
Live‐cell Airyscan image of time series showing hyperpolarized vesicles (arrowheads; region cropped from dashed white box) inside mitochondria lacking both Opa1 and Drp1. Scale bar = 500 nm. N = 2 independent experiments. Free movement of hyperpolarized vesicles within the matrix indicate their detachment from the IBM, representing an extreme case of cristae independency within one mitochondrion (see Movie EV1 for time series).

- A
Representative images of laser‐induced depolarization time series from L6 myoblast, stained with ΔΨm‐dependent dye, Rho123. Images show LUT color‐coded for Rho123 FI. White and blue pixels represent most‐ and least‐intense ΔΨm, respectively. See legend of LUT colors on the right. Note that, at the first time point (˜ 0.15 s), white arrow points to box marking area of mitochondrion exposed to phototoxic pulse of 2‐photon laser (≤ 5 ms), inducing depolarization. Ensuing frames show wavelike depolarization away from site of perturbation (arrowheads). Scale bar = 500 nm. N = 3 independent experiments. (See Movie EV2 for time series.)
- B
Profile plot showing Rho123 pixel intensity as function of distance along mitochondrion in (A). Note that, zero value in the x‐axis corresponds to top area of the mitochondrion shown in (A), near site of 2‐photon laser exposure (box). Red line corresponds to frame immediately before depolarization (˜ 0.15 s); green, blue, purple, and dark purple lines correspond to ˜ 0.30, ˜ 0.60, ˜ 1.05, and ˜ 2.10 s, respectively, after initial depolarization, showing wavelike dissipation of ΔΨm over time.
- C–F
Laser‐induced mitochondrial membrane depolarization in living human skin fibroblasts co‐stained with TMRE and MTG and imaged with Airyscan, showing gradual depolarization of elements along the IMM. (C) Time‐lapse images of merged green (MTG) and red (TMRE) channels following laser‐induced mitochondrial membrane depolarization. Note that, at the first time point (0.3 s), white arrow points to box marking area of mitochondrion exposed to phototoxic pulse of 2‐photon laser (≤ 5 ms), inducing depolarization. Depolarization is marked by the dissipation of the ΔΨm‐dependent dye (TMRE) while the green (MTG) signal persists (arrowheads). Scale bar = 1 μm. N = 4 independent experiments. (D) TMRE channel from (C), showing gradual loss of TMRE along the IMM (arrowheads). Note that, although depolarization has largely completed at the area near the phototoxic stimulus already at 0.9 s, some specific regions at the very top maintain ΔΨm while others depolarize. (E) Quantification of ΔΨm using TMRE FI from (C, D). Measurement of TMRE pixel intensities immediately after laser‐induced depolarization at site distal (≥ 10 μm) vs. proximal (≤ 1 μm) to box. N = 4 independent experiments; see specific P values in panel. (F) Quantification of (C, D). Percentage of mitochondria that depolarize in a wavelike (i.e., gradual) vs. instantaneous manner after laser‐induced depolarization. Note: imaging at high temporal resolution (˜ 100–500 ms/frame) reveals wavelike depolarizations predominate, suggesting the ΔΨm is composed of multiple, disparate electrochemical domains along the IMM. The time scale of propagation of depolarization is slower than the propagation of electrical phenomena. N = 4 independent experiments.

- A
Stability of cristae ΔΨCr‐IBM over time. Representative images from time series of HeLa cells co‐stained with MTG and TMRE. Top sequence shows merged green (MTG) and red (TMRE) channels. Bottom sequence shows color‐coded LUT of TMRE signal of the same sequence shown above. White arrowheads in the image point to specific cristae that were measured over time. Scale bar = 500 nm. N = 5 independent experiments.
- B
Quantification of (A), showing average ΔΨCr‐IBM of Cristae “A–D” over time. Note that, Cristae (C) and (D) maintain more than double the ΔΨCr‐IBM of Cristae (A) and (B). Error bars indicate STDEV.
- C
Quantification of (A), showing standard deviation in ΔΨCr‐IBM (mV) of individual cristae over time compared to the standard deviation in ΔΨCr‐IBM (mV) among different cristae along a single mitochondrion. N = 5 independent experiments. Note that, there is less variability in ΔΨCr‐IBM of a single crista over time within the same mitochondrion compared to the variability of ΔΨCr‐IBM among cristae over time, indicating cristae possess unique bioenergetic properties.
- D–G
Airyscan time series of TMRE flickering in HeLa cells co‐stained with MTG and TMRE, showing that depolarization is uncoordinated along the IMM with some cristae depolarizing while neighboring cristae remain polarized. (D) Representative live‐cell Airyscan image from time series showing merged green (MTG) and red (TMRE) channels. Area marked by dashed box is shown in the time series in (E). Scale bar = 500 nm. (E) Time series of cropped region from (D), showing tip of mitochondrion (arrowhead) maintaining ΔΨm while neighboring region of same mitochondrion depolarizes. The capacity of some cristae to maintain polarity, while adjacent cristae transiently depolarize, indicates cristae can exhibit a significant amount of electrochemical autonomy. Scale bar = 500 nm. N = 3 independent experiments. (See [Link], [Link] for time series). (F) Zoomed‐in LUT of mitochondrion from (E) (˜ 2 s), showing some cristae remaining polarized (red) while adjacent cristae depolarize (blue). (See Movie EV5 for time series). Scale bar = 100 nm. (G) Quantification of (D–F), showing that during a flickering event, some cristae maintain their membrane potentials, while other cristae depolarize, resulting in large differences in ΔΨCr‐IBM along the individual mitochondrion. N = 3 independent experiments.

An equipotential representation of the IMM. In this model, the IMM functions as a continuous electrical cable where cristae and IBM have similar ΔΨm and where all cristae respond simultaneously to any change in ΔΨm occurring in the mitochondrion where they reside. Transition from a hetero‐potential to an equipotential, via cleavage of Opa1, for example, could play a role in normal mitochondrial physiology when high conductance and low ATP synthesis are favored, such as thermogenesis or adaptation to excess nutrient.
Cartoon showing IMM as equipotential.
Model of mitochondrial hetero‐potential, showing cristae as individual bioenergetic units. Electrochemical autonomy of cristae protects the mitochondrion confronting a bioenergetic crisis, where dysfunction of one or more cristae would not inevitably cause the entire organelle to fail. In this model, cristae and IBM can have different membrane potentials. Closed CJs generate significant differences in charge between the cristae membranes and IBM, which could be related to the concentration of ETC subunits in the lateral side of the cristae and F 1 F 0 ATP Synthase on the cristae rims.
Cartoon showing IMM as hetero‐potential.
Comment in
-
Mitochondrial cristae as insulated transformers of metabolic energy.EMBO J. 2019 Nov 15;38(22):e103472. doi: 10.15252/embj.2019103472. Epub 2019 Oct 16. EMBO J. 2019. PMID: 31617600 Free PMC article.
References
-
- Amati‐Bonneau P, Valentino ML, Reynier P, Gallardo ME, Bornstein B, Boissiere A, Campos Y, Rivera H, de la Aleja JG, Carroccia R et al (2008) OPA1 mutations induce mitochondrial DNA instability and optic atrophy ‘plus’ phenotypes. Brain 131: 338–351 - PubMed
-
- Barbot M, Jans DC, Schulz C, Denkert N, Kroppen B, Hoppert M, Jakobs S, Meinecke M (2015) Mic10 oligomerizes to bend mitochondrial inner membranes at cristae junctions. Cell Metab 21: 756–763 - PubMed
-
- Barrera M, Koob S, Dikov D, Vogel F, Reichert AS (2016) OPA1 functionally interacts with MIC60 but is dispensable for crista junction formation. FEBS Lett 590: 3309–3322 - PubMed
Publication types
MeSH terms
Substances
Grants and funding
LinkOut - more resources
Full Text Sources
Other Literature Sources
Medical
Research Materials
