. 2019 Oct 14:8:e49464.
doi: 10.7554/eLife.49464.

β-blockers augment L-type Ca2+ channel activity by targeting spatially restricted β2AR signaling in neurons

Affiliations

β-blockers augment L-type Ca2+ channel activity by targeting spatially restricted β2AR signaling in neurons

Ao Shen et al. Elife. .

Abstract

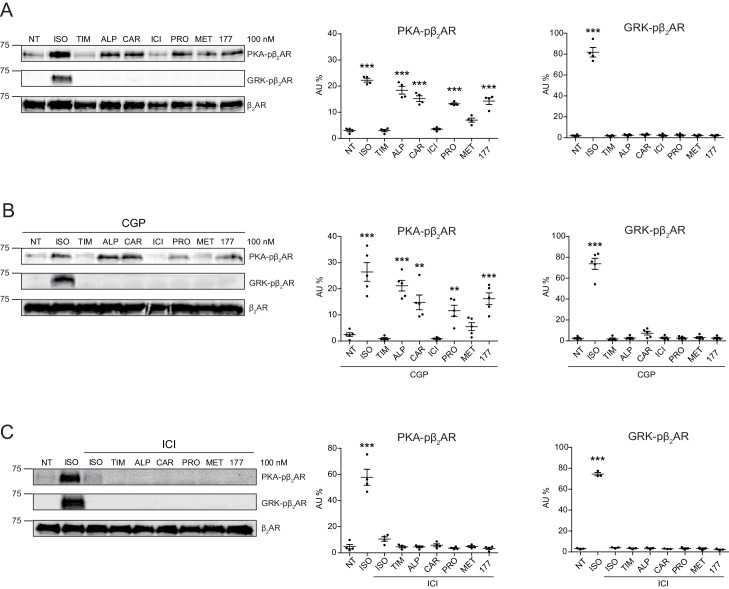
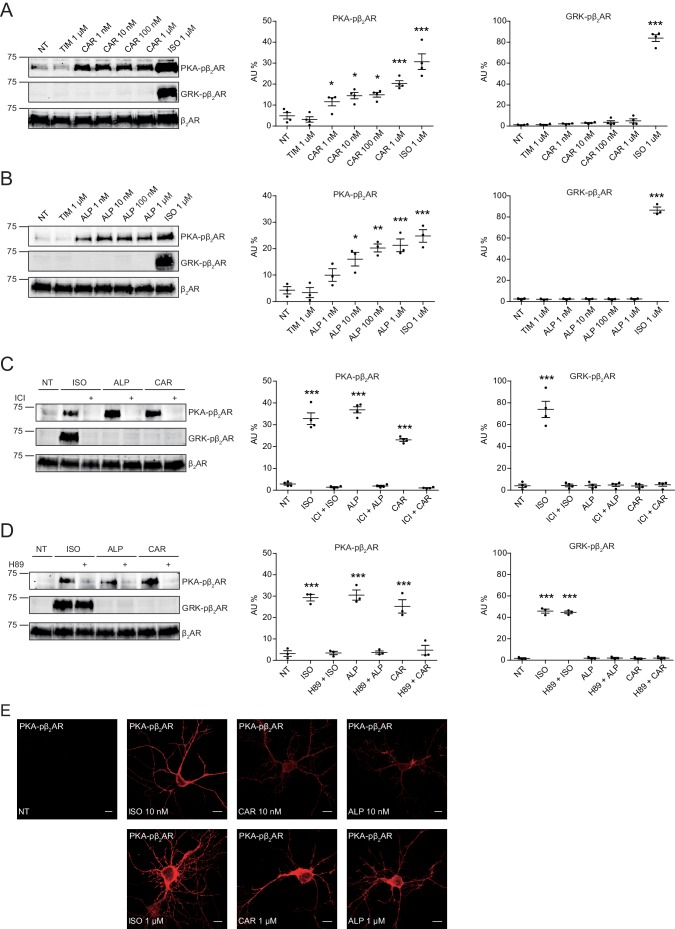
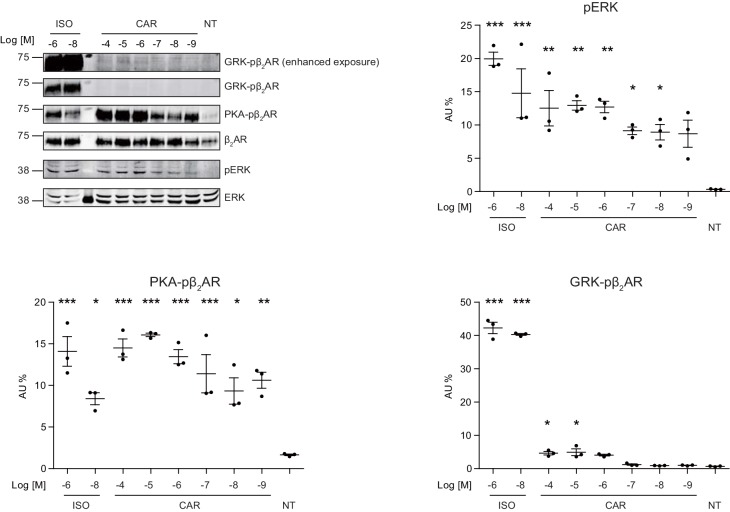
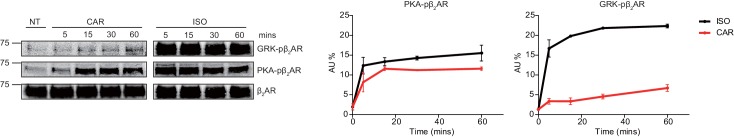
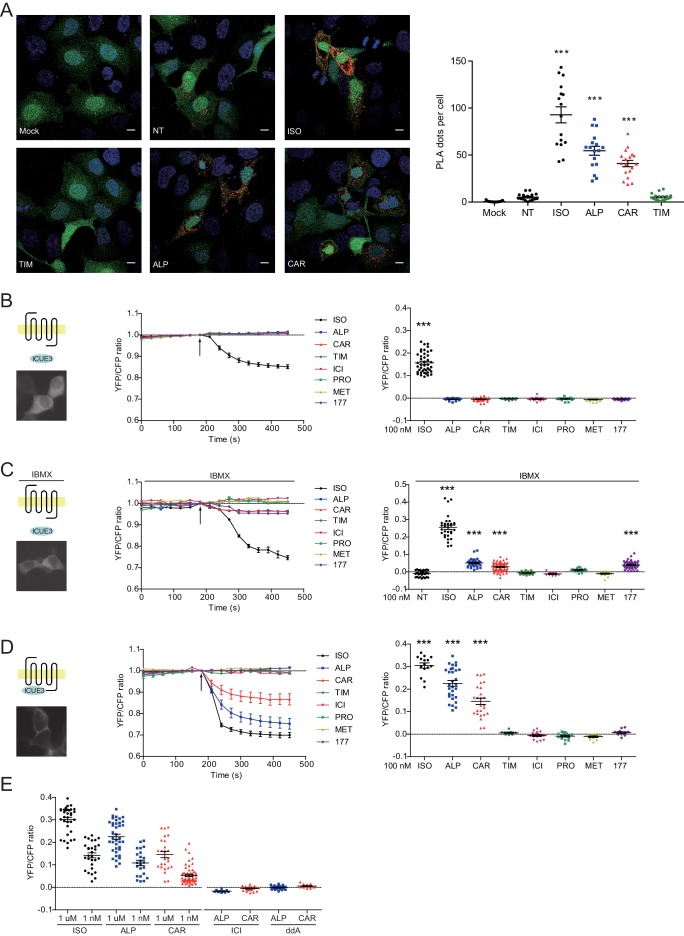
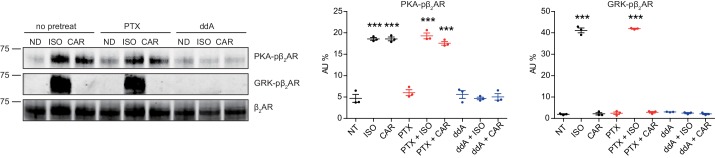
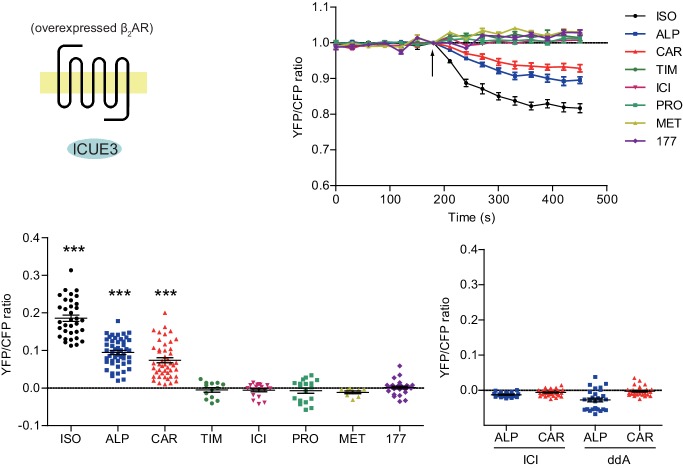
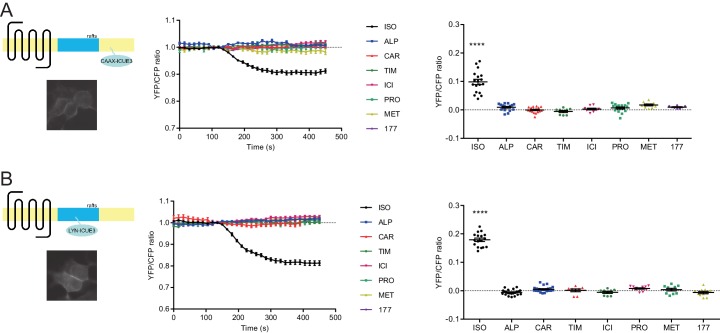
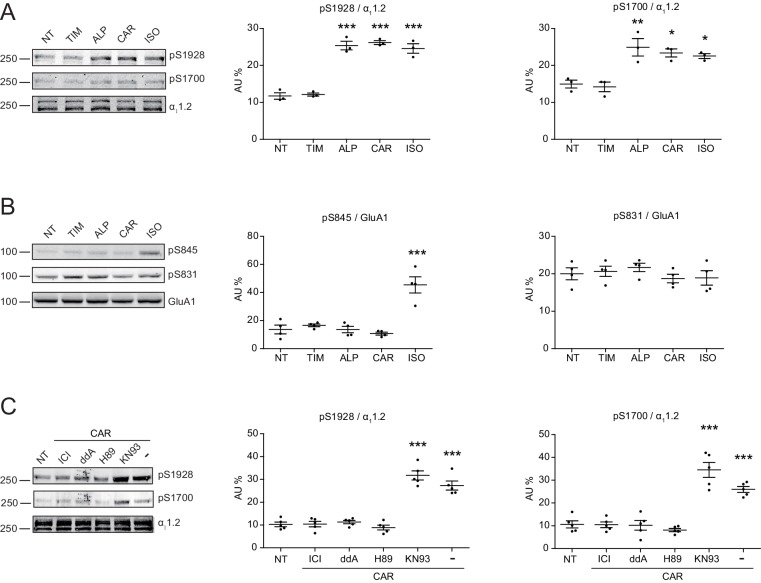
G protein-coupled receptors (GPCRs) transduce pleiotropic intracellular signals in mammalian cells. Here, we report neuronal excitability of β-blockers carvedilol and alprenolol at clinically relevant nanomolar concentrations. Carvedilol and alprenolol activate β2AR, which promote G protein signaling and cAMP/PKA activities without action of G protein receptor kinases (GRKs). The cAMP/PKA activities are restricted within the immediate vicinity of activated β2AR, leading to selectively enhance PKA-dependent phosphorylation and stimulation of endogenous L-type calcium channel (LTCC) but not AMPA receptor in rat hippocampal neurons. Moreover, we have engineered a mutant β2AR that lacks the catecholamine binding pocket. This mutant is preferentially activated by carvedilol but not the orthosteric agonist isoproterenol. Carvedilol activates the mutant β2AR in mouse hippocampal neurons augmenting LTCC activity through cAMP/PKA signaling. Together, our study identifies a mechanism by which β-blocker-dependent activation of GPCRs promotes spatially restricted cAMP/PKA signaling to selectively target membrane downstream effectors such as LTCC in neurons.

Keywords: cell biology; hippocampus; ion channel; mouse; rat; signaling transduction.


Conflict of interest statement

AS, DC, MK, PB, BX, QS, JM, KM, MN, JH, MN, XY, YX No competing interests declared

Figures

Figure 1.
Figure 1.. Carvedilol and alprenolol selectively promote phosphorylation of β2AR at PKA sites.
HEK293 cells stably expressing FLAG-tagged β2AR were either directly stimulated for 5 min with the βAR agonist ISO or different β-blockers at indicated concentrations (A) n = 4), or pretreated for 15 min with 1 μM β1AR antagonist CGP20712A (B) n = 5) or 10 μM β2AR antagonist ICI118551 (C) n = 4) before the treatment. The phosphorylation of β2AR on its PKA and GRK sites were determined with phospho-specific antibodies, and signals were normalized to total β2AR detected with anti-FLAG antibody. NT, no treatment; ISO, isoproterenol; TIM, timolol; ALP, alprenolol; CAR, carvedilol; ICI, ICI118551; PRO, propranolol; MET, metoprolol; 177, CGP12177; CGP, CGP20712A. Error bars denote s.e.m., P values are computed by one-way ANOVA followed by Tukey’s test between NT and other groups.
Figure 1—figure supplement 1.
Figure 1—figure supplement 1.. Uncropped blots for Figure 1.
(A) Uncropped blots corresponding to Figure 1A. (B) Uncropped blots corresponding to Figure 1B. (C) Uncropped blots corresponding to Figure 1C. Red box indicates the crop region displayed in main figure.
Figure 2.
Figure 2.. Carvedilol and alprenolol induce concentration-dependent PKA phosphorylation of β2AR in HEK293 and hippocampal neurons.
HEK293 cells stably expressing FLAG-tagged β2AR were treated with increasing concentrations of CAR (A) n = 4) and ALP (B) n = 3), or pretreated for 15 min with 10 μM β2AR antagonist ICI118551 (C) n = 4) and PKA inhibitor H89 (D) n = 3) before stimulated with 1 μM indicated drugs for 5 min. The phosphorylation of β2AR on its PKA and GRK sites were determined with phospho-specific antibodies, and signals were normalized to total β2AR detected with anti-FLAG antibody. Experiments were performed in the presence of 1 μM β1AR-selective antagonist CGP20712A to block endogenous β1AR signaling. NT, no treatment; ISO, isoproterenol; ALP, alprenolol; CAR, carvedilol; ICI, ICI118551. Error bars denote s.e.m., P values are computed by one-way ANOVA followed by Tukey’s test between NT and other groups. (E) Rat hippocampal neurons expressing β2AR were treated for 5 min with 10 nM or 1 μM indicated drugs on 12 days in vitro (DIV), and immuno-stained for PKA-phosphorylated β2AR. Confocal images show PKA-phosphorylated β2AR in agonist- or β-blocker-stimulated neurons have similar distribution. Scale bar, 10 μm. Representative of 6 images for each condition, three experiments.
Figure 2—figure supplement 1.
Figure 2—figure supplement 1.. Uncropped blots for Figure 2.
(A) Uncropped blots corresponding to Figure 2A. (B) Uncropped blots corresponding to Figure 2B. (C) Uncropped blots corresponding to Figure 2C. (D) Uncropped blots corresponding to Figure 2D. Red box indicates the crop region displayed in main figure.
Figure 2—figure supplement 2.
Figure 2—figure supplement 2.. Phosphorylation of ERK and β2AR at different drug concentrations.
HEK293 cells stably expressing FLAG-tagged β2AR were stimulated by isoproterenol (ISO) or carvedilol (CAR) for 30 min with indicated concentrations. Cell lysates were analyzed for PKA-phosphorylated β2AR, GRK-phosphorylated β2AR, total β2AR, pERK, and total ERK by western blot. P values are computed by one-way ANOVA followed by Tukey’s test between NT and other groups. Data are the mean ± s.e.m. of three experiments.
Figure 2—figure supplement 3.
Figure 2—figure supplement 3.. GRK-phosphorylation of β2AR at different carvedilol treated times.
HEK293 cells stably expressing FLAG-tagged β2AR were stimulated by 1 μM isoproterenol (ISO) or carvedilol (CAR) for indicated times. Cell lysates were analyzed for PKA-phosphorylated β2AR, GRK-phosphorylated β2AR, total β2AR by western blot. P values are computed by one-way ANOVA followed by Tukey’s test between NT and other groups. Data are the mean ± s.e.m. of four experiments.
Figure 3.
Figure 3.. Carvedilol and alprenolol promote Gsα recruitment to β2AR and increase spatially restricted cAMP signal.
(A) HEK293 cells co-expressing FLAG-tagged β2AR, HA-tagged Gsα and EGFP were stimulated with 100 nM ISO or indicated β-blockers for 5 min. In proximity ligation assay (PLA), cells were immuno-stained with HA and β2AR antibody, nuclei were counterstained with DAPI. The green EGFP signal represents transfected cells, and red PLA signal represents Gsα and β2AR interactions. Carvedilol and alprenolol promoted Gsα recruitment to β2AR, but timolol could not. Scale bar, 10 μm. Representative of n = 15, 16, 16, 17, 18 and 18 images respectively, three experiments. (B–C) HEK293 cells expressing ICUE3 biosensor were treated with 1 μM ISO or indicated β-blockers (B), or together with 100 μM phosphodiesterase inhibitor IBMX (C). (D–E) HEK293 cells expressing β2AR-ICUE3 biosensor were treated with indicated concentration of ISO or β-blockers. In some cases, cells were pretreated for 30 min with the β2AR antagonist ICI (10 μM) or the adenylate cyclase inhibitor ddA (50 μM) before adding β-blockers. Changes in ICUE3 FRET ratio (an indication of cAMP activity) were measured. Experiments were performed in the presence of 1 μM β1AR-selective antagonist CGP20712A to block endogenous β1AR signaling. Mock, no primary antibody; NT, no treatment; ISO, isoproterenol; TIM, timolol; ALP, alprenolol; CAR, carvedilol; ICI, ICI118551; PRO, propranolol; MET, metoprolol; 177, CGP12177, IBMX, 3-isobutyl-1-methylxanthine; ddA, 2',5'-dideoxyadenosine. Each dot in the scatter dot plot in B–E represents a value from an individual tested cell. Error bars denote s.e.m., P values are computed by one-way ANOVA followed by Tukey’s test between NT (A) or TIM (B–E) and other groups.
Figure 3—figure supplement 1.
Figure 3—figure supplement 1.. Carvedilol-induced β2AR phosphorylation is AC-dependent.
HEK293 cells stably expressing FLAG-tagged β2AR were pretreated with the Gi inhibitor pertussis toxin (PTX, 200 ng/ml, 16 hr) or the adenylate cyclase inhibitor 2',5'-dideoxyadenosine (ddA, 50 μM, 30 min) and then stimulated with 100 nM isoproterenol (ISO) or carvedilol (CAR) for 5 min. The phosphorylation levels of β2AR on its PKA and GRK sites were determined with phospho-specific antibodies, and signals were normalized to total β2AR detected with anti-FLAG antibody. Experiments were performed in the presence of 1 μM β1AR-selective antagonist CGP20712A to block endogenous β1AR signaling. P values are computed by one-way ANOVA followed by Tukey’s test between no drug (ND) and other drugs within the same group. Data are the mean ± s.e.m. of three experiments.
Figure 3—figure supplement 2.
Figure 3—figure supplement 2.. Carvedilol- and alprenolol-induced cAMP can be abolished by β2AR or AC inhibition.
The cAMP biosensor ICUE3 and FLAG-β2AR were co-expressed in HEK293 cells. Cells were treated with 100 nM βAR agonist ISO or different β-blockers, and changes in cAMP FRET ratio were measured. In some cases, cells were pretreated for 30 min with the β2AR antagonist ICI (10 μM) or the adenylate cyclase inhibitor ddA (50 μM) before adding β-blockers. Experiments were performed in the presence of 1 μM β1AR-selective antagonist CGP20712A to block endogenous β1AR signaling. ISO, isoproterenol; TIM, timolol; ALP, alprenolol; CAR, carvedilol; ICI, ICI118551; PRO, propranolol; MET, metoprolol; 177, CGP12177; ddA, 2',5'-dideoxyadenosine. Each dot in the scatter dot plot represents a value from an individual tested cell. Error bars denote s.e.m. P values are computed by one-way ANOVA followed by Tukey’s test between TIM and other groups.
Figure 3—figure supplement 3.
Figure 3—figure supplement 3.. Carvedilol- and alprenolol-induced cAMP are highly restricted.
HEK293 cells expressing either CAAX-ICUE3 targeted to non-rafts regions of the plasma membrane (A) or LYN-ICUE3 targeted to rafts regions of the plasma membrane (B) were treated with 1 μM ISO or indicated β-blockers. Changes in ICUE3 FRET ratio (an indication of cAMP activity) were measured. Carvedilol- and alprenolol-induced cAMP could be detected neither by CAAX-ICUE3 nor LYN-ICUE3. ISO, isoproterenol; TIM, timolol; ALP, alprenolol; CAR, carvedilol; ICI, ICI118551; PRO, propranolol; MET, metoprolol; 177, CGP12177. Each dot in the scatter dot plot represents a value from an individual tested cell. Error bars denote s.e.m., P values are computed by one-way ANOVA followed by Tukey’s test between TIM and other groups.
Figure 4.
Figure 4.. Carvedilol promotes endogenous β2AR-dependent phosphorylation of LTCC α11.2 by PKA in neurons.
(A) Rat neurons on 10–14 days in vitro (DIV) were treated for 5 min with 1 μM indicated drugs. The phosphorylation of endogenous LTCC α11.2 subunit was determined with phospho-specific antibodies, and normalized to total α11.2, n = 3. (B) Rat neurons on 10–14 DIV were treated for 5 min with 1 μM indicated drugs. The phosphorylation of endogenous AMPAR GluA1 subunit was determined with phospho-specific antibodies, and signals were normalized to total GluA1, n = 4. (C) Neurons were pretreated for 30 min with 10 μM β2AR inhibitor ICI, 50 μM AC inhibitor ddA, 10 μM PKA inhibitor H89 or 10 μM CaMKII inhibitor KN93 and then stimulated with 1 μM CAR for 5 min. Carvedilol-induced LTCC phosphorylation depends on endogenous β2AR, AC and PKA, but not CaMKII, n = 5. NT, no treatment; ISO, isoproterenol; TIM, timolol; ALP, alprenolol; CAR, carvedilol. Error bars denote s.e.m., P values are computed by one-way ANOVA followed by Tukey’s test between NT and other groups.
Figure 4—figure supplement 1.
Figure 4—figure supplement 1.. Uncropped blots for Figure 4.
(A) Uncropped blots corresponding to Figure 4A. (B) Uncropped blots corresponding to Figure 4B. (C) Uncropped blots corresponding to Figure 4C. Red box indicates the crop region displayed in main figure.
Figure 5.
Figure 5.. Carvedilol augments LTCC CaV1.2 channel activity in neurons.
(A) Representative single channel recordings of LTCC CaV1.2 currents using 110 mM Ba2+ as charge carrier in rat hippocampal neurons on 7–10 days in vitro (DIV) after depolarization from −80 (hp) to 0 mV (tp) in control patches (NT), patches containing 1 μM isoproterenol (ISO), 1 μM carvedilol (CAR) or 1 μM timolol (TIM) in the patch pipette or after addition of 1 μM CAR to the bath while the patch pipette contained a control pipette solution (CAR_out). Shown are 20 consecutive sweeps from representative experiments. Arrows throughout the figure indicate the 0-current level (closed channel). Scale bar denotes 2 pA and 200 ms. (B) Ensemble average currents as determined from all sweeps recorded for all the experimental conditions. Scale bar denotes 50 fA and 400 ms. (C–E) Mean ± s.e.m. for (C) Po (%), (D) availability (i.e. likelihood that a sweep had at least one event) (%) and (E) the mean ensemble average current (fA) for each experimental condition. *p<0.05 with Kruskal Wallis – Dunn’s multiple comparison test. Sweep and n numbers as well as summary statistics are in Supplementary file 1. (F) Ensemble Po versus time measurements obtained with a pipette backfilled with 1 μM CAR. The solid dark line represents the mean Po over time and the gray area is the s.e.m. at each time point. The mean line was smoothed to 15 neighbors on each size with a second order polynomial smoothing in PRISM for representation purposes only. (G) Mean Po of the first 30 traces versus the last 30 traces obtained with a pipette backfilled with 1 μM CAR. The gray boxes highlight the mean on each group. n = 11 patches. *p<0.05 with Mann-Whitney test.
Figure 5—figure supplement 1.
Figure 5—figure supplement 1.. Over-time effect of carvedilol on LTCC of neurons recorded in the cell attached configuration without using BayK.
Cells were depolarized with 110 mM Ba2+ for 2 s from a holding potential of −80 mV to 0 mV and the NPopen was determined over time. (A) Diagram reflecting our patch statistics without using BayK in the recording pipette. Only about 30% of our patches showed channel activity. Cells with >5% channel availability within the first 50 sweeps were considered for our analysis. Cells with <5% availability were consequently excluded for pharmacological testing. (B) Control experiment demonstrating the effect of 1 µM isoproterenol applied through bath perfusion (n = 11 cells). (C) Over-time effect of 1 µM carvedilol applied through backfilling of the recording pipette (n = 8 cells). Tip filling was performed with pipette solution containing no carvedilol. (D) Experiment showing the effect of 1 µM carvedilol perfused into the bath solution (n = 8 cells).
Figure 5—figure supplement 2.
Figure 5—figure supplement 2.. Inhibition of β2AR or LTCC counteracts carvedilol-induced cell death of cultured cortical neurons.
Rat cortical neurons on 7 days in vitro (DIV) were incubated overnight in fresh medium with or without 2 mM Ca2+ (no Ca2+), cells were then either mock treated (NT), or treated with 1 μM indicated drugs. CAR, carvedilol; CGP, CGP20712A; TIM, timolol; ISR, isradipine. MTT assay was carried out at 48 hr post drug treatment and absorbance at 540 nM was measured. The first NT well in each plate was set as basal and all the other groups were normalized to that well. The lysed group had medium removed to represent nearly 100% cell death condition. CAR show decreased cell viability, β1AR antagonist CGP does not prevent the carvedilol-induced reduction of cell viability but β1AR/β2AR antagonist TIM or LTCC blocker ISR does. Data are the mean ± s.e.m. of three individual plates. P values are computed by one-way ANOVA followed by Tukey’s test between NT and other groups.
Figure 6.
Figure 6.. A mutant β2AR is selectively activated by carvedilol but not isoproterenol.
(A) Schematic of an engineered β2AR with S204/207A double serine mutations that loses high affinity binding to ISO but not CAR at nanomolar range. (B) cAMP biosensor ICUE3 and β2AR wild-type (WT) or mutant were co-expressed in MEF cells lacking both β1AR and β2AR. Changes of cAMP FRET ratio by increasing concentrations of ISO or CAR were measured. n = 5–29 cells. (C–D) HEK293 cells stably expressing FLAG-tagged β2AR WT or mutant were stimulated for 5 min with increasing concentrations of ISO (C), n = 7) or CAR (D), n = 5). The phosphorylation of β2AR on its PKA and GRK sites were determined with phospho-specific antibodies, and signals were normalized to total β2AR detected with anti-FLAG antibody. Experiments were performed in the presence of 1 μM β1AR-selective antagonist CGP20712A to block endogenous β1AR signaling. NT, no treatment; ISO, isoproterenol; CAR, carvedilol. Error bars denote s.e.m., P values are computed by one-way ANOVA followed by Tukey’s test between NT and other concentrations.
Figure 6—figure supplement 1.
Figure 6—figure supplement 1.. Uncropped blots for Figure 6C and D.
(A) Uncropped blots corresponding to Figure 6C. (B) Uncropped blots corresponding to Figure 6D. Red box indicates the crop region displayed in main figure.
Figure 7.
Figure 7.. The β2AR mutant selectively supports carvedilol-induced augmentation of LTCC activity in neurons.
(A–B) β1AR/β2AR double knockout (DKO) mouse hippocampal neurons on 7–10 days in vitro (DIV) were cotransfected with FLAG-tagged β2AR WT (A) or mutant (B) and HA-tagged LTCC α11.2 subunit, 24 hr later cells were either mock treated (NT), or treated for 5 min with 10 nM isoproterenol (ISO) or carvedilol (CAR), fixed and labeled with anti-FLAG and a phospho-specific antibody for S1928 phosphorylated α11.2. Confocal images show mutant β2AR losts the ability of promoting LTCC phosphorylation upon ISO stimulation but remained the ability upon CAR stimulation in neurons. Scale bar, 10 μm. Representative of 6 images for each condition, three experiments. (C) Representative single channel recordings of LTCC CaV1.2 currents using 110 mM Ba2+ as charge carrier in DKO neurons on 7–10.days DIV expressing mutant β2AR after depolarization from −80 to 0 mV in in control patches (mutant) and patches containing 1 μM isoproterenol (ISO) or 1 μM carvedilol (CAR) in the patch pipette. Shown are 20 consecutive sweeps from representative experiments. Arrows throughout the figure indicate the 0-current level (closed channel). Scale bar denotes 2 pA and 200 ms. (D) Ensemble average currents as determined from all sweeps recorded for all the experimental conditions. Scale bar denotes 50 fA and 400 ms. (E–G) Mean ± s.e.m. for (E) Po (%), (F) availability (i.e. likelihood that a sweep had at least one event) (%) and (G) the mean ensemble average current (fA) for each experimental condition. *p<0.05 with Kruskal Wallis – Dunn’s multiple comparison test. Sweep and n numbers as well as summary statistics are in Supplementary file 2.
Figure 7—figure supplement 1.
Figure 7—figure supplement 1.. The mutant β2AR is selectively activated by carvedilol and promotes LTCC phosphorylation in neurons.
β1AR/β2AR double knockout (DKO) hippocampal mouse neurons at 7–10 days in vitro (DIV) were cotransfected with FLAG-tagged β2AR WT (A) or mutant (B) and HA-tagged LTCC α11.2 subunit, 24 hr later cells were treated for 5 min with 1 μM ISO or CAR, fixed and labeled with anti-FLAG and a phospho-specific antibody for S1928 phosphorylated α11.2. Confocal images show mutant β2AR lost the ability of promoting LTCC phosphorylation upon ISO stimulation but remained the ability upon CAR stimulation in mouse neurons. Scale bar, 10 μm. Representative of n = 4, 6, 5 and 6 cells, respectively, three experiments.

References

    1. Bakris G. An in-depth analysis of vasodilation in the management of hypertension: focus on adrenergic blockade. Journal of Cardiovascular Pharmacology. 2009;53:379–387. doi: 10.1097/FJC.0b013e31819fd501. - DOI - PubMed
    1. Beaudoin GM, Lee SH, Singh D, Yuan Y, Ng YG, Reichardt LF, Arikkath J. Culturing pyramidal neurons from the early postnatal mouse Hippocampus and cortex. Nature Protocols. 2012;7:1741–1754. doi: 10.1038/nprot.2012.099. - DOI - PubMed
    1. Brixius K, Bundkirchen A, Bölck B, Mehlhorn U, Schwinger RH. Nebivolol, bucindolol, metoprolol and carvedilol are devoid of intrinsic sympathomimetic activity in human myocardium. British Journal of Pharmacology. 2001;133:1330–1338. doi: 10.1038/sj.bjp.0704188. - DOI - PMC - PubMed
    1. Cervantes D, Crosby C, Xiang Y. Arrestin orchestrates crosstalk between G protein-coupled receptors to modulate the spatiotemporal activation of ERK MAPK. Circulation Research. 2010;106:79–88. doi: 10.1161/CIRCRESAHA.109.198580. - DOI - PMC - PubMed
    1. Chen Y, Stevens B, Chang J, Milbrandt J, Barres BA, Hell JW. NS21: re-defined and modified supplement B27 for neuronal cultures. Journal of Neuroscience Methods. 2008;171:239–247. doi: 10.1016/j.jneumeth.2008.03.013. - DOI - PMC - PubMed

Publication types