

Improving the phenotype risk score as a scalable approach to identifying patients with Mendelian disease
- PMID: 31609419
- PMCID: PMC6857501
- DOI: 10.1093/jamia/ocz179
Improving the phenotype risk score as a scalable approach to identifying patients with Mendelian disease
Abstract
Objective: The Phenotype Risk Score (PheRS) is a method to detect Mendelian disease patterns using phenotypes from the electronic health record (EHR). We compared the performance of different approaches mapping EHR phenotypes to Mendelian disease features.
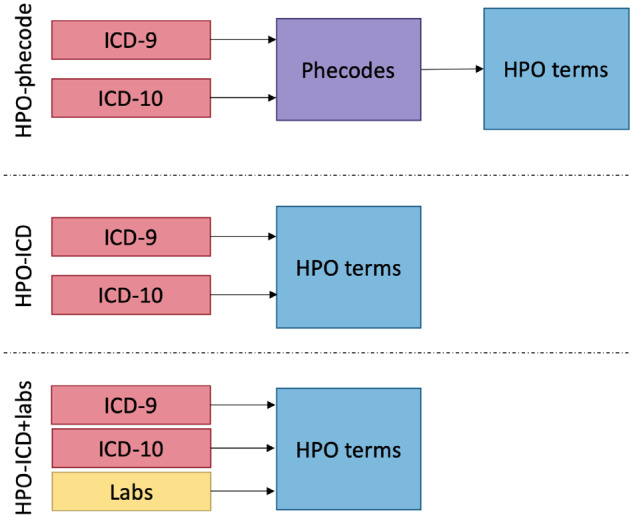
Materials and methods: PheRS utilizes Mendelian diseases descriptions annotated with Human Phenotype Ontology (HPO) terms. In previous work, we presented a map linking phecodes (based on International Classification of Diseases [ICD]-Ninth Revision) to HPO terms. For this study, we integrated ICD-Tenth Revision codes and lab data. We also created a new map between HPO terms using customized groupings of ICD codes. We compared the performance with cases and controls for 16 Mendelian diseases using 2.5 million de-identified medical records.
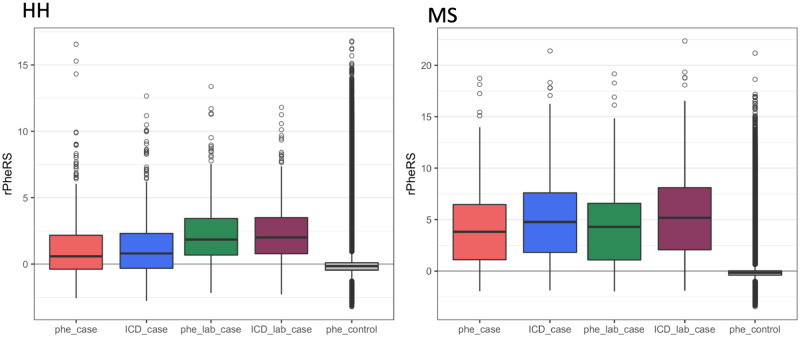
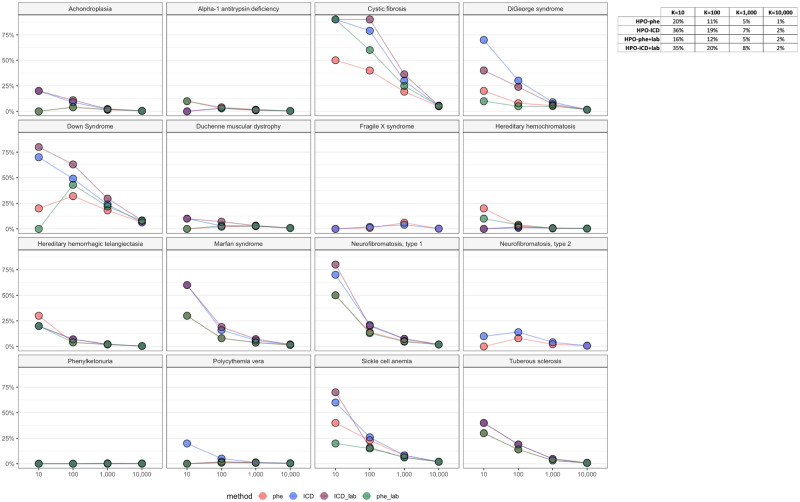
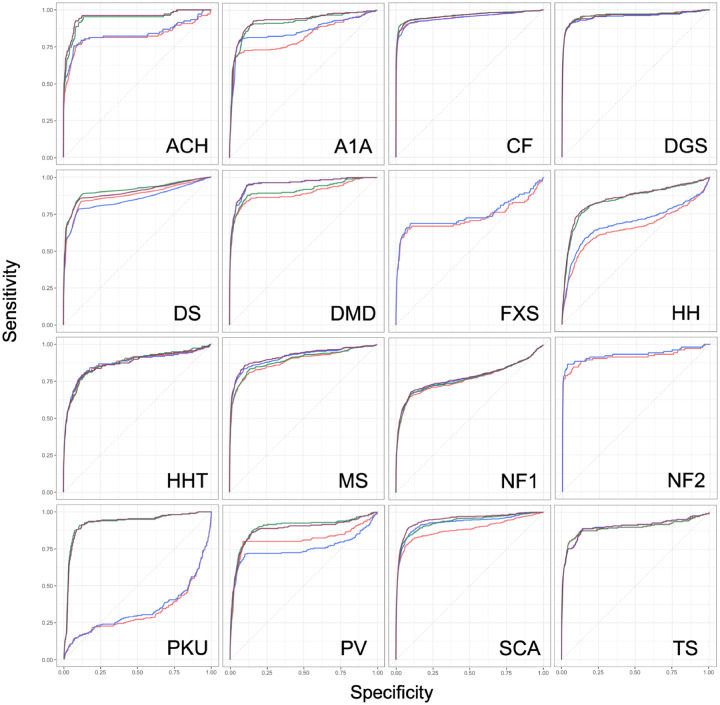
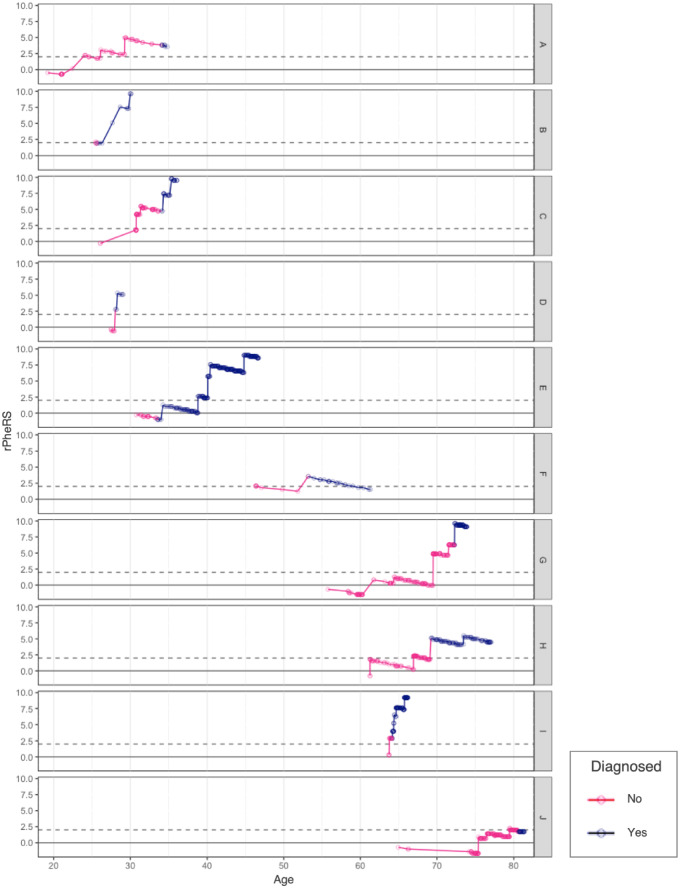
Results: PheRS effectively distinguished cases from controls for all 15 positive controls and all approaches tested (P < 4 × 10¹⁶). Adding lab data led to a statistically significant improvement for 4 of 14 diseases. The custom ICD groupings improved specificity, leading to an average 8% increase for precision at 100 (-2% to 22%). Eight of 10 adults with cystic fibrosis tested had PheRS in the 95th percentile prio to diagnosis.
Discussion: Both phecodes and custom ICD groupings were able to detect differences between affected cases and controls at the population level. The ICD map showed better precision for the highest scoring individuals. Adding lab data improved performance at detecting population-level differences.
Conclusions: PheRS is a scalable method to study Mendelian disease at the population level using electronic health record data and can potentially be used to find patients with undiagnosed Mendelian disease.
Keywords: Data mining; Diagnosis; Electronic health record; Mendelian genetics.
© The Author(s) 2019. Published by Oxford University Press on behalf of the American Medical Informatics Association. All rights reserved. For permissions, please email: journals.permissions@oup.com.
Figures
References
-
- Ledley RS, Lusted LB.. Reasoning foundations of medical diagnosis. Science 1959; 1303366: 9–21. - PubMed
-
- McKusick VA. On lumpers and splitters, or the nosology of genetic disease. Perspect Biol Med 1969; 122: 298–312. - PubMed
-
- OMIM clinical synopsis—#219700—CYSTIC FIBROSIS; CF. https://www.omim.org/clinicalSynopsis/219700Accessed May 21, 2019.
-
- OMIM - Online Mendelian Inheritance in Man. http://omim.org/ Accessed May 20, 2014.
Publication types
MeSH terms
Grants and funding
LinkOut - more resources
Full Text Sources
Medical
Miscellaneous
