. 2019 Oct 14;15(10):e1008412.
doi: 10.1371/journal.pgen.1008412. eCollection 2019 Oct.

Centromeric SMC1 promotes centromere clustering and stabilizes meiotic homolog pairing

Affiliations

Centromeric SMC1 promotes centromere clustering and stabilizes meiotic homolog pairing

Talia Hatkevich et al. PLoS Genet. .

Abstract

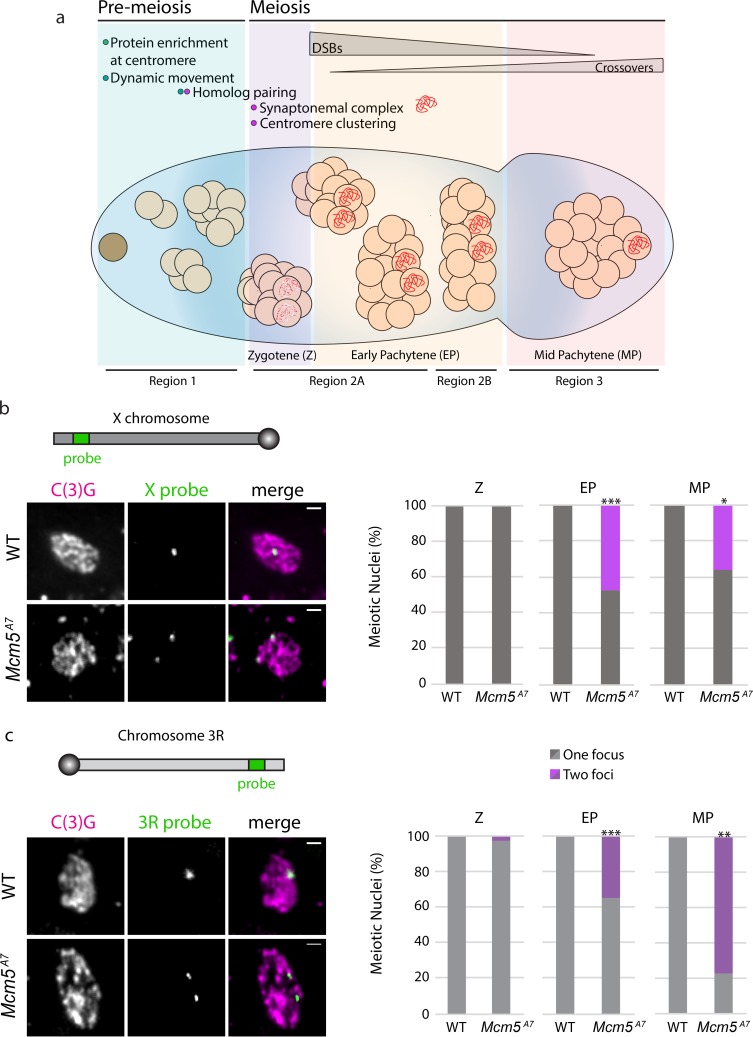
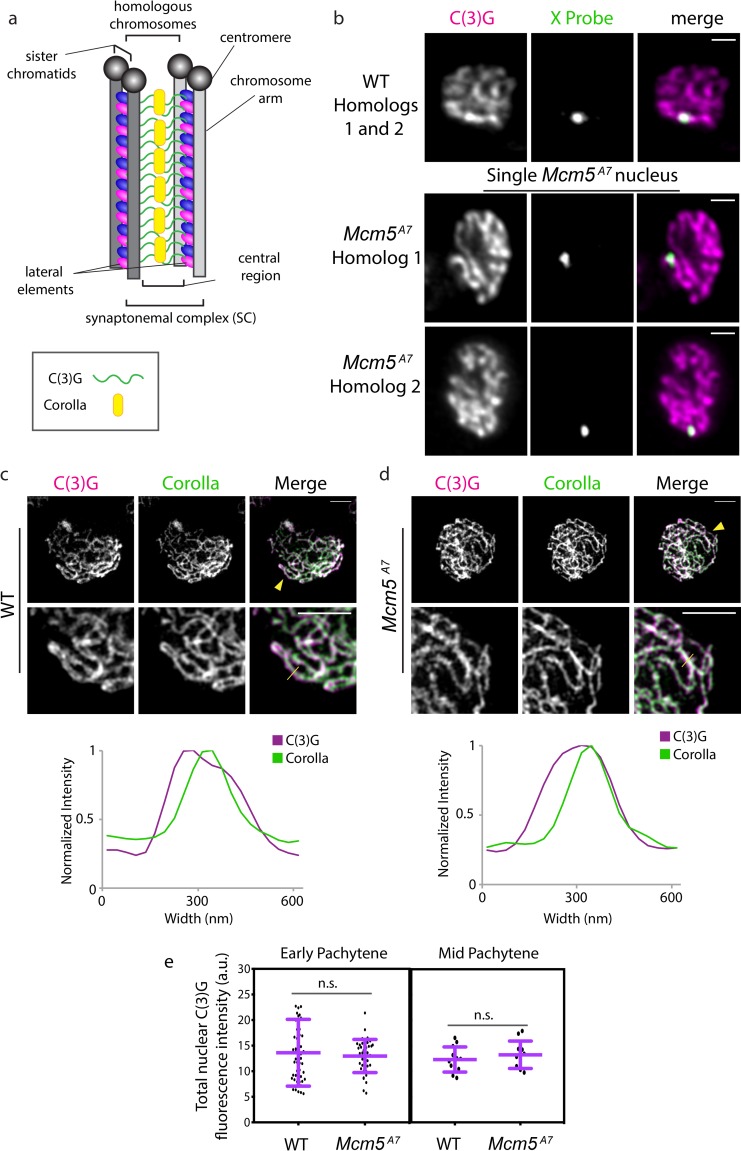
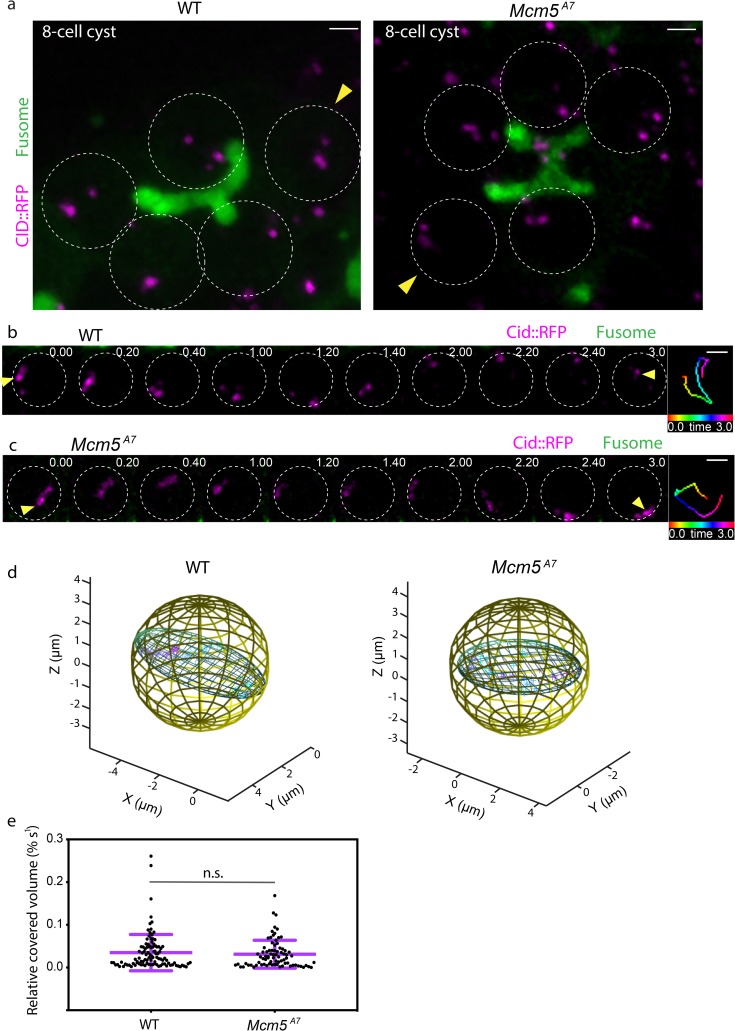
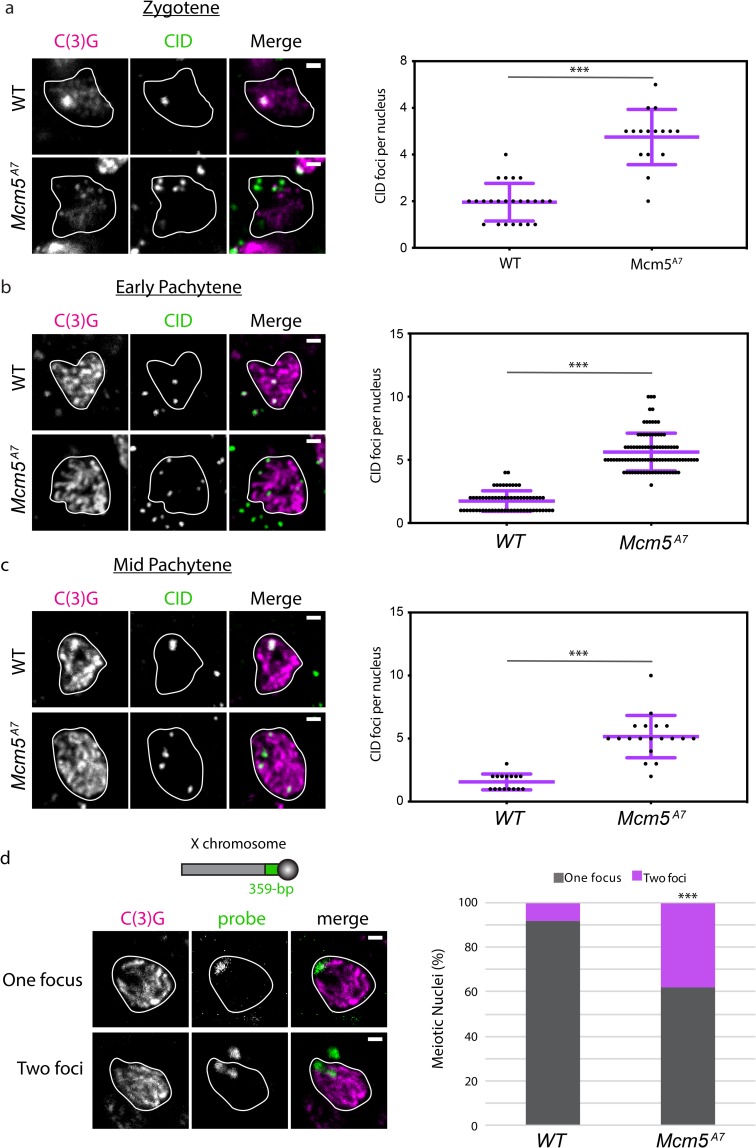
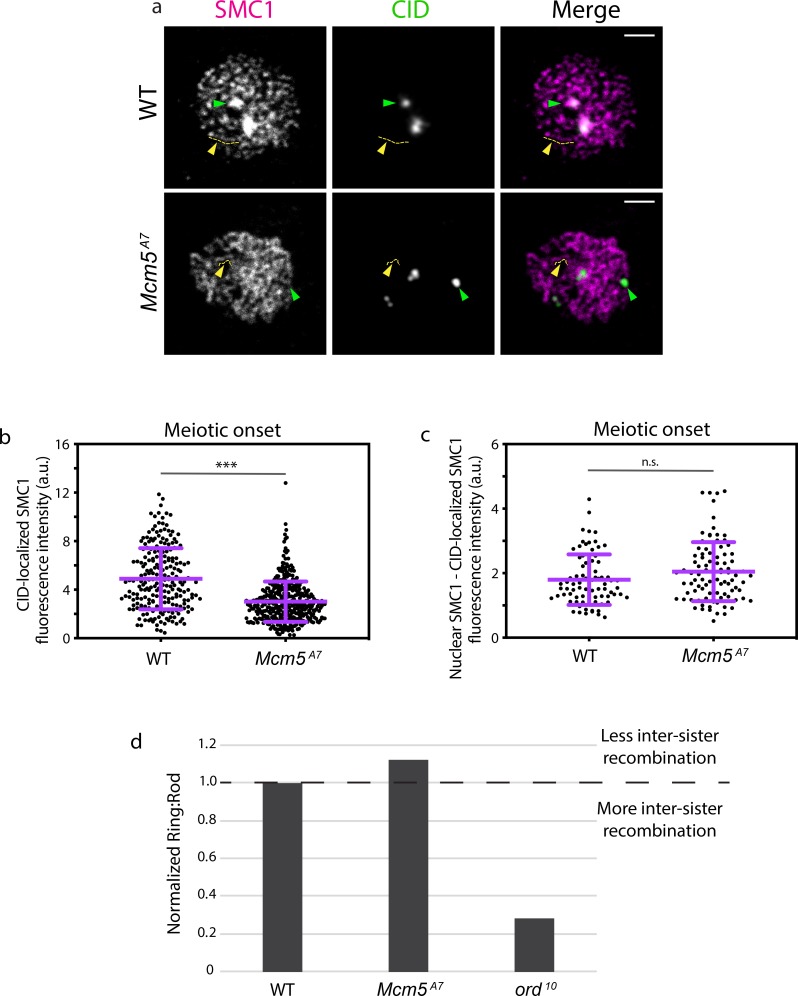
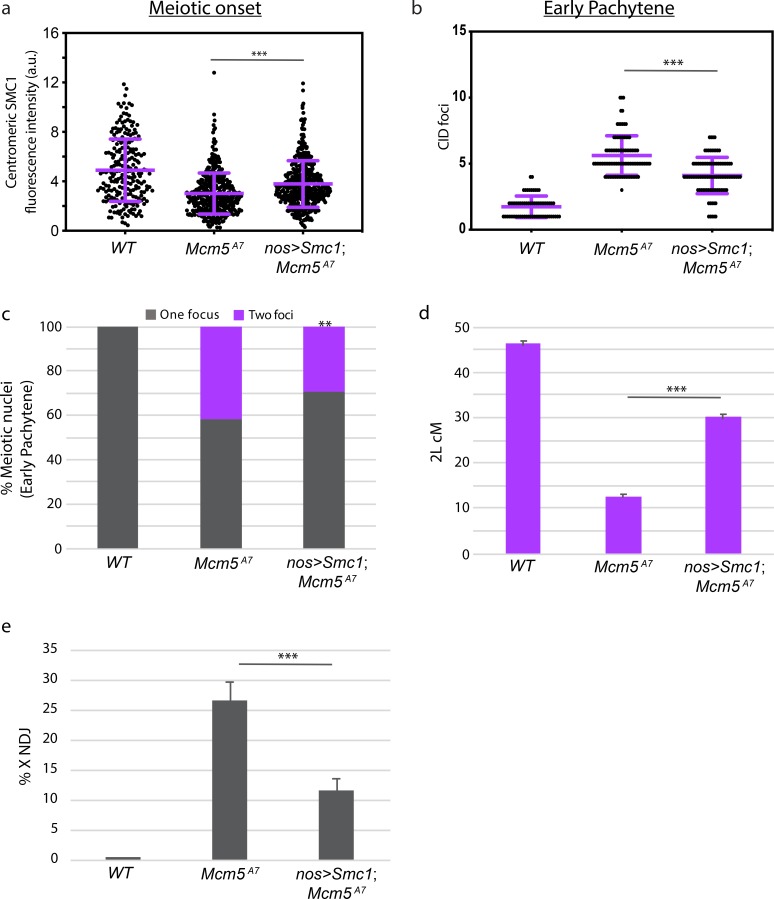
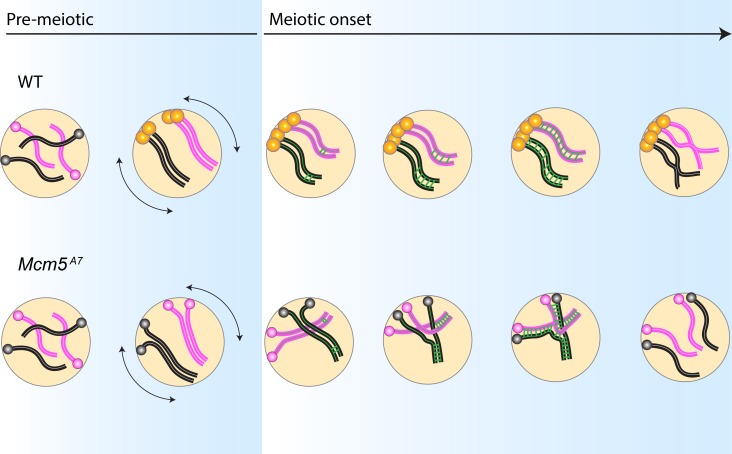
During meiosis, each chromosome must selectively pair and synapse with its own unique homolog to enable crossover formation and subsequent segregation. How homolog pairing is maintained in early meiosis to ensure synapsis occurs exclusively between homologs is unknown. We aimed to further understand this process by examining the meiotic defects of a unique Drosophila mutant, Mcm5A7. We found that Mcm5A7 mutants are proficient in homolog pairing at meiotic onset yet fail to maintain pairing as meiotic synapsis ensues, causing seemingly normal synapsis between non-homologous loci. This pairing defect corresponds with a reduction of SMC1-dependent centromere clustering at meiotic onset. Overexpressing SMC1 in this mutant significantly restores centromere clustering, homolog pairing, and crossover formation. These data indicate that the initial meiotic pairing of homologs is not sufficient to yield synapsis exclusively between homologs and provide a model in which meiotic homolog pairing must be stabilized by centromeric SMC1 to ensure proper synapsis.


Conflict of interest statement

The authors have declared that no competing interests exist.

Figures

Fig 1
Fig 1. Meiotic pairing is perturbed in Mcm5A7 mutants.
a. Schematic depiction of the Drosophila germarium. At the anterior portion (the pre-meiotic region, Region 1), the germline stem cell (brown cell) divides to yield a cytoblast, which undergoes four subsequent rounds of division to yield a 16-cell cyst. In the pre-meiotic region, proteins, such as SMC1 and C(3)G, are enriched at the centromeres, and within the 8-cell cyst, chromosomes exhibit centromere-direct rapid movements. Within the first 16-cell cyst (zygotene; Region 2A), homologous chromosomes pair, centromeres cluster into 1 or 2 groups, and up to four cells initiate meiosis, expressing patches of SC (red dots). As the 16-cell cyst enters early pachytene (EP) (Region 2A), only two continue as pro-oocytes to form full length synaptonemal complex (red). Meiotic double-strand breaks (DSBs) are formed and repaired via homologous recombination (HR) throughout the germarium’s posterior (Regions 2A, 2B) to yield noncrossover and crossover products. At the most posterior tip, signifying mid-pachytene (MP), only one cell within the cyst has been selected to become the oocyte, and all DSBs are repaired. Cytological regions of the germarium (Region 1, 2A, 2B, and 3) are depicted. b. Top: schematic of X chromosome and relative location of X-probe, not drawn to scale. Left: Representative images paired (WT) and unpaired (Mcm5A7) X-probes (green) in meiotic cells, indicated by C(3)G expression (magenta). Images are of meiotic nuclei in Region 2A. Scale bar = 1 μm. Right: Quantification of percent paired and unpaired nuclei in WT and Mcm5A7 in Z (WT n = 33, Mcm5A7 = 32), EP (WT n = 130, Mcm5A7 = 118; ***p < 0.0001, chi-square), and MP (WT n = 10, Mcm5A7 = 11; *p = 0.01, chi-square). c. Top: schematic of the right arm of chromosome 3 (3R) and relative location of 3R-probe, not drawn to scale. Left: Representative images paired (WT) and unpaired (Mcm5A7) 3R-probes (green) in meiotic cells, represented by C(3)G expression (magenta). WT image is of 2A nucleus, Mcm5A7 is of Region 3 nucleus. Right: Quantification of percent paired and unpaired nuclei in WT and Mcm5A7 in Z (WT n = 37, Mcm5A7 = 33), EP (WT n = 104, Mcm5A7 = 97; ***p < 0.0001, chi-square), and MP (WT n = 10, Mcm5A7 = 9; **p = 0.0066, chi-square). Brightness, contrast, and texture (smoothed) of images have been adjusted for clarity.
Fig 2
Fig 2. Synaptonemal complex exhibits no observable defects in Mcm5A7 mutants.
a. Schematic depiction of SC between two homologous chromosomes. The SC is composed of two lateral elements flanking a central region. The lateral elements are predecessors of the axial element, which is formed between sister chromatids and are composed of two cohesion complexes (blue and pink ovals). The central region consists, in part, of a C(3)G (green) dimer spanning the lateral elements, with pillar proteins such as Corolla (yellow) embedded within the central region. Enrichment of proteins at the centromere is not depicted. b. Super-resolution images of C(3)G and X-probe in WT (paired) and Mcm5A7 (unpaired) in whole-mount germaria, quantified in Fig 1. The images of Mcm5A7 are of the same nucleus but of different Z slices to capture both X-probes. Brightness and contrast have been adjusted for clarity. Scale bar = 1 μm. Refer to S1 and S2 Movies. c. Top: Representative image of C(3)G (magenta) and Corolla (green) in a WT meiotic chromosome spread. Brightness and contrast have been adjusted for clarity. Yellow arrowhead indicates area magnified in lower panel (middle). Scale bar = 2 μm. Middle: Magnification to detail the localization of C(3)G and Corolla. Scale bar = 2 μm. Yellow line indicates the area quantified for normalized intensity. Bottom: Normalized intensity of C(3)G and Corolla in a representative SC tract to demonstrate localization. d. Top: Representative image of C(3)G (magenta) and Corolla (green) in Mcm5A7 meiotic chromosome spread. Yellow arrowhead indicates area magnified in lower panel (middle). Scale bar = 2 μm. Middle: Magnification to detail the localization of C(3)G and Corolla. Scale bar = 2 μm. Yellow line indicates the area that was quantified for normalized intensity. Bottom: Normalized intensity of C(3)G and Corolla to demonstrate localization. e. Left panel: Quantification of nuclear C(3)G signal at early pachytene in WT (n = 52) and Mcm5A7 (n = 41) meiotic nuclei. p = 0.5601, unpaired T-test. Data are represented as mean ± SD. Right panel: Quantification of nuclear C(3)G signal in mid-pachytene in WT (n = 12) and Mcm5A7 (n = 11) meiotic nuclei. p = 0.3993, unpaired T-test. Data are represented as mean ± SD. Refer to S1 Fig for images and further analysis.
Fig 3
Fig 3. Centromeres in Mcm5A7 mutants exhibit dynamic, rapid movements.
a. Projection of Z-sections of live WT (left) and Mcm5A7 8-cell cysts expressing CID::RFP (magenta) and Par-1::GFP (fusome, green). Circles represent individual nuclei within the 8-cell cysts. Yellow arrow heads denote representative analyses shown in b. and c. and quantified by time points in d. Scale bars = 2μm. For videos, refer to S3 and S4 Movies. b. Selected projections from one WT 8-cell cyst nucleus in (A, indicated by yellow arrow head) over a 3-minute time course. See S5 Movie for full movie. c. Selected projections from one Mcm5A7 8-cell cyst nucleus in (A, indicated by yellow arrow head) over a 3-minute time course. See S6 Movie for full movie. Time-colored tracking for CID-RFP dots indicated by yellow arrow heads are shown in right panels for b. and c. Scale bars = 2μm. d. 3-dimensional representations demonstrating the covered volume of a representative track for all time points in WT (50 time points, volume = 12.9 μm3) and Mcm5A7 (48 time points, volume = 15.7 μm3). e. Distribution of the relative covered volume (raw covered volume/nuclear volume) per second for each track in WT (n = 103 centromere foci) and Mcm5A7 (n = 80 centromere foci). p = 0.75, Kolmogorov-Smirnov test. Data are represented as mean ± SD.
Fig 4
Fig 4. Centromere clustering is disrupted in Mcm5A7 mutants.
a. Left: Representative images of centromere clustering, or lack thereof, in wild-type (WT) and Mcm5A7 meiotic nuclei located in zygotene. Magenta: C(3)G, green: CID (centromere). In these images, WT nucleus contains 1 CID focus, and Mcm5A7 contains 6 CID foci. Scale bar = 1 μm. Right: Quantification of CID foci in zygotene in WT (n = 24) and Mcm5A7 (n = 16). ***p < 0.0001, unpaired T-test. Data are represented as mean ± SD. b. Left: Representative images of centromere clustering in WT and Mcm5A7 early pachytene nuclei. Magenta: C(3)G, green: CID. In these images, WT nucleus contains 2 CID foci, and Mcm5A7 contains 5 CID foci. Scale bar = 1 μm. Right: Quantification of early pachytene CID foci in WT (n = 65) and Mcm5A7 (n = 94). ***p < 0.0001, unpaired T-test. Data are represented as mean ± SD. c. Left: Representative images of centromere clustering, or lack thereof, in mid-pachytene WT and Mcm5A7 nuclei. Magenta: C(3)G, Green: CID. In these images, WT nucleus contains 1 CID focus, and Mcm5A7 contains 4 CID foci. Scale bar = 1 μm. Right: Quantification of mid-pachytene CID foci in WT (n = 16) and Mcm5A7 (n = 19). ***p < 0.0001, unpaired T-test. Data are represented as mean ± SD. d. Schematic representing relative location of 359-bp locus on Chromosome X (not drawn to scale). Top panel: Representative image of meiotic nucleus with 1 359-bp (green) focus (WT, Region 2A). Bottom panel: Representative image of meiotic nucleus with 2 359-bp (green) foci (Mcm5A7, Region 2A). Right: Percentage of nuclei with paired 359-bp loci (one focus) or unpaired (two loci) in WT (n = 88) and Mcm5A7 (n = 63) meiotic nuclei. ***p < 0.0001, as determined by two-tailed Fisher’s exact test. Contrast and brightness of all images were adjusted for clarity. Outlines of representative nuclei are drawn in white. CID foci not localized with C(3)G are from adjacent, non-meiotic cells. All DAPI-containing images are provided in S2 Fig.
Fig 5
Fig 5. Centromeric SMC1 is significantly reduced in Mcm5A7 mutants.
a. Representative images of chromosome spreads in WT and Mcm5A7 meiotic nuclei examining localization of SMC1 (magenta) and CID (green). Green arrow: SMC1 enrichment at the centromere, yellow arrow and tract: SMC1 along the chromosome arm. Scale bar = 2 μm. Contrast and brightness of images were adjusted for clarity. b. Integrated SMC1 fluorescence intensity at CID foci in meiotic nuclei at meiotic onset (zygotene + early pachytene, Region 2A) at WT (n = 225) and Mcm5A7 (n = 398) meiotic centromeres. ***p < 0.0001, unpaired T-test. Data are represented as mean ± SD. c. CID-localized SMC1 fluorescence intensity subtracted from total nuclear SMC1 fluorescence in meiotic nuclei at meiotic onset (zygotene + early pachytene, Region 2A) in WT (n = 81) and Mcm5A7 (n = 93) meiotic nuclei. n.s. = 0.0548, unpaired T-test. Data are represented as mean ± SD. S3A Fig for representative images. d. Mcm5A7 (n = 1194) and ord10 (n = 250) mutants examined for inter-sister recombination through the ratio of Ring chromosome to Rod chromosome transmission. WT (n = 2574 for Mcm5A7 experiment, n = 1204 for Ord experiment) was normalized to 1. Ratios above 1 suggest less inter-sister recombination; ratios below 1 suggest more inter-sister recombination. Refer to S1 Table for complete dataset. For further details about the assay, see S3B–S3D Fig.
Fig 6
Fig 6. Overexpression of SMC1 in Mcm5A7 mutants rescue clustering, pairing, crossover formation, and NDJ.
a. Integrated SMC1 fluorescence intensity at WT, Mcm5A7, and nos>Smc1; Mcm5A7 (n = 427) meiotic centromeres at meiotic onset. See S4A Fig for representative images of nos>Smc1; Mcm5A7 nuclei. WT and Mcm5A7 data are repeated from Fig 5. ***p < 0.0001, unpaired T-test. Data are represented as mean ± SD. b. Number of centromeres (CID foci) in WT, Mcm5A7, and nos>Smc1; Mcm5A7 (n = 94) meiotic nuclei at early pachytene. WT and Mcm5A7 data are repeated from Fig 2. ***p < 0.0001, unpaired T-test. Data are represented as mean ± SD. c. Percent of total paired and unpaired in WT, Mcm5A7, and nos>Smc1; Mcm5A7 (total n = 169) nuclei at early pachytene, combining X-probe and 3R-probe data. WT and Mcm5A7 data are repeated from Fig 4 and are represented as X-probe plus 3R-probe early pachytene data. Significance comparing Mcm5A7 and nos>Smc1, Mcm5A7: **p = 0.0002, chi-square d. Crossover levels on chromosome 2L as shown in cM in WT (n = 4222) [54], Mcm5A7 (n = 2070), and nos>Smc1; Mcm5A7 (n = 933). ***p < 0.001, chi-square. Data are represented as mean ± 95% CI. Refer to S2 Table for full 2L crossover dataset. e. NDJ of the X chromosome in WT (0.07%, n = 3034), Mcm5A7 (26.5%, n = 1979), nos>Smc1; Mcm5A7 (11.5%, n = 2282). ***p < 0.0001 as calculated by [48]. Data are represented as mean ± 95% CI. Refer to S3 Table for full NDJ dataset.
Fig 7
Fig 7. Centromeric SMC1-dependent pairing model.
WT: In pre-meiotic cysts, homologous chromosomes (pink = homolog pair 1, black = homolog pair 2) enter the germline unpaired. During pre-meiotic cell cycles, chromosome arms and centromeres pair, with centromeres anchored at the nuclear envelope. Prior to meiotic onset, SMC1 is enriched at the centromeres (yellow) and centromere-directed chromosome movement (double-headed arrows) occurs. These events yield centromere clustering at meiotic initiation. As euchromatic synapsis nucleates along arms (green bars), paired chromosomes are stabilized by centromere clustering, permitting homosynapsis. After DSB formation and repair (not depicted), crossovers between homologs are formed, promoting proper disjunction at the end of meiosis I. Mcm5A7: Chromosomes enter the germline unpaired, and centromeres are attached to the nuclear envelope. In pre-meiotic cycles, chromosomes initially pair, but centromeres do not. Centromere-directed chromosome movements occur, but SMC1 is not enriched at the centromere, causing a lack of centromere clustering at meiotic onset. As the SC nucleates at the arms, homolog pairing is not maintained. Synapsis spreads between the nearest chromosomal regions, independent of homology, yielding high frequency of heterosynapsis. During heterosynapsis, DSBs are not repaired by HR, yielding non-recombinant chromosomes that nondisjoin at the end of Meiosis I.

Similar articles

Cited by

References

    1. Lake CM, Teeter K, Page SL, Nielsen R, Hawley RS. A genetic analysis of the Drosophila mcm5 gene defines a domain specifically required for meiotic recombination. Genetics. 2007;176(4):2151–63. 10.1534/genetics.107.073551 . - DOI - PMC - PubMed
    1. Zickler D, Kleckner N. Recombination, piring, and synapsis of homologs during meiosis. Cold Spring Harbor perspectives in biology. 2015;7(6). Epub 2015/05/20. 10.1101/cshperspect.a016626 - DOI - PMC - PubMed
    1. Page SL, Hawley RS. The genetics and molecular biology of the synaptonemal complex. Annu Rev Cell Dev Biol. 2004;20:525–58. Epub 2004/10/12. 10.1146/annurev.cellbio.19.111301.155141 . - DOI - PubMed
    1. Alleva B, Smolikove S. Moving and stopping: Regulation of chromosome movement to promote meiotic chromosome pairing and synapsis. Nucleus. 2017;8(6):613–24. Epub 2017/09/12. 10.1080/19491034.2017.1358329 - DOI - PMC - PubMed
    1. Klutstein M, Cooper JP. The Chromosomal Courtship Dance-homolog pairing in early meiosis. Curr Opin Cell Biol. 2014;26:123–31. Epub 2014/02/18. 10.1016/j.ceb.2013.12.004 - DOI - PMC - PubMed

Publication types

MeSH terms

Substances

LinkOut - more resources