. 2019 Oct 14;14(10):e0216690.
doi: 10.1371/journal.pone.0216690. eCollection 2019.

An innovative non-invasive technique for subcutaneous tumour measurements

Affiliations

An innovative non-invasive technique for subcutaneous tumour measurements

Juan Delgado-SanMartin et al. PLoS One. .

Abstract

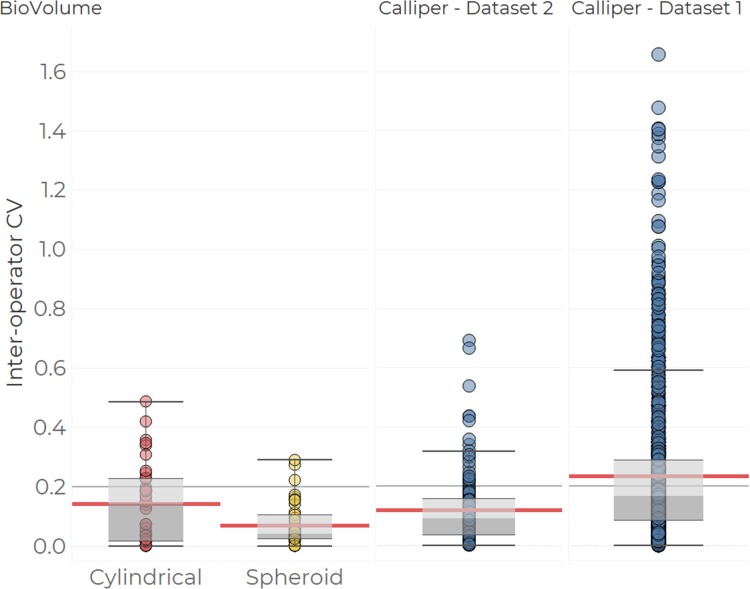
Introduction: In oncological drug development, animal studies continue to play a central role in which the volume of subcutaneous tumours is monitored to assess the efficacy of new drugs. The tumour volume is estimated by taking the volume to be that of a regular spheroid with the same dimensions. However, this method is subjective, insufficiently traceable, and is subject to error in the accuracy of volume estimates as tumours are frequently irregular.

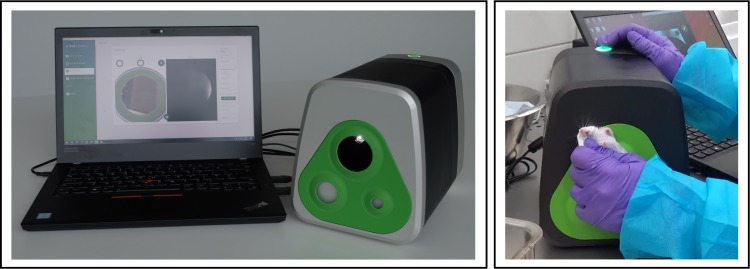
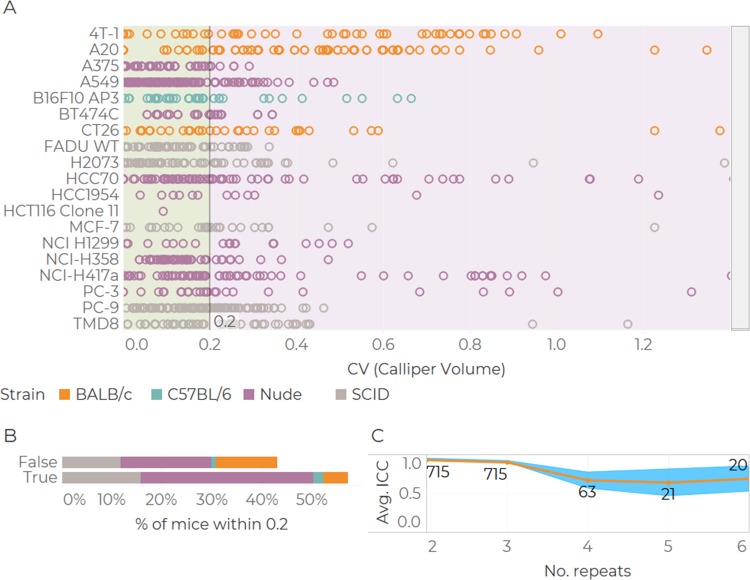
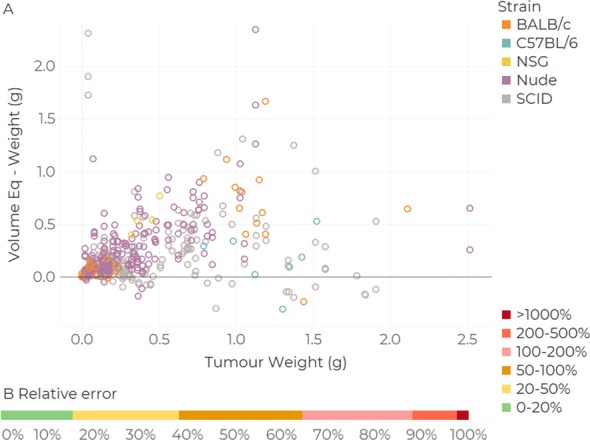
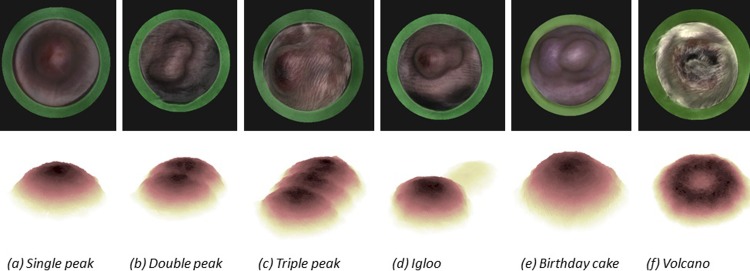
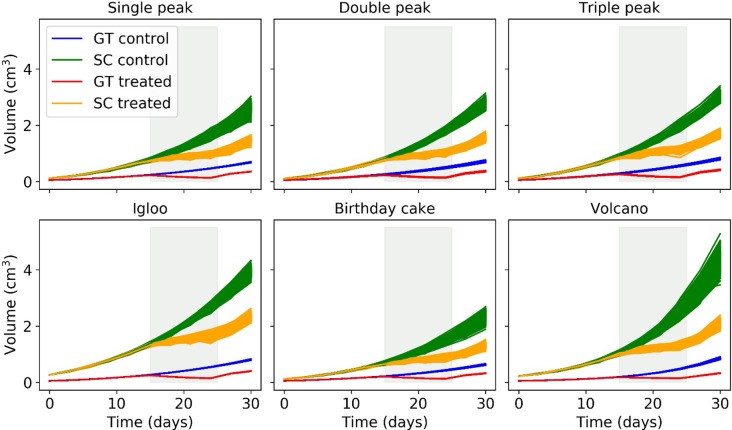
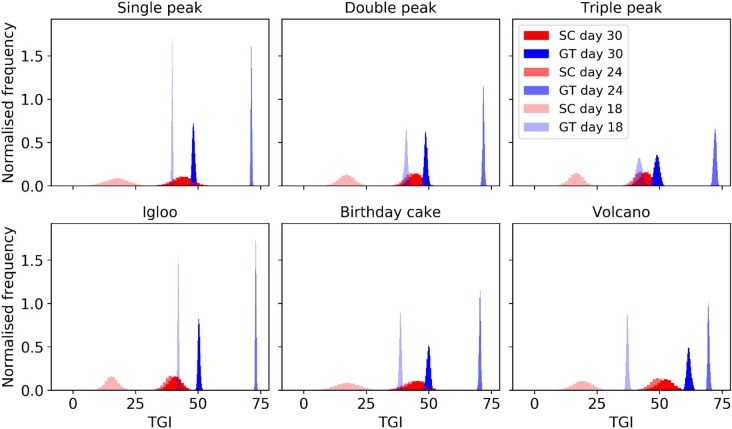
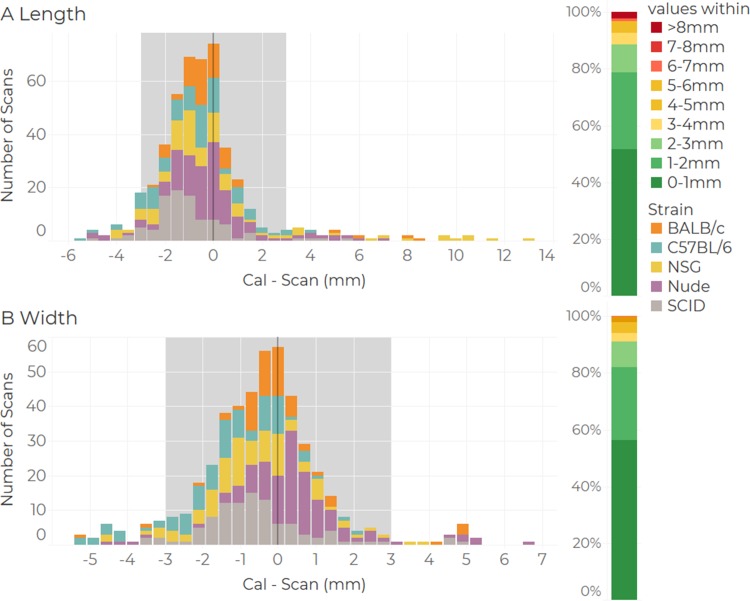
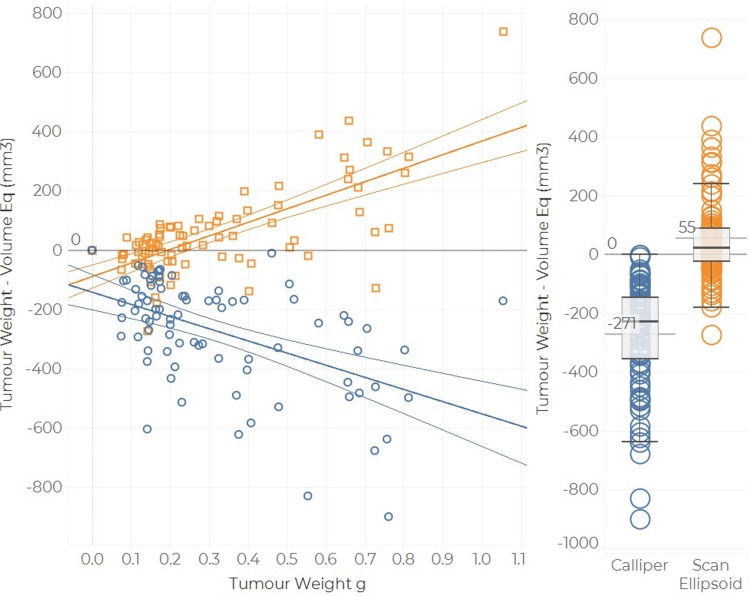
Methods & results: This paper reviews the standard technique for tumour volume assessment, calliper measurements, by conducting a statistical review of a large dataset consisting of 2,500 tumour volume measurements from 1,600 mice by multiple operators across 6 mouse strains and 20 tumour models. Additionally, we explore the impact of six different tumour morphologies on volume estimation and the detection of treatment effects using a computational tumour growth model. Finally, we propose an alternative method to callipers for estimating volume-BioVolumeTM, a 3D scanning technique. BioVolume simultaneously captures both stereo RGB (Red, Green and Blue) images from different light sources and infrared thermal images of the tumour in under a second. It then detects the tumour region automatically and estimates the tumour volume in under a minute. Furthermore, images can be processed in parallel within the cloud and so the time required to process multiple images is similar to that required for a single image. We present data of a pre-production unit test consisting of 297 scans from over 120 mice collected by four different operators.

Conclusion: This work demonstrates that it is possible to record tumour measurements in a rapid minimally invasive, morphology-independent way, and with less human-bias compared to callipers, whilst also improving data traceability. Furthermore, the images collected by BioVolume may be useful, for example, as a source of biomarkers for animal welfare and secondary drug toxicity / efficacy.


Conflict of interest statement

Fuel3D is developing BioVolume and claims financial competing interests on the product. The data presented here is generated as a pre-production test on the technology. There are not specific patents granted or filed for this technology or any part of it. AstraZeneca and Medimmune do not claim any financial interests. This does not alter adherence to PLOS policies on sharing data.

Figures

Fig 1
Fig 1. Experimental setup.
Complete set up of the BioVolume unit including computer monitor and desktop device (left), closeup image of a white SCID mouse being presented to the aperture of BioVolume (right).
Fig 2
Fig 2. Summary of inter-operator precision and ICC in volume from callipers.
Precision single values ordered by tumour model and mouse strain (A). Quantification of values within a precision limit of 0.2 (B). ICC values vs number of operators (C). Values printed on the plot indicate number of observations, dots are average ICC and shaded bars are 95% confidence intervals.
Fig 3
Fig 3. Tumour volume and weight comparison.
Bland-Altmann plot (A), linear fit with 95% confidence intervals. Proportion of mice at different levels of relative errors (B, n = 440). Relativeerror=(VolumeEq.Weight)/Weight.
Fig 4
Fig 4. Representative examples of subcutaneous tumours exhibiting different morphologies.
The top row shows reconstructions of real tumours produced using BioVolume. The bottom row shows snapshots of the corresponding in silico tumours generated with the CA model. a-c) depict tumours with one, two, and three peaks respectively. d) shows an igloo-shaped tumour. Such tumours are characterised by a main cancerous mass (typically resembling a single peak tumour) and a “tail” and can arise if the inoculating needle leaves a trail of cells when it is retracted. e) “birthday cake” tumours can be triggered by a mutation which creates a more aggressive sub-population of cells. f) volcano-shaped tumours can arise due to ulceration.
Fig 5
Fig 5. Growth curves of synthetic control and treated tumours calculated using the true volume (GT) and simulated calliper measurements (SC).
For each morphology, 103 growth curves were generated. The grey area corresponds to the period in which the anticancer treatment was applied; I.e. days 15 to 25.
Fig 6
Fig 6. Histograms showing the Tumour Growth Inhibition (TGI) index computed for different morphologies using the true volume (shades of blue) and simulated calliper measurements (shades of red).
The TGI was computed using days 18, 24 and 30 as experiment endpoints.
Fig 7
Fig 7
Histograms showing counts of discrepancies between calliper and scan measurements (in mm) for (a) length and (b) width of flank tumours. Counts within each bin are categorised by rodent strain. The vertical grey band highlights instance for which the difference between the scan and calliper measurement was less than or equal to 3mm. The vertical coloured bands to the right of each plot shows the number of scans falling into each range band as a percentage of the total.
Fig 8
Fig 8. Volume—Weight comparison for Dataset 2.
Calliper volume was calculated using the spheroid formula, whereas scan volume corresponds to the ellipsoid volume. The linear fit is represented by the solid coloured lines, whereas the horizontal gray line is the 0 reference line. The boxplots display the median discrepancies. The hinges of each box show the 95% confidence intervals and the whiskers extend to 1.5 times the IQR.
Fig 9
Fig 9. Inter-operator precision in volume estimates for callipers and BioVolume.
Volume estimates for BioVolume correspond to spheroid (the same formula as that used for callipers, in yellow) and cylindrical approximations (in red). Calliper data (in blue) is split into values from the BioVolume evaluation (left) and values from the Calliper statistical review (right, also in Fig 2). Each point captures the inter-operator CV based on two or more volume measurements made for a specific tumour on a given day. The box plots summarise the dispersal of the estimates. The main body of each box highlights the inter-quartile range while the whiskers of each boxplot encompass all values within 1.5 of the median which is indicated by the dividing line between the upper and lower hinges of each box. The light red lines reflect the mean for each category.

Similar articles

Cited by

References

    1. Tomayko MM, Reynolds CP. Determination of subcutaneous tumor size in athymic (nude) mice. Cancer Chemother Pharmacol. 1989; - PubMed
    1. Euhus DM, Hudd C, Laregina MC, Johnson FE. Tumor measurement in the nude mouse. J Surg Oncol. 1986; - PubMed
    1. Ishimori T, Tatsumi M, Wahl RL. Tumor response assessment is more robust with sequential CT scanning than external caliper measurements. Acad Radiol. 2005; - PubMed
    1. Ayers GD, McKinley ET, Zhao P, Fritz JM, Metry RE, Deal BC, et al. Volume of preclinical xenograft tumors is more accurately assessed by ultrasound imaging than manual caliper measurements. J Ultrasound Med. 2010; - PMC - PubMed
    1. Jensen MM, Jørgensen JT, Binderup T, Kjær A. Tumor volume in subcutaneous mouse xenografts measured by microCT is more accurate and reproducible than determined by 18F-FDG-microPET or external caliper. BMC Med Imaging. 2008; - PMC - PubMed

Publication types