. 2020 Jan-Feb;13(1):175-189.
doi: 10.1016/j.brs.2019.10.002. Epub 2019 Oct 7.

Simulation of transcranial magnetic stimulation in head model with morphologically-realistic cortical neurons

Affiliations

Simulation of transcranial magnetic stimulation in head model with morphologically-realistic cortical neurons

Aman S Aberra et al. Brain Stimul. 2020 Jan-Feb.

Abstract

Background: Transcranial magnetic stimulation (TMS) enables non-invasive modulation of brain activity with both clinical and research applications, but fundamental questions remain about the neural types and elements TMS activates and how stimulation parameters affect the neural response.

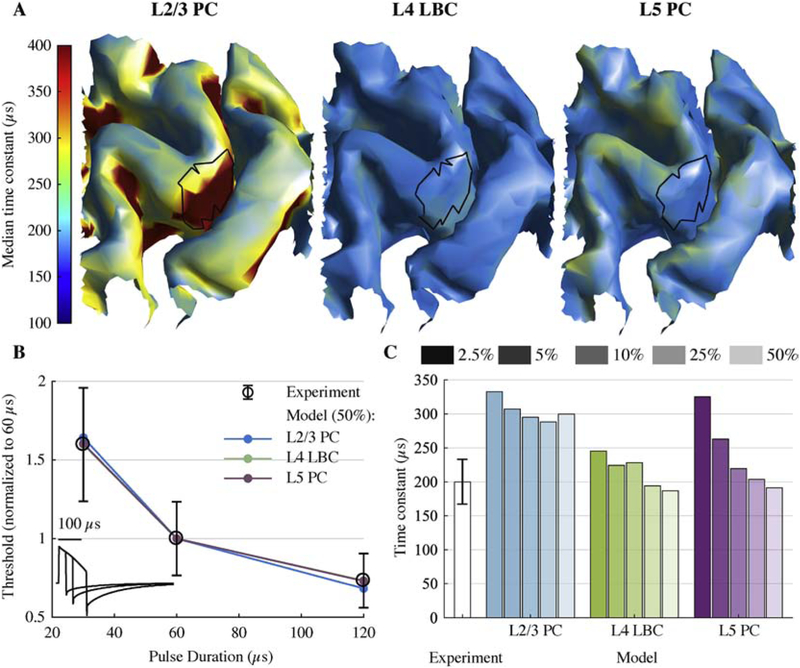
Objective: To develop a multi-scale computational model to quantify the effect of TMS parameters on the direct response of individual neurons.

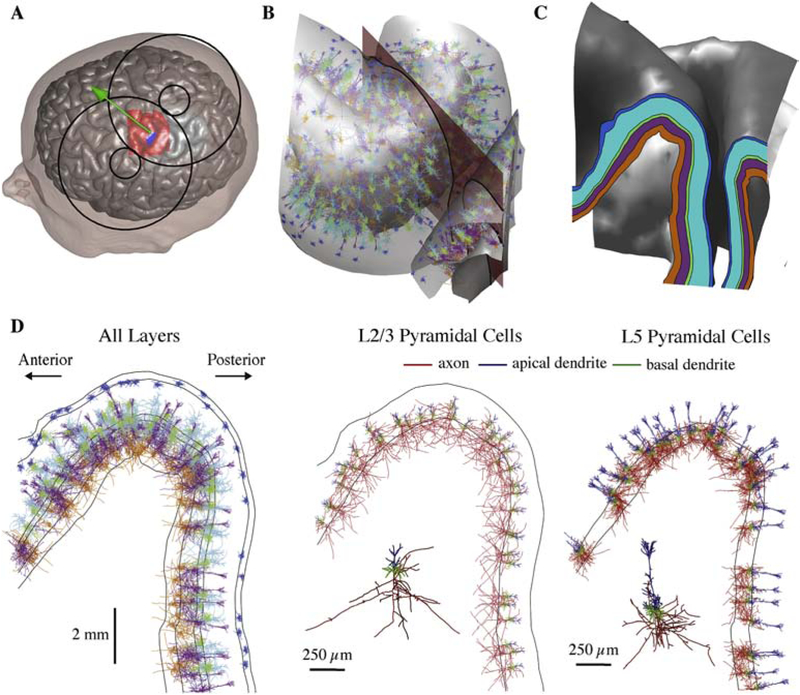
Methods: We integrated morphologically-realistic neuronal models with TMS-induced electric fields computed in a finite element model of a human head to quantify the cortical response to TMS with several combinations of pulse waveforms and current directions.

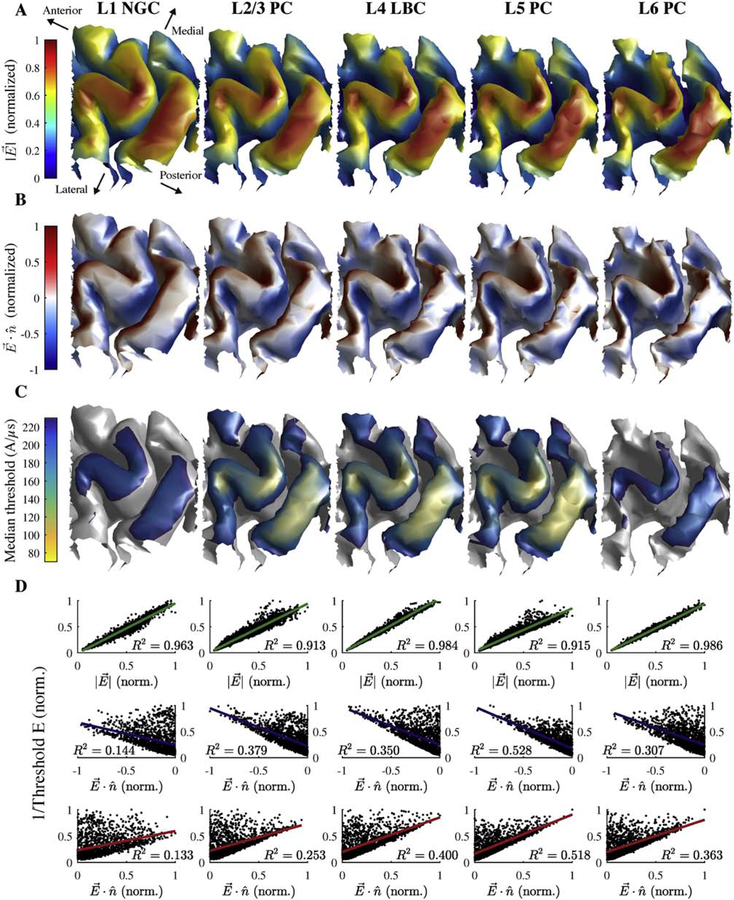
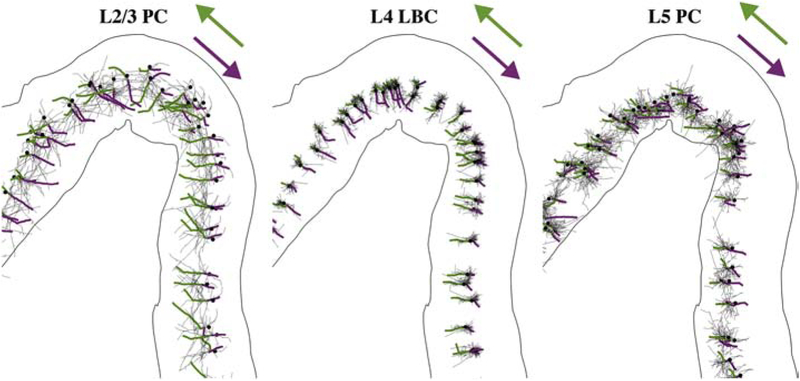
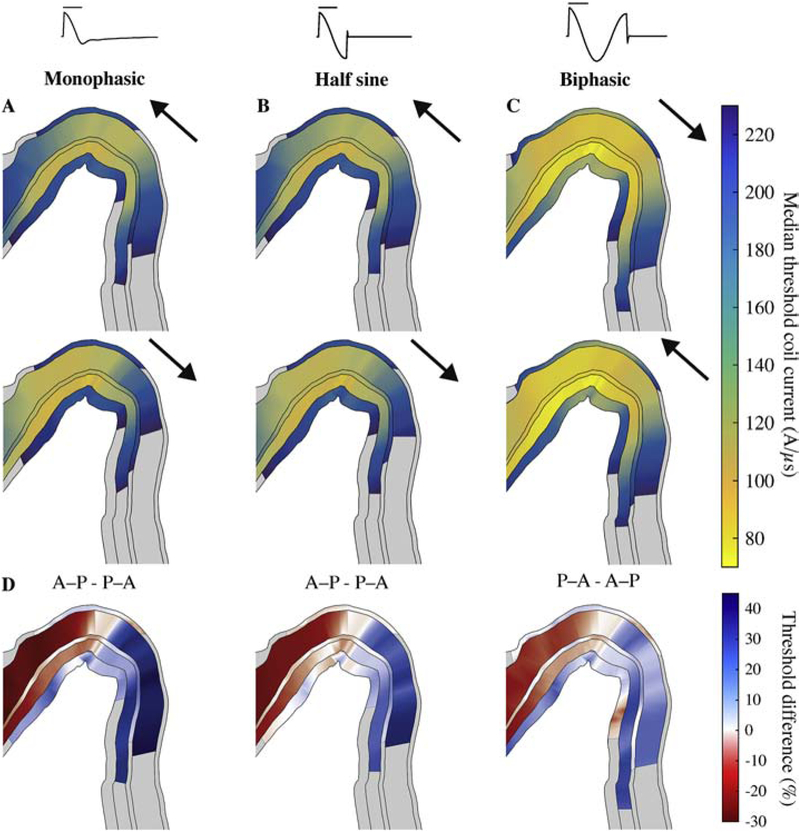
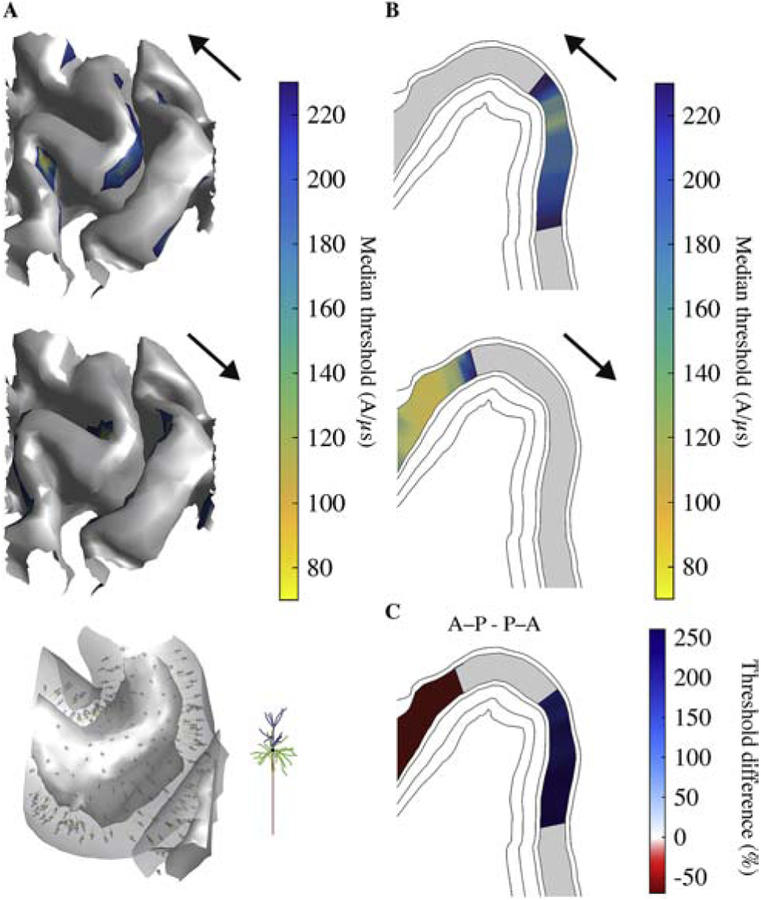
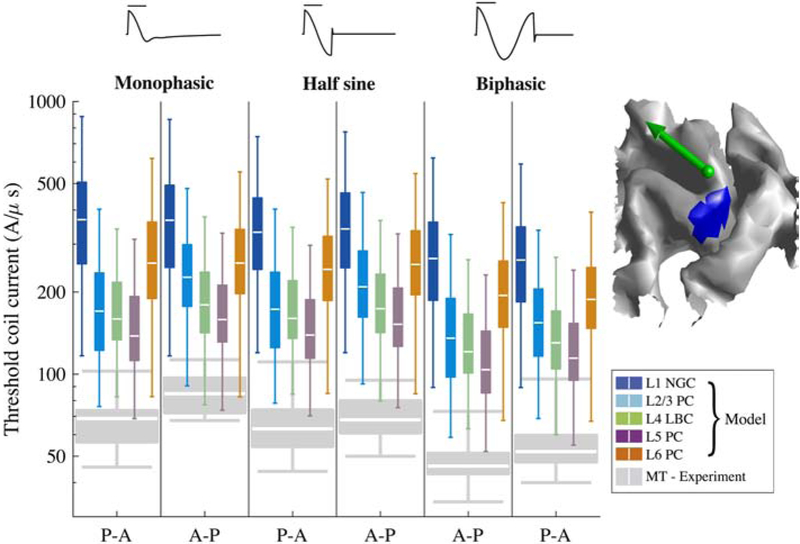
Results: TMS activated with lowest intensity intracortical axonal terminations in the superficial gyral crown and lip regions. Layer 5 pyramidal cells had the lowest thresholds, but layer 2/3 pyramidal cells and inhibitory basket cells were also activated at most intensities. Direct activation of layers 1 and 6 was unlikely. Neural activation was largely driven by the field magnitude, rather than the field component normal to the cortical surface. Varying the induced current direction caused a waveform-dependent shift in the activation site and provided a potential mechanism for experimentally observed differences in thresholds and latencies of muscle responses.

Conclusions: This biophysically-based simulation provides a novel method to elucidate mechanisms and inform parameter selection of TMS and other cortical stimulation modalities. It also serves as a foundation for more detailed network models of the response to TMS, which may include endogenous activity, synaptic connectivity, inputs from intrinsic and extrinsic axonal projections, and corticofugal axons in white matter.

Keywords: Finite element method; Motor cortex; Neuron models; Simulation; Transcranial magnetic stimulation.


Conflict of interest statement

Declaration of interests

B.W. is inventor on patent applications on technology for TMS. A.V.P. is inventor on patents and patent applications on TMS technology; in the past 3 years, he has received travel support as well as patent royalties from Rogue Research for cTMS; research and travel support, consulting fees, as well as equipment donations from Tal Medical/Neurex Therapeutics; patent application and research support as well as hardware donations from Magstim; as well as equipment loans and hardware donations from MagVenture, all related to TMS.

Figures

Figure 1.
Figure 1.. Threshold dependence on cell type and direction of uniform E-field.
A) Coordinate system shown for example cell (L2/3 PC). Somato-dendritic axis aligned to z-axis, with polar angle θ and azimuthal angle ϕ. B) Uniform E-field directions represented as normal vectors on sphere centered at origin. Thresholds were calculated for 398 directions spanning the sphere, and each threshold value was represented as a point on the sphere (white dot) corresponding to the E-field vector E C) 3D threshold–direction map projected into 2D using Mollweide projection. White dot indicates threshold value for example vector E in B, crossed circle represents E-field pointing into the page, and circle with dot represents E-field pointing out of the page. Bottom: Recorded MagPro X100 Monophasic TMS waveform. D) Threshold–direction maps for all cell types and their virtual clones, i.e. models of the same cell type with stochastically varied morphologies, normalized to the minimum for each clone. Within cell type, threshold–direction maps for each clone are ordered by minimum threshold, with lowest minimum threshold at the bottom. White star denotes minimum threshold orientation. Corresponding cell morphology plotted to the right of each map with same color scheme as in A. Black arrow points in direction of minimum threshold orientation, matching white star. All scale bars are 250 μm. E) Minimum threshold for 5 clones of each cell type, grouped by layer.
Figure 2.
Figure 2.. Embedding populations of cortical neuron models in FEM models of TMS induced E-fields.
A) Scalp and gray matter meshes are shown with the overlying TMS coil outline. The coil center and orientation are given by the green sphere and arrow, the hand knob region populated with neurons is indicated in red, and the putative hand muscle representation used in Figure 7 is shown in blue. B) Model neurons located in the crown of the pre-central gyrus between the gray matter and white matter surfaces. One clone from each layer is shown with color corresponding to layer (shown in C); five co-located model neuron populations (virtual clones of each cell type) are simulated in each layer. The 2D analysis plane (red) is used to visualize threshold data in Figure 5 and also shown in CD. The plane is parallel to coil orientation (45° relative to midline). C) Cortical layers used to place and orient model neurons shown in 2D analysis plane, extracted by intersecting the analysis plane with the layer surfaces. D) Neural populations from B visualized within the 2D analysis plane. Neurons in all five layers are plotted with their respective layer colors (left). L2/3 (middle) and L5 (right) PC populations are plotted with axon, apical dendrites, and basal dendrites colored separately.
Figure 3.
Figure 3.. Layer-specific spatial distribution of activation thresholds correlate better with the E-field magnitude than normal component.
A) Magnitude of simulated E-field (normalized across layers) on layer surfaces for L1–L6 arranged adjacent to each other. B) Component of E-field normal to layer surfaces (normalized across layers). Positive values indicate E-field pointing out of surface and negative values indicate inward E-field. C) Median thresholds (across 5 clones and 6 rotations) for monophasic P–A simulation. D) Inverse threshold of each cell plotted against E-field magnitude (top) and absolute value of normal component (bottom) at soma, both normalized to maximum within layer (in A). Each plot includes R2 value for linear regression of inverse threshold with corresponding E-field metric.
Figure 4.
Figure 4.. TMS activates axonal terminations aligned to local E-field direction.
Axonal arbors for single population of L2/3 PCs, L4 LBCs, and L5 PCs with directly activated branch colored from AP initiation point (terminal) to proximal branch point for monophasic P–A (green) and A–P (magenta) stimulation. Dendrites not shown. Somas indicated by black dots.
Figure 5.
Figure 5.. Layer-specific spatial distribution of activation varies with TMS pulse waveform and direction, shown in a cross-section of the hand knob (as in Figure 2C).
Median thresholds for L1–L6 on analysis plane through pre-central gyrus, parallel to coil handle and near coil center for A) monophasic, B) half sine, and C) biphasic stimulation in the P–A and A–P directions. Arrows indicate direction of initial phase of E-field waveform. Note that biphasic stimulation conditions are plotted in opposite order to group stimuli by the direction of their dominant waveform phase. D) Percent difference in median thresholds between P–A and A–P current directions, indicated in title. Regions where thresholds for both P–A and A–P were above 230 A/μs are colored gray.
Figure 6.
Figure 6.. Simpler neuron model with straight axon morphology results in higher thresholds and different spatial distribution of activation for L2/3 PCs.
A) Median thresholds for L2/3 PCs on layer surface for monophasic P–A stimulation (top; compare to Figure 3C) and A–P stimulation (middle). Placement of L2/3 PCs with straight axons visualized in gyral crown between the gray matter and white matter surfaces (similar to Figure 2B) and zoomed in view of single model neuron (bottom). Straight axon versions of L2/3 PCs were co-located with original, realistic axon population and only differed in their axon morphology. B) Median thresholds for L2/3 PC on analysis plane (same as Figure 5) for monophasic P–A (top) and A–P (bottom) stimulation. C) Percent difference in median thresholds between P–A and A–P current directions. Regions where thresholds for both P–A and A–P were above 230 A/μs are colored gray.
Figure 7.
Figure 7.. Activation thresholds within putative hand muscle representation in hand knob.
Model thresholds for each pulse waveform and direction combination are shown in log scale, with each Tukey boxplot (outliers excluded) describing statistics of thresholds from 5 clones and 6 rotations at each position within the hand muscle representation. Boxplots of experimental motor threshold (MT) data are included in gray (12 subjects) [41]. Hand muscle representation in L5 surface is marked in blue (right), with green arrow indicating center of TMS coil and direction of induced current (for P–A stimulation).
Figure 8.
Figure 8.. Strength–duration time constants of model neurons match experimental measures.
A) Median time constant (across 5 clones and 6 rotations) for layers with lowest activation thresholds, estimated for each model neuron using their activation thresholds for 30, 60, and 120 μs cTMS pulses. Putative hand muscle representations are outlined in black. B) Strength–duration curves using median neuronal population threshold within the model hand muscle representation and experimentally measured mean (± SD) motor thresholds [14]. cTMS waveforms are shown in the bottom left corner. C) Experimentally estimated time constant [14] (mean ± SD) and model time constants for a range of cutoff threshold percentiles (2.5–50%) within the hand muscle representation.

Comment in

References

    1. Barker AT, Jalinous R, Freeston IL. Non-invasive magnetic stimulation of human motor cortex. Lancet 1985;1:1106–7. doi:10.1016/S0140-6736(85)92413-4. - DOI - PubMed
    1. Lefaucheur JP, Andre-Obadia N, Antal A, Ayache SS, Baeken C, Benninger DH, et al. Evidence-based guidelines on the therapeutic use of repetitive transcranial magnetic stimulation (rTMS). Clin Neurophysiol 2014;125:2150–206. - PubMed
    1. Mueller JK, Grigsby EM, Prevosto V, Petraglia FW, Rao H, Deng Z-D, et al. Simultaneous transcranial magnetic stimulation and single-neuron recording in alert non-human primates. Nat Neurosci 2014;17:1130–6. doi:10.1038/nn.3751. - DOI - PMC - PubMed
    1. Li B, Virtanen JP, Oeltermann A, Schwarz C, Giese MA, Ziemann U, et al. Lifting the veil on the dynamics of neuronal activities evoked by transcranial magnetic stimulation. Elife 2017;6:e30552. doi:10.7554/eLife.30552. - DOI - PMC - PubMed
    1. Romero MC, Davare M, Armendariz M, Janssen P. Neural basis of Transcranial Magnetic Stimulation at the single-cell Level. BioRxiv 2018:405753. doi:10.1101/405753. - DOI - PMC - PubMed

Publication types