. 2019 Dec 1;203(11):2917-2927.
doi: 10.4049/jimmunol.1900674. Epub 2019 Oct 14.

MR1-Independent Activation of Human Mucosal-Associated Invariant T Cells by Mycobacteria

Affiliations

MR1-Independent Activation of Human Mucosal-Associated Invariant T Cells by Mycobacteria

Sara Suliman et al. J Immunol. .

Abstract

Tuberculosis (TB) is the leading cause of mortality from a single infectious agent, Mycobacterium tuberculosis Relevant immune targets of the partially efficacious TB vaccine bacille Calmette-Guérin (BCG) remain poorly defined. Mucosal-associated invariant T (MAIT) cells are MHC-related protein 1 (MR1)-restricted T cells, which are reactive against M. tuberculosis, and underexplored as potential TB vaccine targets. We sought to determine whether BCG vaccination activated mycobacteria-specific MAIT cell responses in humans. We analyzed whole blood samples from M. tuberculosis-infected South African adults who were revaccinated with BCG after a six-month course of isoniazid preventative therapy. In vitro BCG stimulation potently induced IFN-γ expression by phenotypic (CD8+CD26+CD161+) MAIT cells, which constituted the majority (75%) of BCG-reactive IFN-γ-producing CD8+ T cells. BCG revaccination transiently expanded peripheral blood frequencies of BCG-reactive IFN-γ+ MAIT cells, which returned to baseline frequencies a year following vaccination. In another cohort of healthy adults who received BCG at birth, 53% of mycobacteria-reactive-activated CD8 T cells expressed CDR3α TCRs, previously reported as MAIT TCRs, expressing the canonical TRAV1-2-TRAJ33 MAIT TCRα rearrangement. CD26 and CD161 coexpression correlated with TRAV1-2+CD161+ phenotype more accurately in CD8+ than CD4-CD8- MAIT cells. Interestingly, BCG-induced IFN-γ expression by MAIT cells in vitro was mediated by the innate cytokines IL-12 and IL-18 more than MR1-induced TCR signaling, suggesting TCR-independent activation. Collectively, the data suggest that activation of blood MAIT cells by innate inflammatory cytokines is a major mechanism of responsiveness to vaccination with whole cell vaccines against TB or in vitro stimulation with mycobacteria (Clinical trial registration: NCT01119521).


Figures

FIGURE 1.
FIGURE 1.
Identification of CD8+CD26+CD161+ MAIT cells and correlation with MR1 tetramer staining. (A) Gating strategy for PBMC used to estimate concordance of frequencies between 5-OP-RU–loaded MR1 tetramer staining and CD26+CD161+ phenotype as surrogate definitions for CD8+ MAIT cells. (B) Proportions of MR1–5OP-RU tetramer-binding CD8+ T cells, which stain positive for both CD26 and CD161 in PBMC samples from QuantiFERON-TB Gold (QFT)–positive South African adolescents (n = 10). The horizontal line depicts the median, and the error bars depict the ICR. (C) Paired frequencies of CD26+CD161+ and 5-OP-RU–loaded MR1 tetramer+ CD8 T cells in samples depicted in (B). The p values reflect a Wilcoxon signed-rank test between the paired frequencies from each donor.
FIGURE 2.
FIGURE 2.
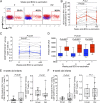
CD8+ MAIT cell responses to in vitro BCG stimulation. (A) Study design for BCG revaccination: individuals with TST induration >15 mm were revaccinated with BCG after 6 mo of isoniazid treatment. Samples for this study were analyzed prevaccination (0 wk), 3, and 52 wk postvaccination (denoted by arrows). (B) Representative flow cytometry plots of CD8 T cells measured by WB-ICS after stimulation with the conditions indicated on the left (from top to bottom: UNS [unstimulated as negative control], ESAT-6/CFP-10 peptide pools, BCG, and PHA as positive control). Plots on the left are gated on CD3+CD8+ T lymphocytes. Plots on the right overlay IFN-γ+ cells (black dots), as gated in the thick black boxes on the left, over total CD3+CD8+ cells (green density plots). The pie charts correspond to the mean frequencies of IFN-γ+ CD26+CD161+ (red) or CD26CD161 (blue) CD8 T cells for each stimulation condition. (C) Frequencies of CD8+CD26+CD161+ cells coexpressing different combinations of IFN-γ and/or TNF-α. Frequencies in unstimulated samples were subtracted from their corresponding Ag-stimulated samples. Horizontal lines represent the median, the boxes represent the IQR, and the whiskers represent the range. (D) Per cell perforin expression in either CD26+CD161+ (red) or CD26CD161 (blue) CD8+ T cells expressed as median fluorescent intensity fold change in BCG-stimulated cells over unstimulated cells. The p values correspond to a Wilcoxon signed-rank test of paired values within each sample.
FIGURE 3.
FIGURE 3.
Changes in MAIT cell function after BCG revaccination. (A) Representative flow cytometry plots showing expression of IFN-γ and perforin in CD26+CD161+ CD8+ T cells from BCG-revaccinated adults. Red boxes demarcate IFN-γ–positive cells in BCG-stimulated whole blood (red dots) overlaid onto unstimulated blood (blue dots). Plots correspond to samples taken prevaccination (left), 3 wk (middle), and 1 y (right) following BCG revaccination. (B) Frequencies of BCG-reactive IFN-γ–expressing CD26+CD161+ CD8+ T cells in individual study participants before (week 0) and after vaccination (weeks 3 and >52). Red line and error bars show median frequencies and IQR in the cohort, respectively. The p values were calculated using a Wilcoxon signed-rank test for paired values. (C) Frequencies of CD26+CD161+ CD8+ T cells (as a proportion of CD3+ T cells) in individual study participants before (week 0) and after vaccination (weeks 3 and >52). Blue line and error bars denote the median and IQR, respectively. The p values were calculated using a Wilcoxon signed-rank test for paired values. (D) Median fluorescence intensities of perforin expression in CD26+CD161+ CD8+ T cells in unstimulated (blue) or BCG-stimulated (red) whole blood samples at prevaccination, 3 wk and 1 y following BCG revaccination. p values were calculated using Wilcoxon signed-rank test for paired unstimulated and BCG-stimulated samples at each timepoint and between BCG-stimulated samples prevaccination and 1 y after vaccination. Horizontal lines represent the median, the boxes represent the IQR, and the whiskers represent the range. (E and F) Frequencies of BCG-reactive IFN-γ–expressing CD8+CD26+CD161+ T cells (left panel) or proportions of CD8+CD26+CD161+ in total T cells (right panel) in 5-wk-old (E) or 9-wk-old (F) infants who were BCG-naive at the time of sample collection (Unvac) or BCG-vaccinated at birth (Vac).
FIGURE 4.
FIGURE 4.
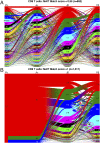
Mycobacteria-reactive MAIT CD8 T cells express canonical MAIT TCR sequences. Variable (V) and joining (J) gene segment usage for TCR α and β pairs in single M. tuberculosis lysate-activated (CD69+CD154+ or CD69+CD137+) CD8 T cells that (A) do not conform to canonical MAIT CDR3α sequences (MAIT Match score <0.95; n = 892) or (B) show an exact match to known MAIT CDR3α clonotypes (MAIT Match score = 1; bottom, n = 1017). Gene segment usage and gene–gene pairing landscapes are illustrated using four vertical stacks (one for each V and J segment) connected by curved paths in which thickness is proportional to the number of TCR clones with the respective gene pairing. Genes are colored by their relative proportion among sorted single cells. Red (most frequent), green (second-most frequent), blue, cyan, magenta, and black, etc.
FIGURE 5.
FIGURE 5.
Concordance between CD26+CD161+ and TRAV1-2+CD161+ phenotypes in CD4CD8 and CD8+ MAIT cells. (A) Flow cytometry gating strategy to identify CD4CD8 (bottom left) and CD8+ (bottom right) MAIT cells from total CD4 T lymphocytes. MAIT cells are gated using either CD26+CD161+ and TRAV1-2+CD161+ phenotypic definitions. (B) Correlation between frequencies of CD26+CD161+ and TRAV1-2+CD161+ cells among total CD4CD8 (left) or CD8+ T cells (right). The p values and correlation coefficients are calculated using the nonparametric Spearman correlation test. (C) Box and whisker plots showing proportions of CD26+CD161+ cells among TRAV1-2+CD161+ cells and converse proportions of TRAV1-2+CD161+ among CD26+CD161+ cells within CD4CD8 (left) or CD8+ T cells (right). The horizonal lines, boxes, and error bars correspond to median proportions, IQR, and range, respectively.
FIGURE 6.
FIGURE 6.
Blood MAIT cell activation in response to stimulation with cytokines. (A) Frequencies of IFN-γ–positive CD4CD8 or CD8+ T MAIT subsets identified either as CD26+CD161+ or TRAV1-2+CD161+ cells in unstimulated control samples or in response to stimulation with 100 ng of recombinant human IL-2, a combination of IL-12 and IL-18, or rIFN-α. (B) Median fluorescence intensities corresponding to perforin expression under the same cytokine stimulation conditions and MAIT subset definitions used in (A). For both (A) and (B), p values were calculated using the Wilcoxon signed-rank test. Horizontal lines represent the median, the boxes represent the IQR, and the whiskers represent the range.
FIGURE 7.
FIGURE 7.
Dependence of BCG or E. coli–induced MAIT cell activation on innate cytokines. (A) Box and whisker plots showing frequencies of IFN-γ–positive CD4CD8 or CD8+ T cell MAIT subsets, all identified in this study as TRAV1-2+CD161+ cells, in response to stimulation with BCG or E. coli in the presence of isotype control Abs or neutralizing Abs against IL-12 and IL-18, MR1, TCR, or the type 1 IFN antagonist (B18R). (B) Median fluorescence intensities corresponding to perforin expression under the same stimulation conditions as (A). For both (A) and (B), p values were calculated using the Wilcoxon signed-rank test.

References

    1. World Health Organization 2017. Global Tuberculosis Report 2017. Available at: http://www.who.int/tb/publications/global_report/gtbr2017_main_text.pdf?....
    1. Mangtani P., Abubakar I., Ariti C., Beynon R., Pimpin L., Fine P. E., Rodrigues L. C., Smith P. G., Lipman M., Whiting P. F., Sterne J. A. 2014. Protection by BCG vaccine against tuberculosis: a systematic review of randomized controlled trials. Clin. Infect. Dis. 58: 470–480. - PubMed
    1. Lewinsohn D. A., Lewinsohn D. M., Scriba T. J. 2017. Polyfunctional CD4+ T cells as targets for tuberculosis vaccination. Front. Immunol. 8: 1262. - PMC - PubMed
    1. Houben R. M., Dodd P. J. 2016. The global burden of latent tuberculosis infection: a re-estimation using mathematical modelling. PLoS Med. 13: e1002152. - PMC - PubMed
    1. Le Bourhis L., Martin E., Péguillet I., Guihot A., Froux N., Coré M., Lévy E., Dusseaux M., Meyssonnier V., Premel V., et al. 2010. Antimicrobial activity of mucosal-associated invariant T cells. [Published erratum appears in 2010 Nat. Immunol. 11: 969.] Nat. Immunol. 11: 701–708. - PubMed

Publication types

MeSH terms

Associated data