. 2019 Oct 29;116(44):22393-22398.
doi: 10.1073/pnas.1908157116. Epub 2019 Oct 14.

TROPOMI reveals dry-season increase of solar-induced chlorophyll fluorescence in the Amazon forest

Affiliations

TROPOMI reveals dry-season increase of solar-induced chlorophyll fluorescence in the Amazon forest

Russell Doughty et al. Proc Natl Acad Sci U S A. .

Abstract

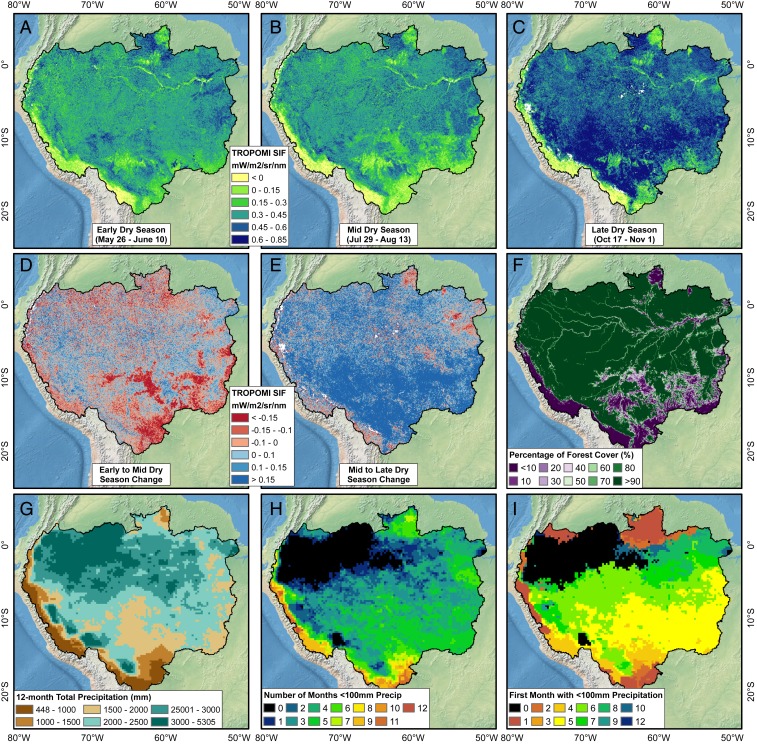
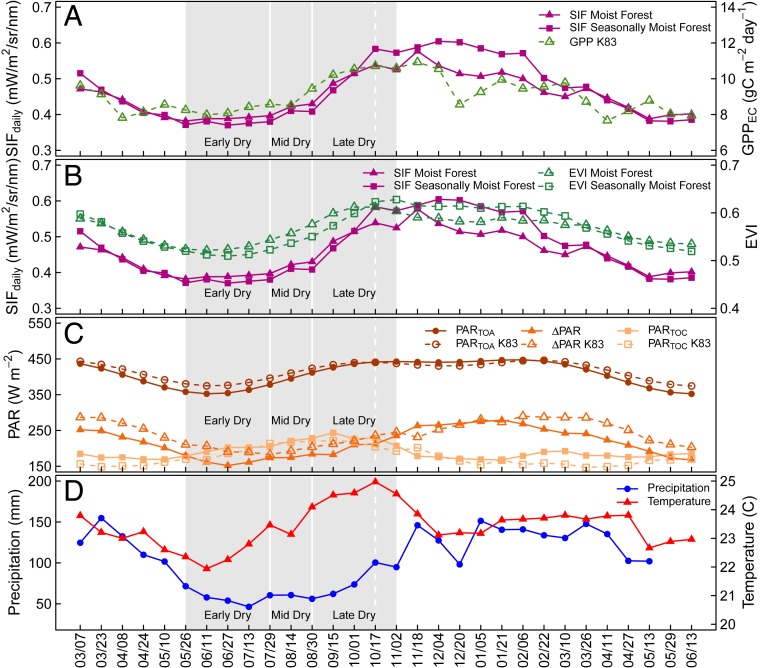
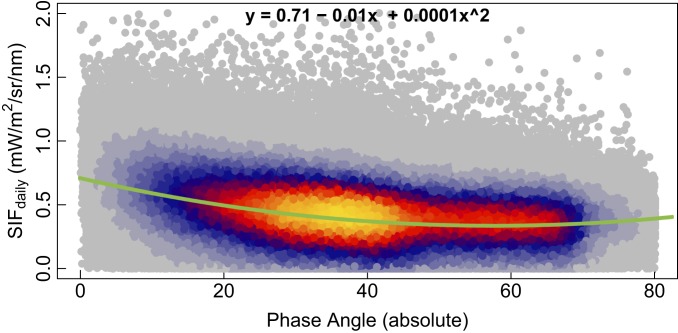
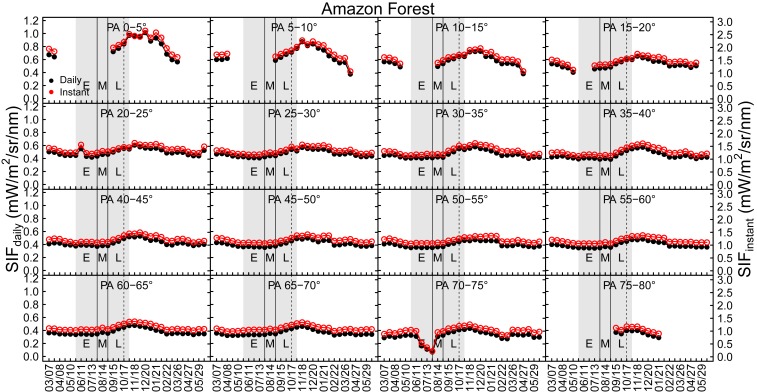
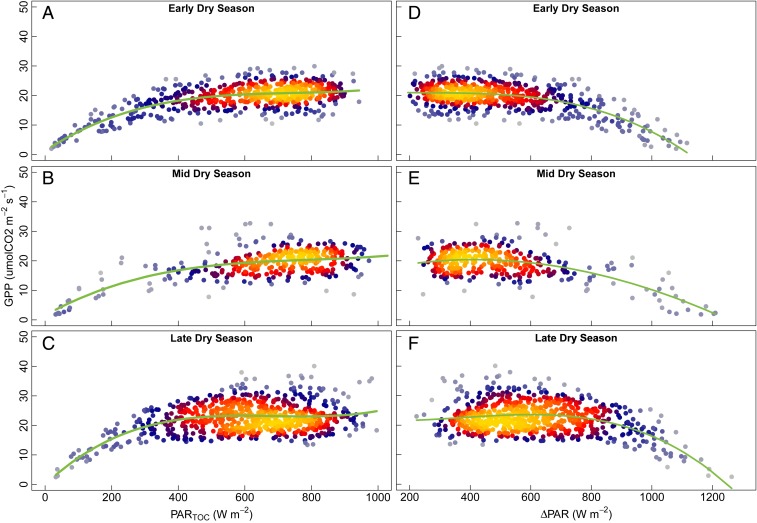
Photosynthesis of the Amazon rainforest plays an important role in the regional and global carbon cycles, but, despite considerable in situ and space-based observations, it has been intensely debated whether there is a dry-season increase in greenness and photosynthesis of the moist tropical Amazonian forests. Solar-induced chlorophyll fluorescence (SIF), which is emitted by chlorophyll, has a strong positive linear relationship with photosynthesis at the canopy scale. Recent advancements have allowed us to observe SIF globally with Earth observation satellites. Here we show that forest SIF did not decrease in the early dry season and increased substantially in the late dry season and early part of wet season, using SIF data from the Tropospheric Monitoring Instrument (TROPOMI), which has unprecedented spatial resolution and near-daily global coverage. Using in situ CO2 eddy flux data, we also show that cloud cover rarely affects photosynthesis at TROPOMI's midday overpass, a time when the forest canopy is most often light-saturated. The observed dry-season increases of forest SIF are not strongly affected by sun-sensor geometry, which was attributed as creating a pseudo dry-season green-up in the surface reflectance data. Our results provide strong evidence that greenness, SIF, and photosynthesis of the tropical Amazonian forest increase during the dry season.

Keywords: EVI; MODIS; geometry; photosynthesis; productivity.


Conflict of interest statement

The authors declare no competing interest.

Figures

Fig. 1.
Fig. 1.
SIF, forest cover, and precipitation in the Amazon Basin. SIF during the (A) early, (B) middle, and (C) late dry season. (D) Middle minus early dry-season SIF. (E) Late minus middle dry-season SIF. (F) Percentage forest cover in each TROPOMI 0.05° pixel. (G) Total precipitation March 2018 to February 2019. (H) Number of months with <100 mm of precipitation. (I) First month with <100 mm precipitation.
Fig. 2.
Fig. 2.
Amazon forest SIF, photosynthesis, PAR, precipitation, and temperature. (A) TROPOMI SIF for moist and seasonally moist forest (>2,000 mm and <2,000 mm MAP), and 5-y mean GPP at the K83 moist forest flux tower site. (B) TROPOMI SIF for moist and seasonally moist forest, and BRDF-corrected EVI from MCD43A4 for moist and seasonally moist forest. (C) Basin-wide PAR at the top of the atmosphere (TOA), the top of the canopy (TOC), and the difference between the 2 (∆PAR), and 5-y means of TOA, TOC, and ∆PAR from the K83 flux tower site. (D) Basin-wide mean precipitation and temperature. Points are 16-d means. Shaded areas represent the early, middle, and late dry season. The dashed line approximates when TROPOMI’s phase angles are lowest.
Fig. 3.
Fig. 3.
Relationship between phase angle and TROPOMI SIFdaily. Points are 1,000,000 random samples from all soundings (n = 22,876,383) in the Amazon Basin during 7 March 2018 to 29 June 2019.
Fig. 4.
Fig. 4.
TROPOMI SIFdaily and SIFinstant at different phase angles for the Amazon forest. Areas shaded in gray represent the early (E), middle (M), and late (L) dry seasons. The dashed line approximates when TROPOMI’s phase angles are lowest. These trends were also illustrated for moist and seasonally moist forest with greater than and less than 2,000-mm MAP and for nonforest in SI Appendix, Figs. S6–S8. Dates represent the first day of TROPOMI’s 16-d revisit cycle. Tick marks are every 16 d, and labels are every 32 d. The complete date range represented is 7 March 2018 to 29 June 2019.
Fig. 5.
Fig. 5.
Dry-season light and shade response of photosynthesis in the Amazon at TROPOMI overpass times (∼12:45 PM to 2:30 PM LST) at K83 eddy tower. Light-response curves of photosynthesis and PAR at the top of the canopy (PARTOC) in (A) early dry season, (B) middle dry season, and (C) late dry season. Shade-response curves of photosynthesis and the absorption and reflection of PAR incoming from the top of the atmosphere (∆PAR) before reaching the canopy in (D) early dry season, (E) middle dry season, and (F) late dry season.

References

    1. Xiao X., Hagen S., Zhang Q., Keller M., Moore B. III, Detecting leaf phenology of seasonally moist tropical forests in South America with multi-temporal MODIS images. Remote Sens. Environ. 103, 465–473 (2006).
    1. Huete A. R., et al. , Amazon rainforests green‐up with sunlight in dry season. Geophys. Res. Lett. 33, L06405 (2006).
    1. Saleska S. R., et al. , Dry-season greening of Amazon forests. Nature 531, E4–E5 (2016). - PubMed
    1. Morton D. C., et al. , Amazon forests maintain consistent canopy structure and greenness during the dry season. Nature 506, 221–224 (2014). - PubMed
    1. Myneni R. B., et al. , Large seasonal swings in leaf area of Amazon rainforests. Proc. Natl. Acad. Sci. U.S.A. 104, 4820–4823 (2007). - PMC - PubMed

Publication types