. 2019 Oct 14;10(1):4673.
doi: 10.1038/s41467-019-11863-w.

Evaluation of integrin αvβ6 cystine knot PET tracers to detect cancer and idiopathic pulmonary fibrosis

Affiliations

Evaluation of integrin αvβ6 cystine knot PET tracers to detect cancer and idiopathic pulmonary fibrosis

Richard H Kimura et al. Nat Commun. .

Abstract

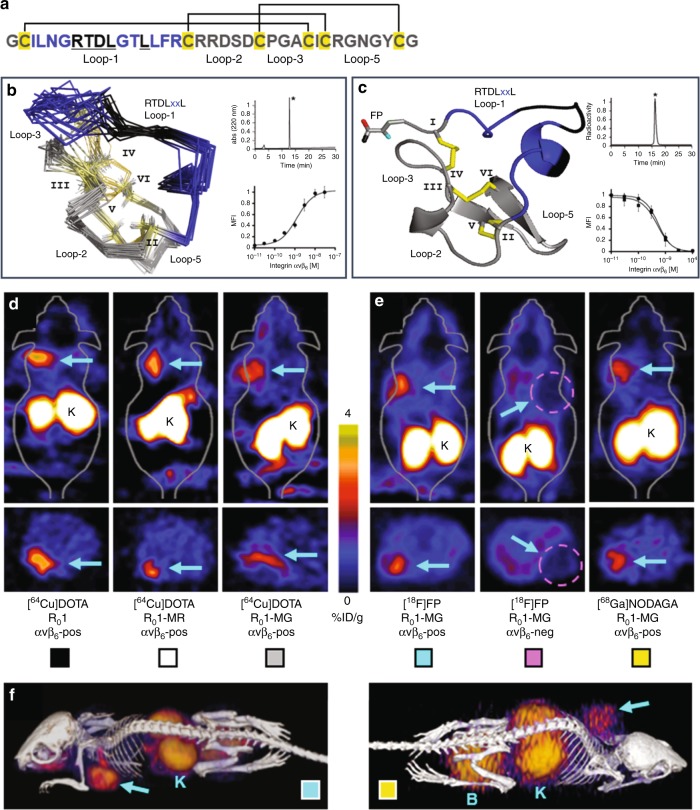
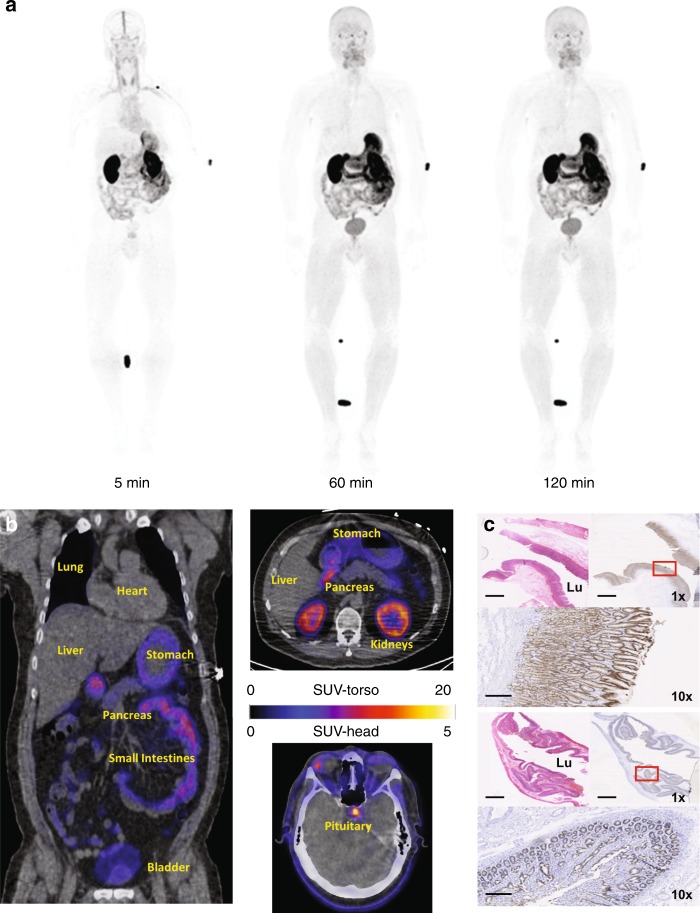
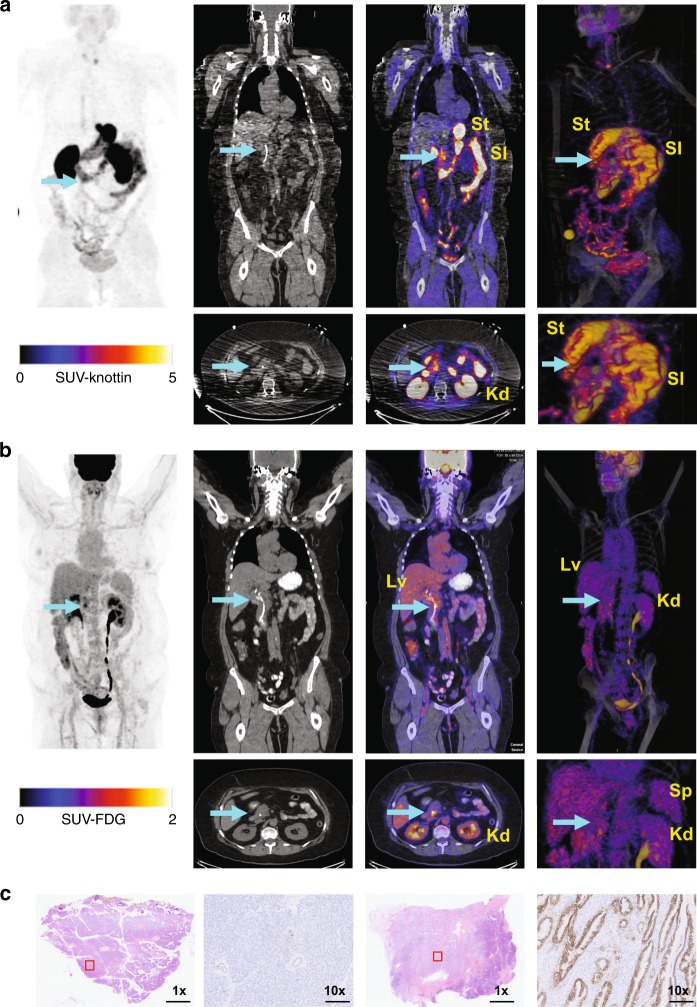
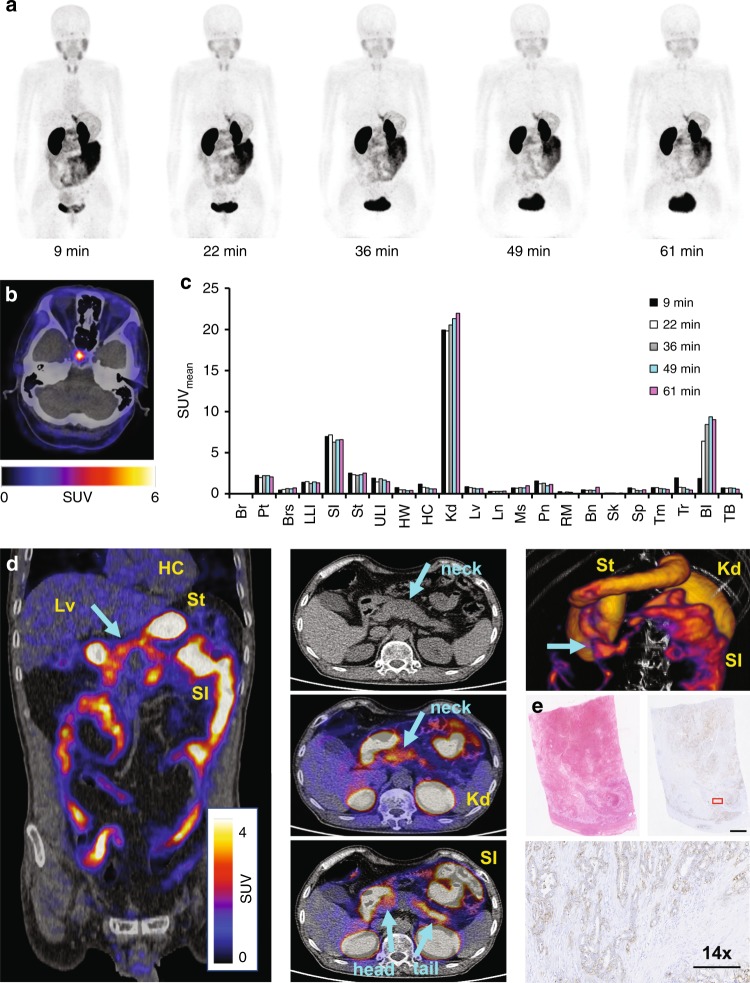
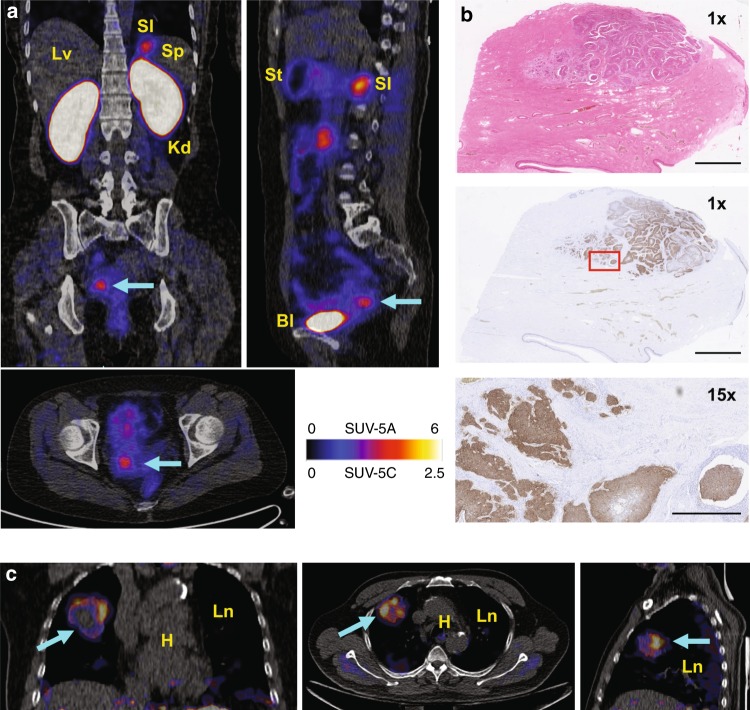
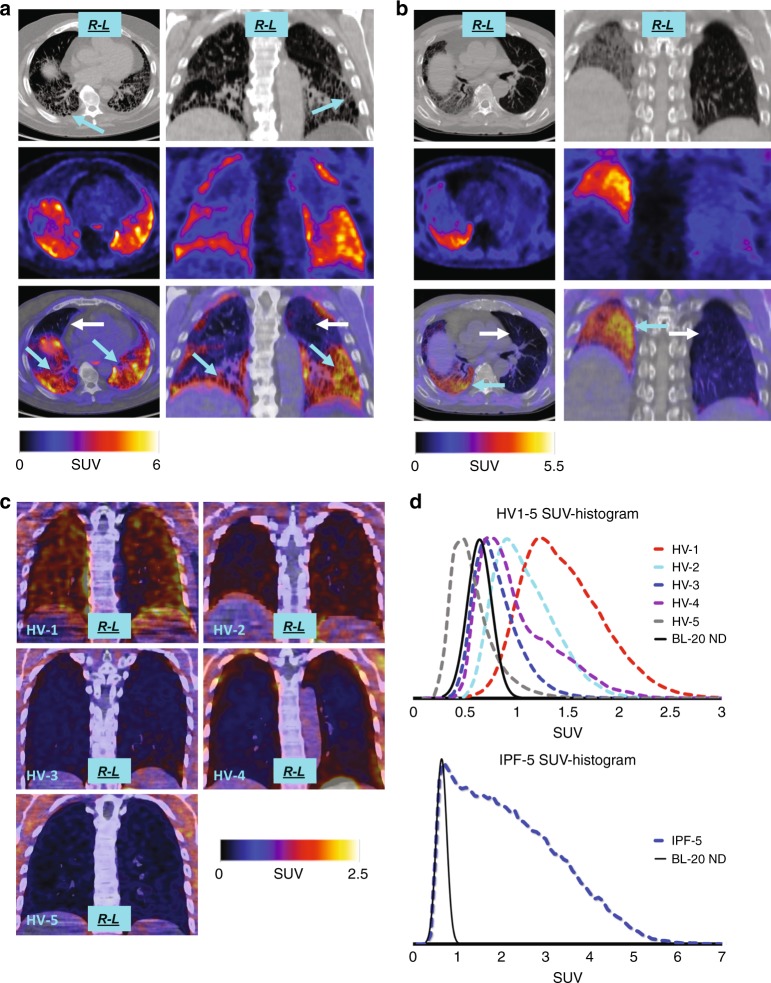
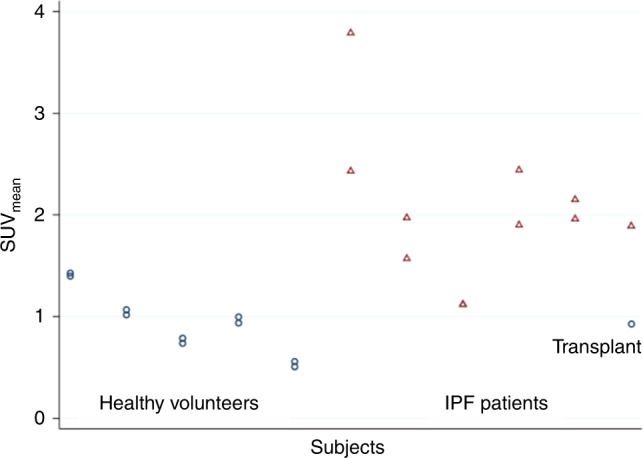
Advances in precision molecular imaging promise to transform our ability to detect, diagnose and treat disease. Here, we describe the engineering and validation of a new cystine knot peptide (knottin) that selectively recognizes human integrin αvβ6 with single-digit nanomolar affinity. We solve its 3D structure by NMR and x-ray crystallography and validate leads with 3 different radiolabels in pre-clinical models of cancer. We evaluate the lead tracer's safety, biodistribution and pharmacokinetics in healthy human volunteers, and show its ability to detect multiple cancers (pancreatic, cervical and lung) in patients at two study locations. Additionally, we demonstrate that the knottin PET tracers can also detect fibrotic lung disease in idiopathic pulmonary fibrosis patients. Our results indicate that these cystine knot PET tracers may have potential utility in multiple disease states that are associated with upregulation of integrin αvβ6.


Conflict of interest statement

The authors declare no competing interests.

Figures

Fig. 1
Fig. 1
Summary of the knottin PET ligand. a Primary structure of lead candidate R01-MG. The engineered active loop-1 is shown in blue. The integrin avβ6 core binding motif, RTDLxxL, is shown in black. The framework residues are shown in gray. Cysteine residues are shown in yellow and the pattern of disulfide bonds are indicated by the connecting lines. b Ensemble of 10 lowest energy three-dimensional 1H NMR of R01-MG structures. c Crystal structure of non-radioactive reference standard, [19F]FP-R01-MG-F2, at <1 Å. The carbonyl oxygen of the ester is shown in cyan. The fluorine atom is shown in red. The methyl carbon is shown in black. The insert on top shows the RP-HPLC trace of R01-MG, and the radio-RP-HPLC trace of the purified clinical-grade PET tracer [18F]FP-R01-MG-F2, respectively. The product is indicated by the asterisk. The insert on the bottom shows b the equilibrium binding curve of between R01-MG expressed on yeast surface and soluble human integrin αvβ6 (KD = 1.24 ± 0.21 nM S.D.), and c the competition binding between unlabeled R01-MG (IC50 = 0.61 ± 0.31 nM S.D., circles) or the N-terminus labeled version [19F]FP-R01-MG-F2 (IC50 = 0.56 ± 0.46 nM S.D., squares) vs. yeast surface expressed R01-MG, respectively. d Comparison at 1 h post injection of the top 3 [64Cu]DOTA-labeled PET tracer candidates, R01 (black), R01-MR (white) and R01-MG (gray). e Comparison at 1 h post injection of the [18F]FP labeled lead candidate R01-MG in integrin αvβ6 positive (cyan) vs. αvβ6 negative tumor models (magenta, dashed circle in the figure). In vivo validation of the [68Ga]NODAGA-R01-MG at 1 h post injection (yellow). f Volume rendered PET/CT images of [18F]FP-R01-MG (cyan) and [68Ga]NODAGA-R01-MG (yellow) in integrin avβ6 positive models at 1 h post injection. df The cyan arrows point to the tumor. The letters K and B represent the kidneys and bladder, respectively. (df and Table 3, below) Box colors are colored legends that cross-relate the images to the quantification table
Fig. 2
Fig. 2
[18F]FP-R01-MG-F2 PET imaging of five healthy human volunteers. a Representative whole-body [18F]FP-R01-MG-F2 maximum intensity projection (MIP) PET images of a healthy volunteer (50-year-old male) show the biodistribution of PET tracer at ~ 5, 60, and 120 min post injection (p.i.). Focal uptake near the elbow and between the legs are the site of intravenous injection, and a tube containing the reference calibration standard, respectively. b Axial and coronal PET/CT images of the same healthy volunteer at 1 h p.i. Close-ups of the chest and abdominal regions show the heart (SUVmean ~ 0.9), liver (SUVmean ~ 0.8), lung (SUVmean ~ 1.3), pancreas (SUVmean ~ 1.9), stomach (SUVmean ~ 12.6), small intestines (SUVmean ~ 7.8), kidneys (SUVmean ~ 14.3), and bladder (5.9). Accumulation of the tracer is evident in the pituitary gland (SUVmean ~ 5). c H&E staining (top left) and integrin αvβ6 (top right and bottom) immunohistochemical analysis of healthy stomach and small bowel tissue, where uptake was relatively high (Supplementary Table 7, below), shows expression of integrin αvβ6 on the luminal (Lu) side of these organs. Scale bars on the 1x and 10x images represent 2.5 cm and 250 mm, respectively
Fig. 3
Fig. 3
[18F]FP-R01-MG-F2 PET imaging of pancreatic cancer. a [18F]FP- R01-MG-F2 and (b) [18F]FDG images, from left to right, show MIP, CT, PET/CT (axial and coronal) and volume rendered PET/CT (full and magnified) images of a 71-year-old female pancreatic cancer patient at ~60 min post injection. The liver, kidneys, small intestines, stomach and spleen are denoted by Lv, Kd, SI, St, and Sp, respectively. The cyan arrow points to the tumor. a Accumulation of [18F]FP- R01-MG-F2 at the head of the tumor is shown by the cyan arrow (SUVmean = 6.3). PET/CT images demonstrate several regions of relatively high accumulation including the kidneys, the main clearance route, and the stomach (St), small intestines (SI) where integrin αvβ6 is expressed. b An area of focal [18F]FDG uptake (SUVmean = 2.3) which is located within the tumor coincides with a biliary stent (white tube) that is apparent in the CT image. The tracer is seen draining out of the kidney (Kd) through the ureter and collecting in the bladder in the MIP, and volume rendered PET/CT images. c From left to right, H&E staining and IHC analysis of the resected pancreatic mass, which included some healthy pancreatic tissue. A section of normal pancreas (left) and a section of malignant tissue (right) are shown. Scale bars on the 1x and 10x images represent 2.5 cm and 250 mm, respectively
Fig. 4
Fig. 4
[68Ga]NODAGA-R01-MG biodistribution and PET imaging of pancreatic cancer. a Sequential MIP PET images of a 69-year-old female study subject show the biodistribution of the tracer for up to ~1 h after intravenous administration. b PET/CT image of the brain shows focal uptake of the tracer in the pituitary gland. c ROI analysis of the representative patient shown above. The following organs are shown: brain (Br), pituitary gland (Pt), breast (Brs), lower large intestine (LLI), small intestine (SI), stomach (St), upper large intestine (ULI), heart wall (HW), heart contents (HC), kidney (Kd), liver (Lv), lung (Ln), muscle (Ms), red marrow (RM), osteogenic cells (Bn), skin (Sk), spleen (Sp), thymus (Tm), thyroid (Tr), bladder (Bl), and total body (TB). d Coronal and axial PET/CT images (left and center) and volume rendered PET/CT image (top right) acquired from a patient diagnosed with pancreatic cancer. The arrows indicate the location of the tumor. High uptake is observed throughout most of the pancreas including the head (SUVmean ~ 3.1), uncinate process, neck and tail (SUVmean ~ 4.4). Comparatively, the SUVmean = 1.8 ± 0.5 S.D. for normal pancreas (n = 5). e IHC confirms integrin αvβ6 expression in the viable part of the tumor. Red box represents area shown at 14x magnification in image below. Pathology report indicated a large amount of necrosis in the tumor. Scale bars on the unmagnified and 14x images represent 2.5cm and 250 mm, respectively. Source data for panel c are provided in a Source Data file
Fig. 5
Fig. 5
[68Ga]NODAGA-R01-MG PET imaging of cervical cancer and lung cancer. a Coronal (top left), sagittal (top right) and axial (bottom left) planes of PET/CT images of a 47-year-old cervical cancer patient shows tracer accumulation in the tumor (cyan arrow). Bl, Kd, Lv, SI, Sp, and St refer to the bladder, kidneys, liver, small intestine, spleen and stomach, respectively. b H&E staining and IHC analysis confirm expression of integrin αvβ6 by the larger diffuse cancer cells. Integrin αvβ6 was not expressed by the normal cells of the cervix surrounding the tumor. Red box represents area shown at 15x magnification in image below. Scale bars on the 1x and 15x images represent 2.5 cm and 250 mm, respectively. c Coronal (left), axial (middle) and sagittal (right) planes of PET/CT Images of a 70-year-old patient diagnosed with poorly differentiated squamous cell carcinoma of the lung (SUVmean = 2.2). The cyan arrow points to the tumor. The healthy lung and heart are indicated by Ln and H, respectively
Fig. 6
Fig. 6
[18F]FP-R01-MG-F2 PET imaging of lungs: IPF patients and healthy volunteers. a PET/CT images of IPF-5, a 72-year-old male IPF patient with a definite-UIP pattern, as indicated by peripheral, basilar predominant reticulation and honeycombing (CT, top, cyan arrows). Correspondingly, the PET tracer is concentrated in regions of greatest fibrosis in the areas of high reticulation and honeycombing in the lung bases (PET, middle and PET/CT, bottom, cyan arrows). In contrast, relatively healthy regions of the upper and anterior lungs show low tracer accumulation (PET/CT, bottom, white arrows). b PET/CT images of a 72-year-old male IPF patient with a single transplanted (2016) left lung (white arrows), which is relatively devoid of the PET tracer. The fibrotic right lung (IPF) shows elevated PET tracer levels in areas that also correspond to the highly fibrosed regions demonstrated on CT (PET/CT, bottom, cyan arrows). c PET/CT images of the lungs of five healthy volunteers, varying in age from 20- to 48-year old. The group demonstrated a range of lower [18F]FP- R01-MG-F2 accumulation in their lungs. d The dashed lines represent histograms of SUVs found within ROI contours of total lung. The upper histogram represents the healthy volunteers (HV-1 to HV-5). The lower histogram (dashed blue line) represents patient IPF-5 shown in panel A. For comparative purposes, the solid black curves in both (top and bottom graphs) represent baseline-20 SUVmean and normal distribution (BL-20 ND) derived from the two youngest healthy volunteers in their 20 s (HV-3 and HV-5)
Fig. 7
Fig. 7
Mean SUVs of healthy volunteers and IPF patients. Mean SUVs from healthy volunteers and IPF patients are shown as circles and triangles, respectively. The single transplanted lung in patient IPF-4 is shown as a circle (far right). The right/left mean SUVs for patient IPF-3 were identical and appear as a single triangle (Supplemental Table 13). The right/left correlation is 0.90 and 0.70 for HVs and IPF patients, respectively. The average SUVmeans ± S.D.s for the right lungs of HVs (n = 5) and the IPF group (n = 6) is 0.92 ± 0.33 and 2.04 ± 0.91, respectively (p = 0.0087). Source data are referred to in the Source Data File

References

    1. Raghu G, et al. An official ATS/ERS/JRS/ALAT statement: idiopathic pulmonary fibrosis: evidence-based guidelines for diagnosis and management. Am. J. Respir. Crit. care Med. 2011;183:788–824. doi: 10.1164/rccm.2009-040GL. - DOI - PMC - PubMed
    1. Saini G, et al. alphavbeta6 integrin may be a potential prognostic biomarker in interstitial lung disease. Eur. Respir. J. 2015;46:486–494. doi: 10.1183/09031936.00210414. - DOI - PubMed
    1. Ruoslahti E. RGD and other recognition sequences for integrins. Annu Rev. Cell Dev. Biol. 1996;12:297–715. doi: 10.1146/annurev.cellbio.12.1.697. - DOI - PubMed
    1. Kimura RH, Cheng Z, Gambhir SS, Cochran JR. Engineered knottin peptides: a new class of agents for imaging integrin expression in living subjects. Cancer Res. 2009;69:2435–2442. doi: 10.1158/0008-5472.CAN-08-2495. - DOI - PMC - PubMed
    1. Haubner R, Maschauer S, Prante O. PET radiopharmaceuticals for imaging integrin expression: tracers in clinical studies and recent developments. Biomed. Res Int. 2014;2014:1–17. - PMC - PubMed

Publication types