. 2019 Dec;4(12):2538-2551.
doi: 10.1038/s41564-019-0583-6. Epub 2019 Oct 14.

Evasion of autophagy mediated by Rickettsia surface protein OmpB is critical for virulence

Affiliations

Evasion of autophagy mediated by Rickettsia surface protein OmpB is critical for virulence

Patrik Engström et al. Nat Microbiol. 2019 Dec.

Abstract

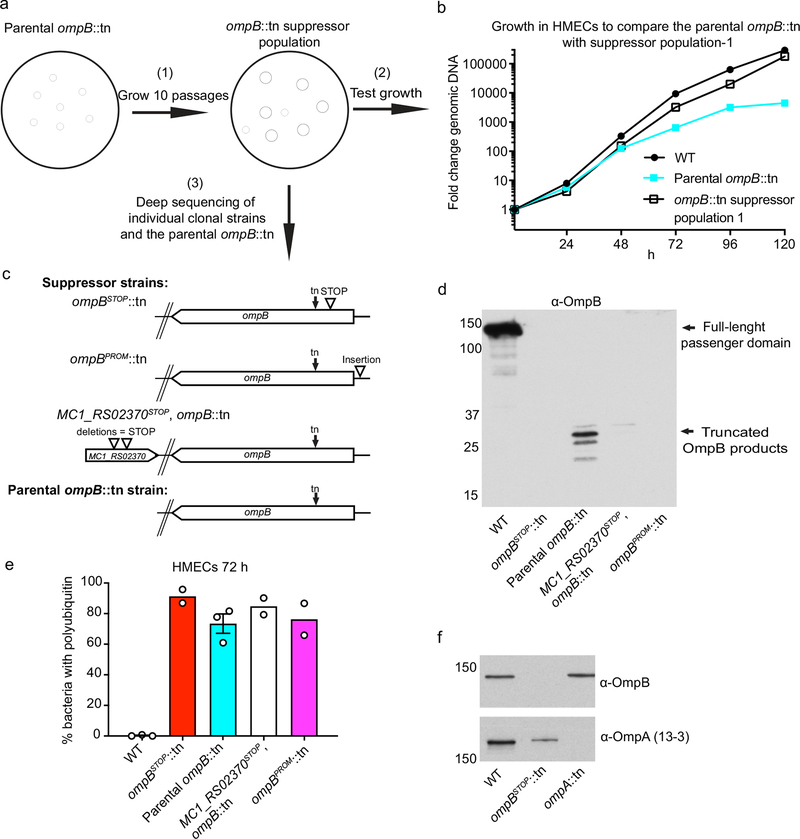
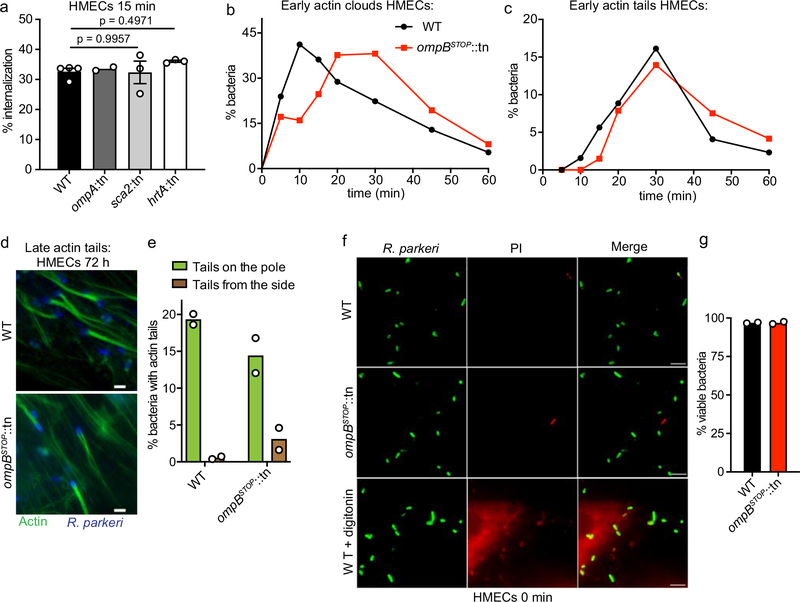
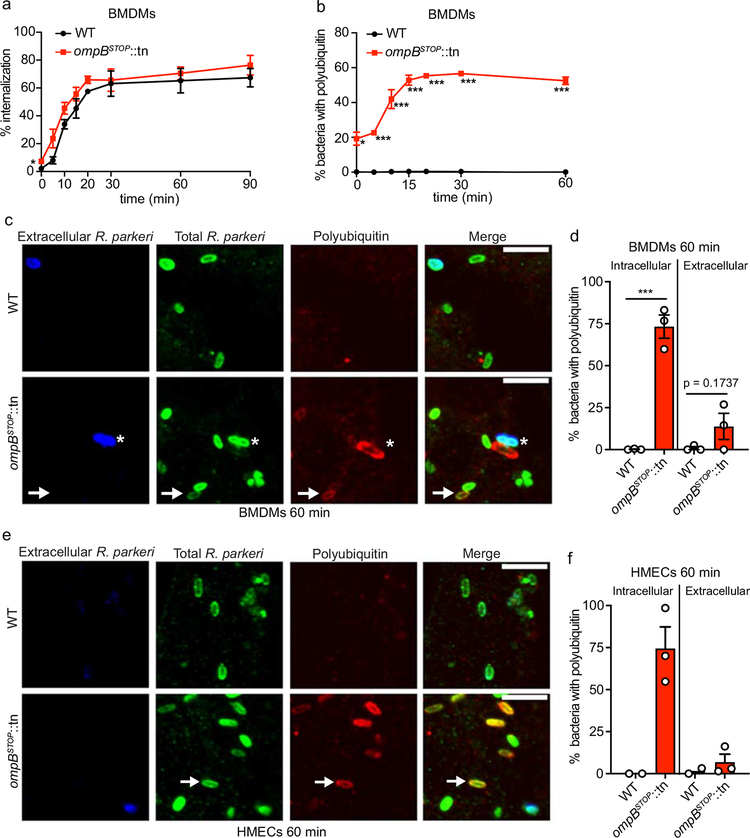
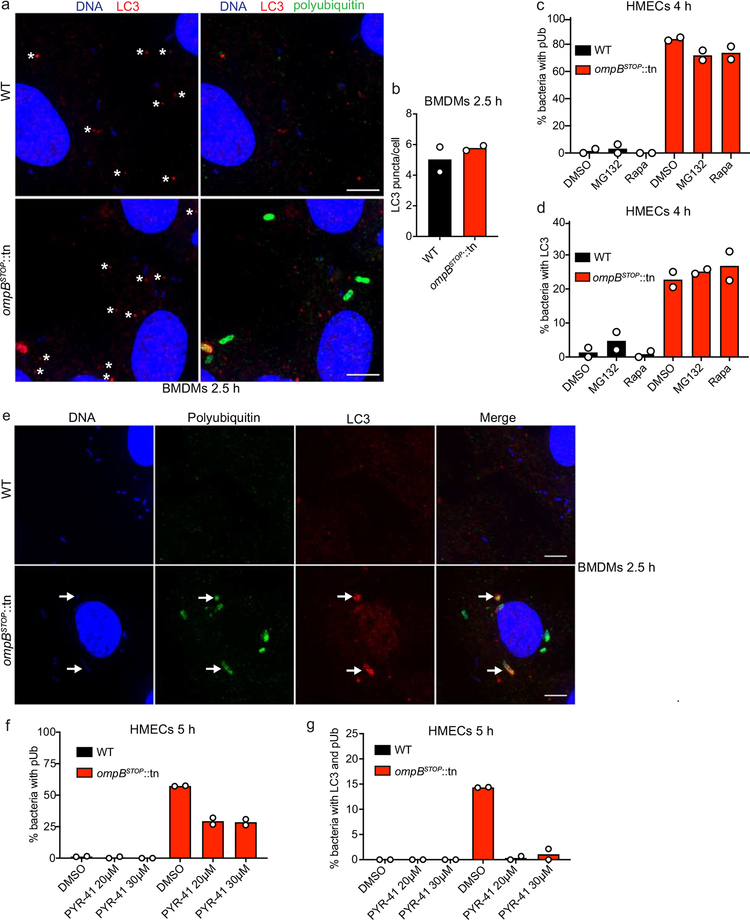
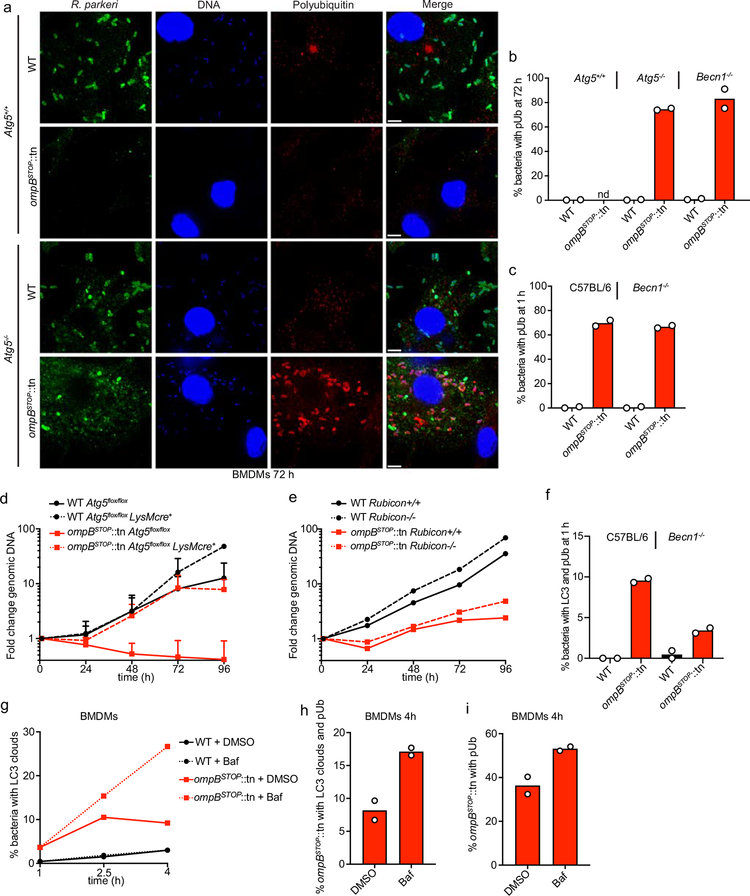
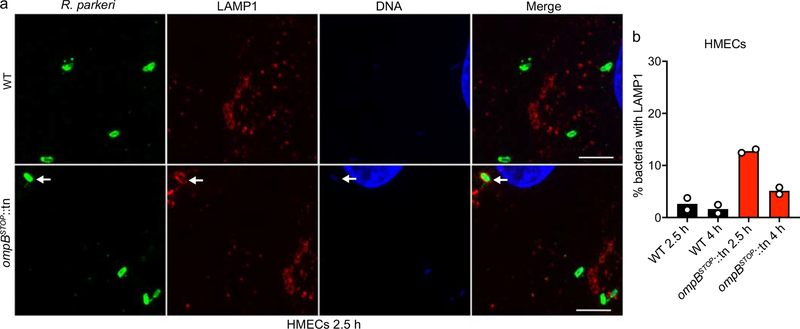
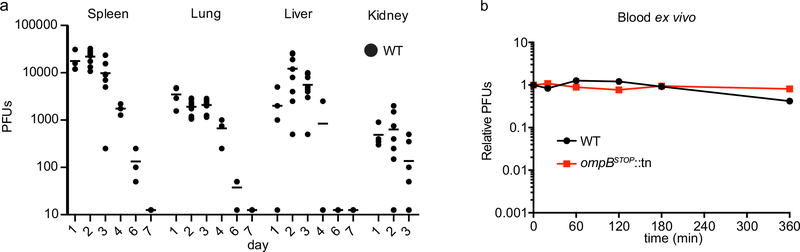
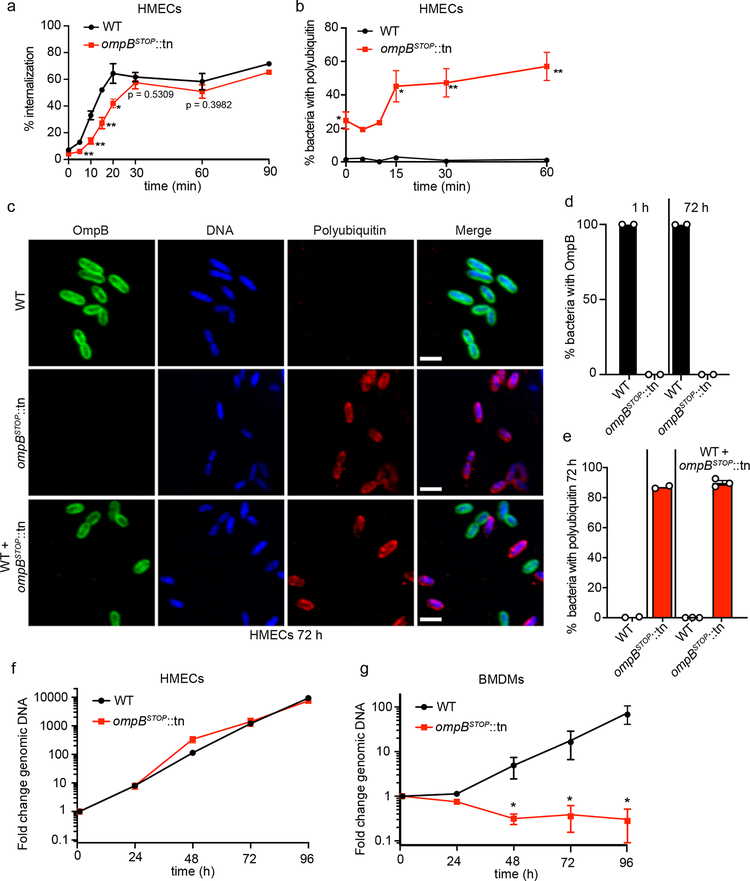
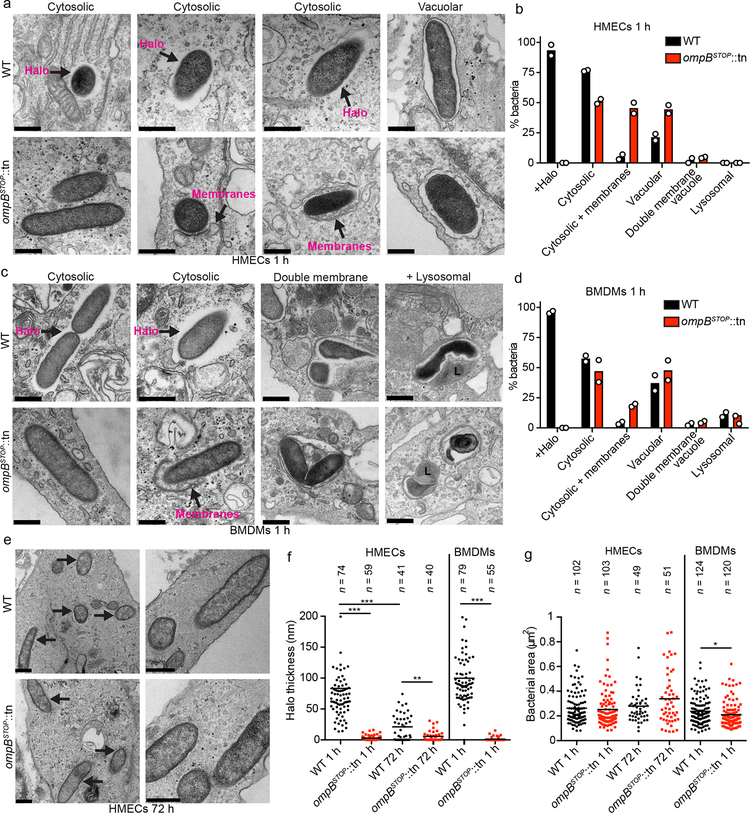
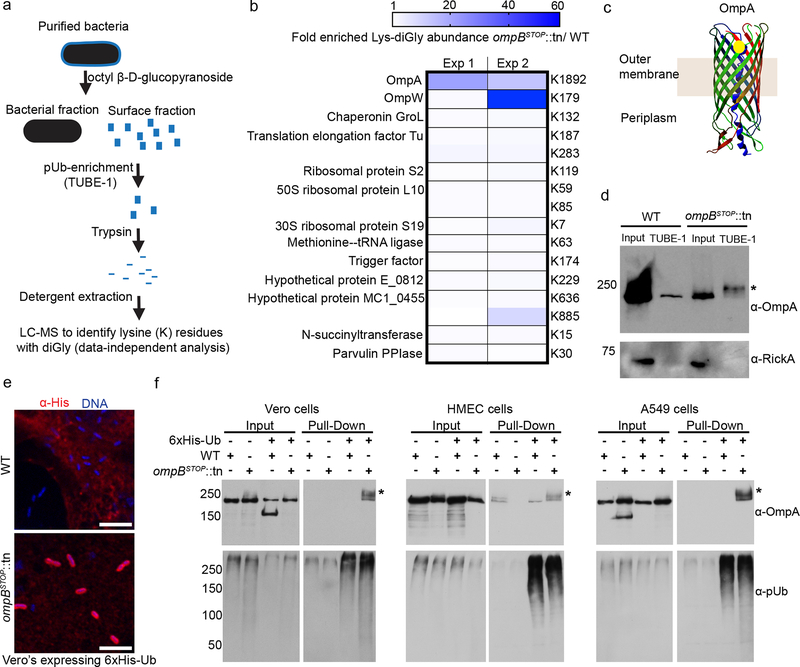
Rickettsia are obligate intracellular bacteria that evade antimicrobial autophagy in the host cell cytosol by unknown mechanisms. Other cytosolic pathogens block different steps of autophagy targeting, including the initial step of polyubiquitin-coat formation. One mechanism of evasion is to mobilize actin to the bacterial surface. Here, we show that actin mobilization is insufficient to block autophagy recognition of the pathogen Rickettsia parkeri. Instead, R. parkeri employs outer membrane protein B (OmpB) to block ubiquitylation of the bacterial surface proteins, including OmpA, and subsequent recognition by autophagy receptors. OmpB is also required for the formation of a capsule-like layer. Although OmpB is dispensable for bacterial growth in endothelial cells, it is essential for R. parkeri to block autophagy in macrophages and to colonize mice because of its ability to promote autophagy evasion in immune cells. Our results indicate that OmpB acts as a protective shield to obstruct autophagy recognition, thereby revealing a distinctive bacterial mechanism to evade antimicrobial autophagy.


Conflict of interest statement

COMPETING INTEREST

The authors declare no competing interest.

Figures

Extended Data Fig. 1
Extended Data Fig. 1. Isolation and characterization of suppressors of the parental ompB::tn strain
(a) A graphic depiction of the scheme for the isolation of suppressor mutations. The parental ompB::tn strain was subjected to 10 serial passages in Vero cells (step 1). The mixed suppressor population was then tested for growth in HMECs (step 2) and compared with the parental ompB::tn strain. Clonal strains that appeared to have larger plaque phenotypes than parental ompB::tn were isolated from the two independent mixed suppressor populations, propagated in Vero cells, and deep sequenced (step 3). (b) Growth curves in HMECs of WT, parental ompB::tn, and ompB::tn suppressor population (passage 10, selection-1) (starting MOI: 0.002) as measured by genomic equivalents using qPCR. Data are means (n = 2). (c) Diagram of the ompB genomic regions and other relevant genes, showing the location of the transposon insertions (tn) in: the parental ompB::tn strain (at base pair (bp) position 1045462 in the R. parkeri genome); ompBSTOP::tn (with an additional 23-bp deletion at position 1045835–1045857); ompBPROM::tn (with an additional 17-bp insertion in the promoter region of ompB at position 1046683); and MC1_RS02370STOP, ompB::tn (with an additional two deletions, of 112 at position 461273–461384 and 125 bp at position 461425–461549 in a gene encoding a predicted glycosyltransferase (MC1_RS02370), leading to a premature stop codon). (d) Western blot of 106 30%-purified WT, ompB::tn and ompB suppressor strains probed for OmpB (anti-OmpB antibody). Reduced levels of truncated OmpB products were observed in the suppressor strains (n = 2). (e) Quantification of the percentage of bacteria that co-localize with polyubiquitin at 72 hpi. Data are mean ± SEM (WT, n = 3; ompBSTOP::tn, n = 2; parental ompB::tn, n = 3; MC1_RS02370STOP, ompB::tn, n = 2; ompBPROM::tn, n = 2; ≥136 bacteria were counted for each strain and infection). (f) Western blot of 106 30%-purified WT, ompBSTOP::tn and ompA::tn strains probed for OmpB (anti-OmpB antibody) and OmpA (13–3 antibody) (n = 1).
Extended Data Fig. 2
Extended Data Fig. 2. The host ubiquitin machinery is necessary to label the ompB mutant with ubiquitin chains
(a) Immunofluorescence micrographs of infected HMEC cells treated with the E1-inhibitor PYR-41 (50 μM) or DMSO control for 6 h (66–72 hpi) and stained as in (Fig. 1a). Scale bars, 5 μm. (b) Quantification of the percentage of polyubiquitin-positive bacteria. Data are mean ± SEM (n = 3; statistical comparisons between PYR-41 treated and control ompBSTOP::tn and WT infections were determined by the unpaired Student’s t-test (two-sided); ***, p <0.001; * p <0.05; ≥229 bacteria were counted for each infection). (c) Quantification of the percentage of bacteria that showed rim-like surface localization of the indicated ubiquitin-chain at 72 hpi in HMECs based on staining with ubiquitin linkage-specific antibodies. Data are mean ± SEM (n = 4; statistical comparisons between the ompBSTOP::tn and WT bacteria were determined by the unpaired Student’s t-test (two-sided); ***, p < 0.001; ≥164 bacteria were counted per strain, ubiquitin-chain stain and experiment).
Extended Data Fig. 3
Extended Data Fig. 3. In HMECs, OmpA/Sca2/17-kDa-antigen are not required for R. parkeri invasion, and OmpB is not required for actin mobilization or bacterial membrane integrity
(a) Quantification of the percentage of internalization into HMECs at 15 mpi, visualized by differential staining of extracellular versus total R. parkeri. Data are mean ± SEM (WT, n = 3; ompA::tn, n = 2; sca2::tn, n = 3; hrtA::tn, n = 3; ≥180 bacteria were counted for each strain and infection; means were not significantly different between WT, sca2::tn and hrtA::tn by a one-way ANOVA with Tukey’s post hoc-test). (b and c) Quantification of the percentage of bacteria with (b) early actin clouds or (c) actin tails. The delayed recruitment of actin can be explained by slower internalization of ompBSTOP::tn bacteria. Data are mean (n = 2; ≥84 bacteria were counted for each strain and infection for each time point). (d) Representative immunofluorescence micrographs of bacteria (blue; anti-Rickettsia 14–13 antibody) with late actin tails (green; Alexa 488 phalloidin). (e) Quantification of the percentage of WT and ompBSTOP::tn bacteria with late actin tails that started from the bacterial pole (green bar) or the side of the bacteria (brown bar). (n = 2; ≥274 bacteria were counted for each strain and infection). (f) Fluorescence micrographs of bacteria attached to HMECs prior to internalization, first stained with propidium iodide (PI; red) prior to fixation to label dead bacteria, and next fixed and stained for total bacteria (green; anti-Rickettsia 14–13 antibody). The bottom panels are a positive control in which 50 μg/ml digitonin was included to permeabilize bacteria and HMECs prior PI staining. Scale bars, 2 μm. (g) Quantification of the bacterial viability (membrane integrity) as determined by PI staining. Data are means (n = 2; ≥182 bacteria were counted for each strain and infection)
Extended Data Fig. 4
Extended Data Fig. 4. OmpB is critical to block ubiquitylation shortly after internalization into HMECs and BMDMs
(a) Quantification of the percentage of internalization into BMDMs from 0–90 mpi, visualized by differential staining of extracellular versus total R. parkeri. Data are mean ± SEM (0, 15, 30, 60, 90 min, n = 3; 5, 10, 20 min, n = 3; ≥80 bacteria were counted for each strain, infection and time-point; statistical comparisons with WT for each time point were made by the unpaired Student’s t-test (two-sided); *, p < 0.05). (b) Quantification of the percentage of WT and ompBSTOP::tn mutant bacteria that co-localize with polyubiquitin from 0–60 mpi. Data are mean ± SEM (0, 5, 10, 20, 30, 60 min: n = 3; 15 min: n = 5); ≥80 bacteria were counted for each strain, infection, and time point; statistical comparisons with WT for each time point were made by the unpaired Student’s t-test (two-sided); *, p < 0.05; **, p < 0.01; ***, p < 0.001). (c) Immunofluorescence micrographs of BMDMs infected with WT and ompBSTOP::tn mutant at 60 mpi, stained for extracellular R. parkeri (blue; anti-Rickettsia I7205 antibody), total R. parkeri (green; anti-Rickettsia I7205 antibody), polyubiquitin (red; FK1 antibody), and a merged image. Arrows indicate an intracellular bacterium that is positive for polyubiquitin. The stars indicate an extracellular bacterium that is polyubiquitin-negative in BMDMs. Scale bars, 5 μm. (d) Quantification of the percentage of intracellular and extracellular WT and ompBSTOP::tn mutant bacteria that co-localize with polyubiquitin. Data are mean ± SEM (n = 3; ≥122 bacteria were counted for each strain and infection; statistical comparisons were by an unpaired Student’s t-test (two-sided); ***, p < 0.01). (e) Immunofluorescence micrographs of HMECs infected with WT and ompBSTOP::tn mutant at 60 mpi, stained as in (c). Arrows indicate an intracellular bacterium that is polyubiquitin-positive. Scale bars, 5 μm. (f) Quantification of the percentage of intracellular and extracellular WT and ompBSTOP::tn mutant bacteria that co-localize with polyubiquitin in HMECs. Data are mean ± SEM (WT, n = 2; ompBSTOP::tn, n = 3; ≥79 bacteria were counted for each strain and infection).
Extended Data Fig. 5
Extended Data Fig. 5. OmpB is required for R. parkeri to proliferate in BMDMs
(a) Fluorescence micrographs of BMDMs infected with WT and ompBSTOP::tn bacteria at 48 hpi. Left panels show cellular and bacterial genomic DNA (blue; Hoechst). Right panels show bacteria (green; anti-Rickettsia antibody I7205), cellular and bacterial genomic DNA (blue, Hoechst), and actin (red; Alexa 568 phalloidin). Scale bars, 20 μm. (b) Quantification of bacteria per BMDM cell for WT, ompBSTOP::tn, and MC1_RS05535::tn bacteria, using Hoechst to count the number of cell nuclei and the number of bacteria. Data are mean (n = 2; 5 fields of view per infection and strain were used to count the number of bacteria per cell). (c) Fluorescence micrographs of BMDMs infected with WT and ompBSTOP::tn bacteria at 96 hpi, stained as in (a). Scale bars, 20 μm. (d-f) Quantification of (d) the mean number of bacteria per BMDM cell as in (b) (n = 2), (e) mean number of host cells per field of view (n = 2; 5 fields of view per infection and strain were used to count the number of host cell per field of view), and (f) the percentage LDH release, normalized to Triton-X100-lysed cells, all determined for WT, ompBSTOP::tn, and uninfected cells. Data are mean ± SEM (n = 3; statistical comparisons between WT and ompBSTOP::tn infected and uninfected cell were performed using a one-way ANOVA with Tukey’s post hoc-test; **, p < 0.01; ***, p < 0.001).
Extended Data Fig. 6
Extended Data Fig. 6. In BMDMs, neither OmpA nor the gene downstream of ompB is required for halo formation
(a) TEM images of ompA::tn and MC1_RS05535::tn mutant bacteria in BMDMs at 1 hpi. Scale bars, 1 μm. (b) Quantification of halo thickness for WT (n = 79), ompA::tn (n = 12) and MC1_RS05535::tn (n = 17) bacteria. All data points are presented, and the lines indicate the means (statistical comparisons were performed using a Mann-Whitney rank-sum test (two-sided)). Data for WT are the same as that shown in Fig. 3.
Extended Data Fig. 7
Extended Data Fig. 7. Ubiquitylation of the ompB mutant is a prerequisite for LC3 recruitment and activation of autophagy does not increase LC3 recruitment to ompB mutant bacteria
(a) Immunofluorescence micrographs showing cellular LC3 puncta (red; rabbit anti-LC3 antibody) that do not co-localize with bacteria (blue; Hoechst) in infected BMDMs. Stars indicate cellular LC3 puncta. (b) Quantification of cellular LC3 puncta per host cell at 2.5 hpi in BMDMs. Data are mean (n = 2; 5 fields of view per infection and strain were used to count the number of cellular puncta). (c) Quantification of the percentage of bacteria co-localizing with pUb in HMECs treated with 500 nM rapamycin (Rapa), 20 μM MG132 or DMSO control for 3 h (from 1 hpi to 4 hpi) and fixed at 4 hpi. Data are mean (n = 2; ≥87 ompBSTOP::tn bacteria were counted for each infection and treatment). (d) Quantification of the percentage of bacteria co-localizing with LC3 in HMECs treated with 500 nM rapamycin (Rapa), 20 μM MG132 or DMSO control for 3 h (1–4 hpi) and fixed at 4 hpi. Data are means (n = 2; ≥87 ompBSTOP::tn bacteria were counted for each infection and treatment). (e) Immunofluorescence micrographs of BMDMs infected with WT and ompBSTOP::tn mutant at 2.5 hpi, stained for R. parkeri (blue; Hoechst), polyubiquitin (green; FK1 antibody), LC3 (red; rabbit anti-LC3 antibody), and a merged image. Arrows indicate bacteria that are positive for both polyubiquitin and LC3. Scale bars, 5 μm. Related to Fig. 5k. (f, g) Quantification of the percentage of (f) polyubiquitin-positive bacteria and (g) bacteria with both LC3 and polyubiquitin, after 4 h treatment (1–5 hpi) with PYR-41. Data are means (n = 2; ≥110 ompBSTOP::tn bacteria were counted per infection and experiment).
Extended Data Fig. 8
Extended Data Fig. 8. Autophagy is the primary mechanism that restricts the growth of ompB mutant bacteria in macrophages, and OmpB protects R. parkeri from ubiquitylation in autophagy-deficient cells.
(a) Immunofluorescence micrographs of Atg5+/+ or Atg5−/− BMDMs infected with WT or ompBSTOP::tn bacteria at 72 hpi, stained for bacteria (green), cellular and bacterial genomic DNA (blue; Hoechst), polyubiquitin (red; FK1 antibody). Scale bars, 5 μm. (b) Quantification of the percentage of bacteria that co-localize with polyubiquitin in Atg5+/+, Atg5−/−, or Becn1−/− BMDMs at 72 hpi (nd indicates that too few ompBSTOP::tn bacteria were visualized in Atg5+/+ cells to quantify a percentage). Data are mean (n = 2; ≥250 bacteria were counted for each strain and infection). (c) Quantification of the percentage of bacteria that co-localize with polyubiquitin in C57BL/6 or Becn1−/− BMDMs at 1 hpi. Data are mean (n = 2; ≥84 bacteria were counted for each strain and infection). (d) Combined growth curves of WT and ompBSTOP::tn in Atg5+/+ or Atg5−/− BMDMs as measured by genomic equivalents using qPCR. Data are the same as that shown in Fig. 6a and b and are mean ± SEM (n = 4). (e) Growth curves of WT and ompBSTOP::tn in Rubicon−/− or Rubicon+/+ BMDMs as measured in (d). Data are mean (n = 2). (f) Quantification of the percentage LC3 and polyubiquitin-positive bacteria in C57BL/6 or Becn1−/− BMDMs at 1 hpi. Data are mean (n = 2; ≥84 bacteria were counted for each strain and infection). (g) Quantification of the percentage LC3-positive bacteria at 1, 2.5 and 4 hpi in BMDMs treated with 300 nM bafilomycin A (Baf) or corresponding amount of DMSO, starting at 1 hpi. Data are means (n = 2; ≥111 ompBSTOP::tn bacteria were counted per infection, experiment and time-point). (h,i) Quantification of the percentage (h) LC3-positive ompBSTOP::tn that also co-localize with polyubiquitin at 4 hpi, and (i) polyubiquitin-positive ompBSTOP::tn, after bafilomycin A treatment as in (g). Data are mean (n = 2; ≥119 ompBSTOP::tn bacteria were counted per infection and experiment).
Extended Data Fig. 9
Extended Data Fig. 9. In HMECs, OmpB is required for a subpopulation of R. parkeri to avoid trafficking to a LAMP1-positive compartment
(a) Immunofluorescence micrographs of HMECs infected with WT or ompBSTOP::tn mutant at 2.5 hpi, and stained for R. parkeri (green; anti-Rickettsia I7205 antibody), cellular and bacterial genomic DNA (blue; Hoechst), and LAMP1 (red; anti-LAMP1 antibody). Scale bars, 5 μm. (b) Quantification of the percentage bacteria that co-localize with LAMP1 at 2.5 and 4 hpi in HMECs. Data are mean (n = 2; ≥106 bacteria were counted for each strain, infection and time point).
Extended Data Fig. 10
Extended Data Fig. 10. WT R. parkeri establishes an infection of mouse organs but is eventually cleared
(a) C57BL/6 mice were infected with 107 PFUs of 30%-purified WT R. parkeri. At 1–7 d post infection, organs were harvested at the indicated time points and homogenized, and PFUs were counted. Medians are indicated as bars (1 d, n = 4; 2 d, n = 8; 3 d, n = 8; 4 d, n = 3; 6 d, n = 3; 7 d, n = 5). (b) Relative PFU counts for WT or ompBSTOP::tn bacteria following incubation in blood from uninfected mice at 37°C for the indicated times. PFUs were normalized to 0 mpi. Data are mean ± SEM (n = 2 for all time points, except 0 and 20 min, n = 3; statistical comparisons were by an unpaired Student’s t-test (two-sided) and no statistical difference was observed between WT and ompBSTOP::tn at 20 min; p = 0.46).
Fig. 1.
Fig. 1.. In HMECs, R. parkeri surface protein OmpB is required for avoidance of polyubiquitylation.
(a) Immunofluorescence micrographs showing the indicated strains of R. parkeri (green; anti-Rickettsia I7205 antibody), cellular and bacterial genomic DNA (blue; Hoechst), polyubiquitin (red; FK1 antibody) and a merged image at 72 hpi. Note that the ompA::tn bacteria are not detected with the anti-Rickettsia antibody but are visualized with Hoechst stain. Scale bars, 5 μm. (b) Diagram of ompB and surrounding genes in the indicated mutants, showing the location of the transposon insertions (tn) in: ompB (at base pair (bp) position 1045462 in the R. parkeri genome; accession number NC_017044.1); MC1_RS05535, hypothetical protein (at bp position 1040923); MC1_RS05545, pseudogene (at bp position 1047186). Also indicated is the premature stop codon (STOP) suppressor mutation in ompBSTOP::tn (a 23-bp deletion at position 1045835–1045857). Note that the genome of the ompBSTOP::tn mutant was sequenced and the only mutations were in ompB (see Extended Data Fig. 1 and the Data availability section). (c) Quantification of the percentage of bacteria that showed rim-like surface localization of polyubiquitin at 72 hpi. Data are mean ± standard error of the mean (SEM) (WT, n = 4; ompBSTOP::tn, n = 4; MC1_RS05535::tn, n = 3; MC1_RS05545::tn, n = 3; MC1_RS05545::tn, n = 3; ompA::tn, n =3; sca2::tn, n = 3; hrtA::tn, n = 2; rickCE::tn, n = 2; ≥110 bacteria were counted in each infection; statistical comparisons between the ompBSTOP::tn and WT, MC1_RS05535::tn, MC1_RS05545::tn, ompA::tn and sca2::tn were determined by the unpaired Student’s t-test (two-sided); ***, p < 0.001). (d) Western blot of gradient-purified WT and ompBSTOP::tn bacteria probed for host polyubiquitin and for the R. parkeri RickA protein as a loading control (n = 2).
Fig. 2.
Fig. 2.. OmpB acts locally on R. parkeri to promote polyubiquitin avoidance, and OmpB is required for bacterial growth in BMDMs but not in HMECs.
(a) Quantification of the percentage of invasion of HMECs from 0–90 mpi, visualized by differential staining of extracellular versus total R. parkeri. Data are mean ± SEM (0, 20, 30, 60 min, n = 3; 5, 10, 15 min, n = 4; 90 min, n = 2; ≥85 bacteria were counted for each strain, infection and time-point; statistical comparisons between ompBSTOP::tn and WT for each time point were made by the unpaired Student’s t-test (two-sided); *, p < 0.05; **, p < 0.01). (b) Quantification of the percentage of WT and ompBSTOP::tn mutant bacteria that co-localize with polyubiquitin from 0–60 mpi. Data are mean ± SEM (0, 15, 30, 60 min, n = 3; 5, 10 min, n = 2; statistical comparisons between ompBSTOP::tn and WT were made by the unpaired Student’s t-test (two-sided); *, p < 0.05; **, p < 0.01; ≥85 bacteria were counted for each strain, infection and time point. (c) Immunofluorescence micrographs of HMECs infected with WT (upper panel), ompBSTOP::tn (middle panel), or with both WT and ompBSTOP::tn (lower panel), at 72 hpi stained for OmpB (green, anti-OmpB antibody), polyubiquitin (red; FK1 antibody), and DNA (blue; Hoechst). Scale bars, 2 μm. (d) Quantification of the mean percentage of WT and ompBSTOP::tn mutant bacteria in HMECs that have OmpB homogeneously distributed at the surface of each bacterium at 1 and 72 hpi (n = 2; for 1 hpi, ≥109 bacteria were counted per strain; for 72 hpi, ≥724 bacteria were counted per strain). (e) Quantification of the percentage of WT and ompBSTOP::tn mutant bacteria positive for polyubiquitin in HMECs infected with WT, ompBSTOP::tn, or co-infected with both. In the mixed infected, WT and ompBSTOP::tn bacteria were distinguished using the anti-OmpB antibody. Data are mean ± SEM (singly infected cells, n = 2; mixed infected cells, n = 3; ≥880 bacteria were counted for each infection). (f) Growth curves of WT and ompBSTOP::tn in HMECs from 0–96 hpi as measured by genomic equivalents using qPCR. Data are mean ± SEM (n = 3; means were not significantly different by an unpaired Student’s t-test (two-sided); 24 h, p > 0.99; 48 h, p = 0.10; 72 h, p > 0.99; 96 h, p = 0.40). (g) Growth curves of WT and ompBSTOP::tn in BMDMs from 0–96 hpi as in (f). Data are mean ± SEM (n = 4; statistical comparisons with WT were by the Mann-Whitney rank-sum test (two-sided); *, p < 0.05).
Fig. 3.
Fig. 3.. OmpB is required for the formation of an electron-lucent halo in host cells.
(a and c) TEM images of WT and ompBSTOP::tn mutant bacteria in (a) HMECs or (c) BMDMs at 1 hpi, in the indicated cellular locations. Arrows indicate halos that appear as electron-lucent areas around WT bacteria, and membranes associated with bacteria, as labeled. Scale bars, 500 nm. (b and d) Mean percentage of WT and bacteria ompBSTOP::tn mutant bacteria in (b) HMECs or (d) BMDMs with the indicated characteristics or location: with halo (Halo+), cytosolic, cytosolic associated with (+) membranes (bacteria were associated with double membranes or membrane-bound organelles over part of their surface or at their poles), in a single membrane vacuole(vacuolar), in a double membrane vacuole, or in a lysosome (bacteria surrounded by electron-dense material that often had irregular shapes53) (n = 2; ≥50 bacteria per strain and host cell type were counted in each experiment). (e) TEM images of WT and ompBSTOP::tn bacteria at 72 h in HMEC cells. Arrows indicate bacteria. Scale bars, 500 nm. (f) Quantification of halo thickness in HEMCs at 1 hpi and 72 hpi, and in BMDMs at 1 hpi. All data points are presented, and the lines indicate the means (statistical comparisons were by the Mann-Whitney rank-sum test (two-sided); **, p < 0.01; ***, p < 0.001). (g) Quantification of the bacterial body area (excluding the halo) in HEMCs at 1 hpi and 72 hpi, and in BMDMs at 1 hpi. All data points are presented, and the lines indicate the means of (statistical comparisons were by the Mann-Whitney rank-sum test (two-410sided); *, p < 0.05).
Fig. 4.
Fig. 4.. OmpB protects OmpA against ubiquitylation in diverse host cell lines.
(a) A graphic depiction of the experimental workflow for enrichment of polyubiqutylated proteins from the bacterial surface fraction prior to liquid chromatography-mass spectrometry (LC-MS) analysis. Note: TUBE-1 is pan-specific and binds most ubiquitin linkages. (b) Heat map representation of bacterial proteins for which there is enrichment of Lys-diGly peptides (blue boxes) in ompBSTOP::tn compared with WT bacteria after the approach in panel (a), or equal abundance (white boxes) between ompBSTOP::tn and WT bacteria. Data were from n = 2 independent experiments performed in technical triplicates. (c) Predicted structure of candidate substrate OmpA with identified diGly site shown as yellow circle. (d) Western blot of polyubiquitin-enriched samples from gradient-purified bacteria (prepared as shown in (a)), probed for OmpA (residual detection of OmpA from WT bacteria is likely due to non-specific binding to the TUBE1-beads) and RickA (as a bacterial loading control). The asterisk* shows a size shift of OmpA indicating that it is ubiquitylated (n = 2). (e) Immunofluorescence micrographs of Vero cells expressing 6xHis-ubiquitin and infected with WT or ompBSTOP::tn bacteria for 24 h, showing bacterial genomic DNA (blue, Hoechst) and 6xHis-ubiquitin (red, anti-His antibody) (n = 3). Scale bars, 5 μm. (f) Western blot of Ni-NTA affinity-purified samples from control cells or cells expressing 6xHis-ubiquitin, infected with WT or ompBSTOP::tn bacteria for 26 h, and probed for OmpA or polyubiquitin (FK1). The asterisks* indicate OmpA from 6xHis-ubiquitin-expressing cells infected with ompBSTOP::tn exhibits higher molecular weights than endogenous OmpA, consistent with ubiquitylation (Vero, n = 4; HMEC, n = 2; A549, n = 2).
Fig. 5.
Fig. 5.. OmpB is required to avoid both recruitment of autophagy receptors and LC3.
(a-f) Immunofluorescence micrographs of (a, c, e) HMECs or (b, d, f) BMDMs infected with WT (upper panels) or ompBSTOP::tn mutant (lower panels) at 1 hpi, and stained for R. parkeri (green; anti-Rickettsia I7205 antibody), cellular and bacterial genomic DNA (blue; Hoechst), and (a, b) p62 (red; anti-p62 antibody), (c, d) NDP52 (red; anti-NDP52 antibody), or (e, f) LC3 (red; anti-LC3 antibody). Right panels show merged images. Arrows indicate ompBSTOP::tn bacteria positive for p62, NDP52, or LC3. The star in (e) indicates LC3 puncta that co-localize with ompBSTOP::tn. Scale bars, 5 μm. Image adjustments of each autophagic marker, R. parkeri, and DNA, were applied equally for both bacterial strains and cell types (exception, LC3, between HMECs and BMDMs). (g, h) Quantification of the percentage of WT or ompBSTOP::tn mutant bacteria that localized with (g) p62 or (h) NDP52 in BMDMs (left) or HMECs (right) at the indicated times post infection. Data are mean (n = 2; ≥91 bacteria were counted for the 1 hpi time point for each experiment; ≥350 bacteria were counted for the 72 hpi time point for each experiment). (i, j) Quantification of the percentage of WT or ompBSTOP::tn mutant bacteria that localized with LC3 in (i) BMDMs or (j) HMECs at the indicated times post infection. Data are mean ± SEM (BMDMs, n = 3, ≥143 bacteria were counted for each strain, infection and time-point; HMECs 2 h, n = 2; 20 min and 6 h, n = 3; 1 h, n = 4; 3 h, n = 5; ≥77 bacteria were counted for each strain, infection and time-point; statistical comparisons were by an unpaired Student’s t-test (two-sided); **, p < 0.01; ***, p < 0.001). (k) Quantification of the percentage LC3-postive ompBSTOP::tn mutant bacteria that co-localize with polyubiquitin at 2.5 and 4 hpi in BMDMs and HMECs. Data are mean ± SEM (BMDMs, n = 3; ≥74 bacteria were counted for each strain, infection and time-point; HMECs, n = 2; ≥101 bacteria were counted for each strain and experiment) (micrographs of BMDMs are shown in Extended Data Fig. 7e).
Fig. 6.
Fig. 6.. OmpB interferes with autophagy and promotes R. parkeri growth in macrophages.
(a-c) Growth curves of WT and ompBSTOP::tn in BMDMs from (a) Atg5flox/flox (Atg5+/+), (b) Atg5flox/flox-LysMcre+ (ATG5−/−), or (c) Beclin1flox/flox-LysMcre+ (Becn1−/−) mice from 0–96 hpi as measured in Fig. 2g. Data are mean ± SEM (Atg5+/+, n = 4; Atg5−/−, n = 4; Becn1−/−, n = 3; statistical comparisons for each time point were by the Mann-Whitney rank-sum test (two-sided); *, p < 0.05). (d) Immunofluorescence micrographs of BMDMs infected with WT (upper panels) or ompBSTOP::tn mutant (lower panels) at 4 hpi, and stained for R. parkeri (green), cellular and bacterial genomic DNA (blue; Hoechst), and LAMP1 (red; anti-LAMP1 antibody). Scale bars, 5μm. Higher magnification images, scale bars, 1 μm. Arrows indicate LAMP1-positive bacteria. (e). Quantification of the percentage LAMP1-positive bacteria at 1, 2.5 and 4 hpi in BMDMs. Data are mean ± SEM (1 h, n = 2; 2.5, 4 h, n = 3 ; ≥78 bacteria were counted for each strain, infection and time point; statistical comparisons between WT and ompBSTOP::tn were performed using a one-way ANOVA with Tukey’s post hoc-test; *, p < 0.05). (f) Quantification of the percentage LAMP1-positive bacteria at 4 hpi in WT or Becn1−/− BMDMs. Data are mean ± SEM (n = 3; ≥111 bacteria were counted per infection and experiment; statistical comparisons were by a one-way ANOVA with Tukey’s post hoc-test; ***, p < 0.001). (g) Mice were intravenously infected with 107 PFUs of WT or ompBSTOP::tn bacteria, organs were harvested at indicated time points and homogenized, and PFUs were counted. All data points are shown, and medians are indicated as bars (for WT infected mice at 2 h, n = 6; 24 h, n = 8; 48 h, n = 14; 72 h, n= 10; for ompBSTOP::tn infected mice at 2 h, n = 6; 24 h, n = 5; 48 h, n = 5; 72 h, n = 4). Note that the limit of detection was different between liver and the other organs due to the fact that concentrated liver homogenate interfered with PFU determination. At each time point, PFU counts between WT and ompBSTOP::tn mutant were p < 0.05 as determined by the Mann-Whitney rank-sum test (two-sided). (h) C57BL/6 (WT, n = 4; ompBSTOP::tn, n = 5), Atg5+/+ (n = 5) or Atg5−/− (n = 5) mice were intravenously infected with 107 PFUs of WT or ompBSTOP::tn bacteria, organs were harvested at 2 h and homogenized, and PFUs were counted. All data points are shown, and medians are indicated as bars. Statistical omparisons were by the Mann-Whitney rank-sum test (two-sided); *, p < 0.05; ** p < 0.01.

References

    1. Burgdorfer W, Friedhoff KT & Lancaster JL Jr. Natural history of tick-borne spotted fever in the USA. Susceptibility of small mammals to virulent Rickettsia rickettsii. Bull. World. Health. Organ 35, 149–153 (1966). - PMC - PubMed
    1. Wright CL, Sonenshine DE, Gaff HD & Hynes WL. Rickettsia parkeri Transmission to Amblyomma americanum by Cofeeding with Amblyomma maculatum 491(Acari: Ixodidae) and Potential for Spillover. J. Med. Entomol 52, 1090–1095, doi:10.1093/jme/tjv086 (2015). - DOI - PubMed
    1. Krawczak FS & Labruna MB. The rice rat Euryoryzomys russatus, a competent amplifying host of Rickettsia parkeri strain Atlantic rainforest for the tick Amblyomma ovale. Ticks Tick Borne Dis. 9, 1133–1136, doi:10.1016/j.ttbdis.2018.04.013 (2018). - DOI - PubMed
    1. Walker DH & Ismail N. Emerging and re-emerging rickettsioses: endothelial cell infection and early disease events. Nat. Rev. Microbiol 6, 375–386, doi:10.1038/nrmicro1866 (2008). - DOI - PubMed
    1. Paddock CD et al. Rickettsia parkeri rickettsiosis and its clinical distinction from Rocky Mountain spotted fever. Clin. Infect. Dis 47, 1188–1196, doi:10.1086/592254 (2008). - DOI - PubMed

Publication types

MeSH terms

Substances