. 2019 Dec;37(12):1452-1457.
doi: 10.1038/s41587-019-0290-0. Epub 2019 Oct 14.

High-throughput sequencing of the transcriptome and chromatin accessibility in the same cell

Affiliations

High-throughput sequencing of the transcriptome and chromatin accessibility in the same cell

Song Chen et al. Nat Biotechnol. 2019 Dec.

Abstract

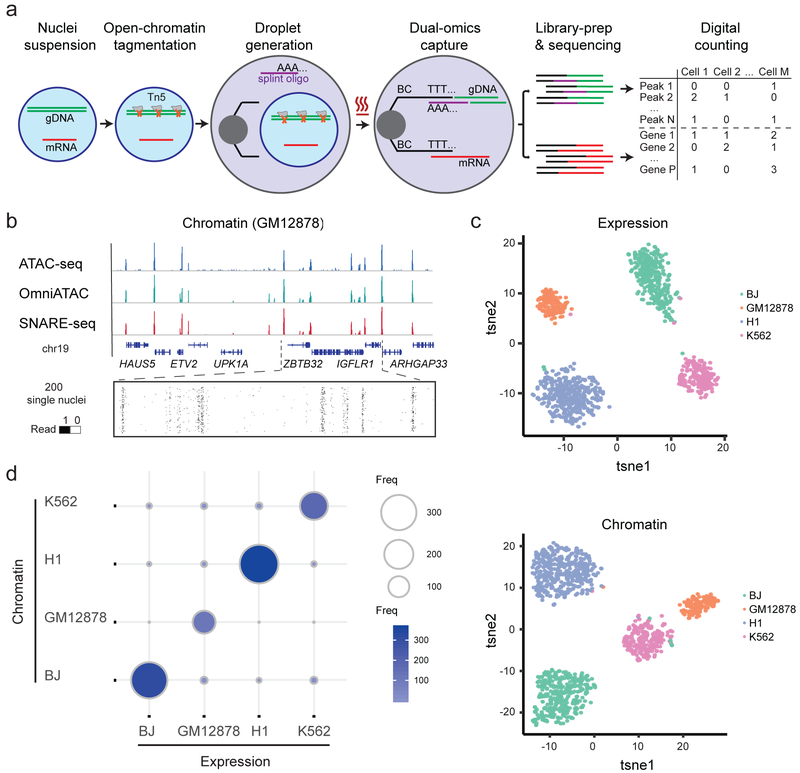
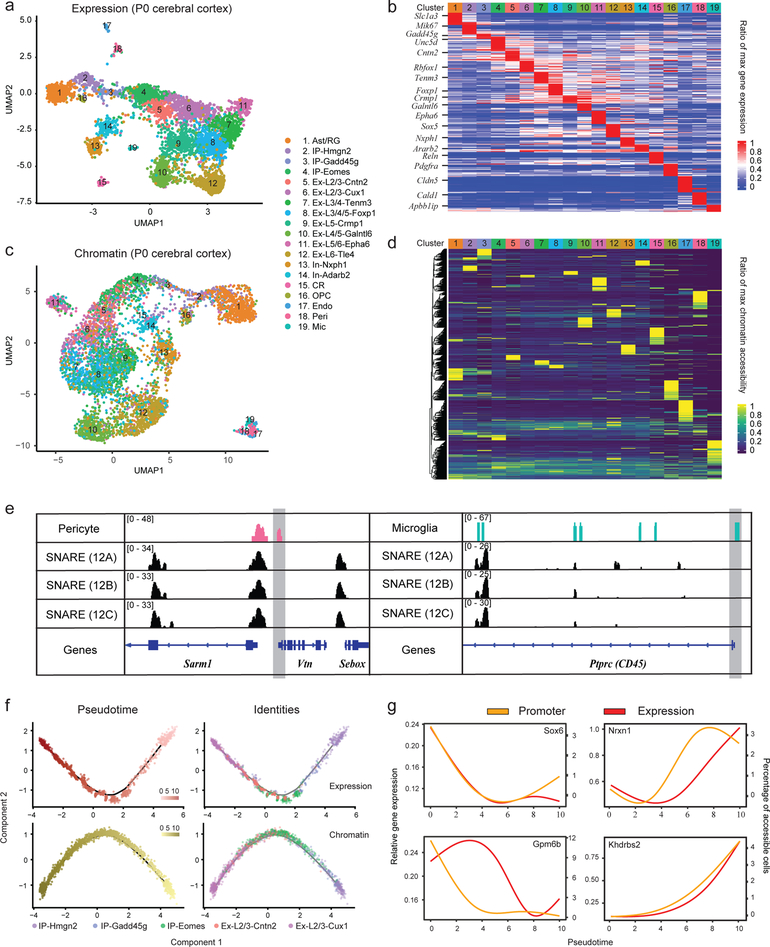
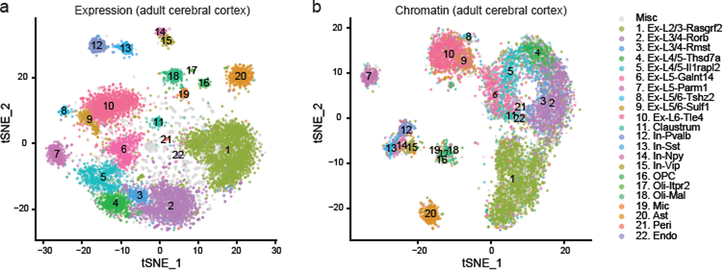
Single-cell RNA sequencing can reveal the transcriptional state of cells, yet provides little insight into the upstream regulatory landscape associated with open or accessible chromatin regions. Joint profiling of accessible chromatin and RNA within the same cells would permit direct matching of transcriptional regulation to its outputs. Here, we describe droplet-based single-nucleus chromatin accessibility and mRNA expression sequencing (SNARE-seq), a method that can link a cell's transcriptome with its accessible chromatin for sequencing at scale. Specifically, accessible sites are captured by Tn5 transposase in permeabilized nuclei to permit, within many droplets in parallel, DNA barcode tagging together with the mRNA molecules from the same cells. To demonstrate the utility of SNARE-seq, we generated joint profiles of 5,081 and 10,309 cells from neonatal and adult mouse cerebral cortices, respectively. We reconstructed the transcriptome and epigenetic landscapes of major and rare cell types, uncovered lineage-specific accessible sites, especially for low-abundance cells, and connected the dynamics of promoter accessibility with transcription level during neurogenesis.


Conflict of interest statement

Competing financial interests: The authors declare no competing financial interests.

Figures

Figure 1.
Figure 1.
Linked single-nucleus transcriptome and chromatin accessibility sequencing of human cell mixtures. a, Workflow of SNARE-seq. Key steps are outlined in the main text. b, Aggregate single-nucleus chromatin accessibility profiles recaptured published profiles of ATAC-seq and Omni-ATAC in GM12878 cells. c, t-SNE visualization of SNARE-seq paired gene expression (upper panel) and chromatin accessibility (lower panel, n=1,047) data from BJ, GM12878, H1 and K562 cell mixture. Cellular identities are colored based on independent clustering results with either expression or chromatin data. d, Inter-assay identity agreement reveals consistent linked transcriptome and chromatin accessibility profiles of SNARE-seq data. The size and color depth of each circle represents the number of cellular barcodes that were identified by the different assays.
Figure 2.
Figure 2.
Dual-omics profiling of neonatal mouse cerebral cortex with SNARE-seq (n=5 replicates). a, UMAP projection of 5,081 SNARE-seq expression data of mouse cerebral cortex nuclei. Cell types were assigned based on known markers. b, Heatmap showing the normalized expression of cell type-specific genes relative to the maximum expression level across all cell types. c, UMAP projection of SNARE-seq chromatin accessibility data of mouse cerebral cortex nuclei. Cells are labeled with the same color codes for cell types identified by the linked expression data. d, Heatmap showing the normalized chromatin accessibility of type-specific accessible sites relative to the maximum accessibility across all cell types. e, Chromatin accessibility tracks generated from cell-type specific or batch aggregated (batch code 12A, 12B and 12C) chromatin accessibility data at pericyte (left) and microglia (right) marker gene loci (Vtn and CD45 respectively). For better visualization, the promoter regions were shaded in gray. f, Pseudotime trajectories constructed with SNARE-seq expression (upper panels) and chromatin accessibility (lower panels) profiles for 1,469 nuclei (214 IP-Hmgn2, 99 IP-Gadd45g, 437 IP-Eomes, 177 Ex-L2/3-Cntn2 and 542 Ex-L2/3-Cux1) from the mouse cerebral cortex. Cells are colored according to pseudotime score (left panels) or cellular identities (right panels). g, Promoter accessibility (yellow) and gene expression (red) changes of Sox6, Gpm6b, Nrxn1 and Khdrbs2 across pseudotime during early neurogenesis. Misc, cells of miscellaneous clusters.
Figure 3.
Figure 3.
SNARE-seq profiling of adult mouse cerebral cortex. a, tSNE projection of SNARE-seq expression data of mouse cerebral cortex 10,309 nuclei (n=12 replicates). Cell types were assigned based on known markers. b, tSNE projection of SNARE-seq chromatin accessibility data of adult mouse cerebral cortex nuclei. Cells were labeled with the same color codes for cell types identified by the linked expression data.

References

    1. Lake BB. et al. Nat Biotechnol 36, 70–80 (2018). - PMC - PubMed
    1. Duren Z. et al. Proc Natl Acad Sci U S A 115, 7723–7728 (2018). - PMC - PubMed
    1. Macosko EZ. et al. Cell 161, 1202–1214 (2015). - PMC - PubMed
    1. Amini S. et al. Nat Genet 46, 1343–9 (2014). - PMC - PubMed
    1. Cao J. et al. Science 361, 1380–1385 (2018). - PMC - PubMed

Publication types