. 2019 Nov;22(11):1892-1902.
doi: 10.1038/s41593-019-0497-x. Epub 2019 Oct 14.

Profiling the mouse brain endothelial transcriptome in health and disease models reveals a core blood-brain barrier dysfunction module

Affiliations

Profiling the mouse brain endothelial transcriptome in health and disease models reveals a core blood-brain barrier dysfunction module

Roeben Nocon Munji et al. Nat Neurosci. 2019 Nov.

Abstract

Blood vessels in the CNS form a specialized and critical structure, the blood-brain barrier (BBB). We present a resource to understand the molecular mechanisms that regulate BBB function in health and dysfunction during disease. Using endothelial cell enrichment and RNA sequencing, we analyzed the gene expression of endothelial cells in mice, comparing brain endothelial cells with peripheral endothelial cells. We also assessed the regulation of CNS endothelial gene expression in models of stroke, multiple sclerosis, traumatic brain injury and seizure, each having profound BBB disruption. We found that although each is caused by a distinct trigger, they exhibit strikingly similar endothelial gene expression changes during BBB disruption, comprising a core BBB dysfunction module that shifts the CNS endothelial cells into a peripheral endothelial cell-like state. The identification of a common pathway for BBB dysfunction suggests that targeting therapeutic agents to limit it may be effective across multiple neurological disorders.


Conflict of interest statement

Competing Interests

The authors declare no competing interests.

Figures
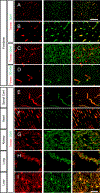
Figure 1:
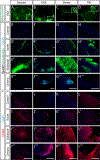
Figure 1:. Endothelial reporter mouse
Tissue sections from adult Rosa-tdTomato; VE-CadherinCreERT2 mice were stained and imaged one week following a three day course of tamoxifen injections. Tissue sections from the forebrain (A-D), spinal cord (E), heart (F), kidney (G), lung (H) and liver (I) were stained with antibodies against CD31 (green; A, B, E-I), CD45 (green, C) or CD140b (green, D). The tdTomato reporter (red, A-I) co-localized with CD31 in all tissues but not immune cells (CD45) or pericytes (CD140b). Scale bars represent 200 microns (A) and 50 microns (B-I). n=4 mice.
Figure 2:
Figure 2:. Blood-brain barrier leakage and inflammation following different disease models
Rosa-tdTomato; VE-CadherinCreERT2 mice undergoing a kainic acid seizure model (A, E, I,), an EAE model of MS (B, F, J), an MCAO model of stroke (C, G, K) or a pediatric TBI model (D, H, L), were analyzed at three timepoints (acute’, subacute ‘‘, chronic’’’) for BBB leakage using a biotin tracer (green, A-H) or inflammation by staining with an antibody against CD45 (red, I-L). A-D depict low magnification images of coronal sections of the brain (A,C-D) and spinal cord (B) of biotin leakage (green) for the subacute timepoint for each disease. In images A-D the region of interest (ROI) for the disease is outlined with a white box. Subsequent images are given at higher magnification of tissue corresponding to the ROIs for controls and acute, subacute, and chronic timepoints for each disease for biotin leakage (E-H) and CD45 staining (I-L). The most BBB leakage is observed at the subacute timepoint in each disease. Scale bars represent 500 microns. n=number of mice (Control/Acute/Subacute/Chronic): Seizure: 5/3/4/4 , EAE: 4/4/5/5, Stroke: 9/3/3/3 , TBI: 8/3/3/3.
Figure 3:
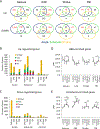
Figure 3:. Cerebrovascular transcriptional changes following disease
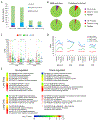
A) Venn diagrams of the number of up-regulated (top row) and down-regulated (bottom row) gene changes in the CNS endothelial cells observed in the seizure, EAE, stroke and pediatric TBI models depicting the overlap of changes found at each of the timepoints. For each timepoint genes were selected as up-regulated if they were increased log2fold change >1.00, had an expression of >5cpm in the disease condition, with a P-value<0.05, and downregulated if they were changed log2fold change<−0.800, had an expression of >5cpm in the control, with a P-value<0.05. The timepoint with the most changes and the two timepoints with most overlap are highlighted in red. Statistical test: Wald test. n=3 mice each condition as source of enriched endothelial cells with exception of n=2 mice for TBI control subacute and chronic conditions. B-C) Bar graphs depicting the number of gene changes at each timepoint for seizure, EAE, stroke and pediatric TBI models with color coding indicating the number of common changes between diseases. B) Up-regulated genes. C) Down-regulated genes. The most overlap between diseases is observed at the subacute timepoint, specifically for up-regulated genes. D-E) The average counts per million (CPM) of all the BBB-enriched genes (D, list of genes can be found in Supplementary File 3) and peripheral endothelial-enriched genes (E, list of genes can be found in Supplementary File 5) in the CNS endothelial cells at each timepoint in the seizure, EAE, stroke and pediatric TBI models. On average there is a decrease in the expression of BBB-enriched genes and an increase in the expression of peripheral-enriched genes following each of the different disease models. Data is presented as mean ±SEM. Statistical test: Mann-Whitney t test (unpaired, nonparametric, two-tailed): *P<0.05, **P<0.01, ***P<0.001 and ****P<0.0001; asterisks above error bars represent comparison with control sample; horizontal lines and corresponding asterisks compare samples aligned with each end of the horizontal line. n=518 BBB enriched genes, 1399 peripheral enriched genes.
Figure 4:
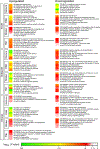
Figure 4:. Pathways altered in the CNS endothelial cells following neurological disease
David Bioinformatics was utilized to identify the most significantly up-regulated and down-regulated GOTERMs and KEGG pathways based on the transcriptional changes in CNS endothelial cells at each timepoint for the seizure, EAE, stroke and pediatric TBI disease models. For each timepoint genes were selected as up-regulated if they were increased log2fold change >1.00, had an expression of >5cpm in the disease condition, with a P-value<0.05, and downregulated if they were changed log2fold change<−0.800, had an expression of >5cpm in the control, with a P-value<0.05. The heatmap scale represents the log10 of the P-value that the specified pathway is changed in the given timepoint for each disease. The top three of each GO term and KEGG pathways are presented for each disease at each timepoint. Statistical test: EASE Score (one-tail). n=number of genes (Seizure/EAE/Stroke/TBI): Up-regulated in Acute: 519/360/37/259, Subacute: 458/817/213/183, Chronic: 79/644/23/5; Down-regulated in Acute: 2,528/203/182/195, Subacute: 466/617/258/58, Chronic: 108/364/113/0.
Figure 5:
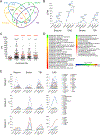
Figure 5:. Identification of the BBB-dysfunction module
A) Venn diagram of the genes identified as being up-regulated in at least one of the four disease models at the subacute timepoint depicting the overlap between the diseases. Genes were considered up-regulated if they were increased log2>1.00, had an expression of >5cpm in the disease sample at the subacute timepoint, with a P-value<0.05. The red text indicates the 136 genes up-regulated in at least three of the different disease models, that we have termed the BBB-dysfunction module (list given in Supplementary File 6). Statistical test: Wald test. n=3 mice each condition as source of enriched endothelial cells with exception of n=2 mice for TBI control subacute and chronic conditions. B) Average expression of the 136 BBB-dysfunction model genes given in counts per million (CPM), at each timepoint following the four different disease models. The BBB dysfunction module peaks at the subacute timepoint in the seizure, EAE and stroke models, and at the acute timepoint in the pediatric TBI model. Data is presented as mean ±SEM. Statistical test: Mann-Whitney t test (unpaired, nonparametric, two-tailed): *P<0.05, **P<0.01 and ****P<0.0001; asterisks above error bars represent comparison with control sample; horizontal lines and corresponding asterisks compare samples aligned with each end of the horizontal line. n=136 genes in each condition. C) Average expression of the 136 BBB-dysfunction module genes in endothelial cells enriched from the brain, heart, kidney, lung and liver during health. On average, during health the BBB dysfunction module genes are greatly enriched in the peripheral endothelial cells compared to the brain endothelial cells. Data is presented as mean ±SEM. Statistical test: Friedman test (matched data, nonparametric, result: P<0.0001) with post hoc Dunn’s multiple comparison (against brain sample) presented in the graph: **** P<0.0001. n=136 genes in each organ. D) DAVID Bioinformatics was used to identify GOTERMs and KEGG pathways that are enriched in the BBB dysfunction module. Statistical test: EASE Score (one-tail). The scale is the log10 of the EASE P-values. n=136 genes. E) Average expression of the 54 BBB-dysfunction module genes up-regulated given in counts per million (CPM) in all four diseases broken down into three different groups. Group 1 reached peak up-regulation in the acute phase of many of the diseases, Group 2 reached peak expression at the subacute phase in most of the disease models, and Group 3 consisted of genes that peaked at early acute/subacute timepoints in seizure, stroke and pediatric TBI models, but continued to increase in the EAE model.
Figure 6:
Figure 6:. Endothelial transcriptional regulation by activated beta-catenin
A) Total number of gene changes, as identified with P-value<0.05 with a value of >10cpm in the activated beta-catenin sample in up-regulated or control sample in down-regulated, in purified liver and lung endothelial cells from control and mice expressing activated beta-catenin in endothelial cells. Genes are listed in Supplementary File 7. Genes were stratified based on whether they were identified as BBB-enriched (violet, Supplementary File 3), peripheral enriched (blue, Supplementary File 5) or neither (green). Statistical test: Wald test. n=4 mice each condition as source of enriched endothelial cells. B) BBB-enriched (Supplementary File 3) and peripheral-enriched (Supplementary File 5) endothelial genes were subdivided based on whether they were up- or down-regulated in liver or lung endothelial cells (Supplementary File 7) due to activated beta-catenin signaling. Statistical test: Wald test. n=518 BBB enriched genes, 1399 peripheral enriched genes. C) Average expression levels given in counts per million (CPM) in healthy brain (red), lung (green) or liver (blue) (CPM source, Supplementary File 3) for all genes that were up- or down-regulated in liver or lung endothelial cells to activated beta-catenin signaling (identified in Supplementary File 7). Data is presented as mean ±SEM. Statistical test: Mann-Whitney t test (unpaired, nonparametric, two-tailed): **P<0.01 and ****P<0.0001 represent comparison to brain sample. n=number of genes: Up in Liver: 457, Down in Liver: 425, Up in Lung: 140, Down in Lung: 117. D) Average expression levels given in counts per million (CPM) in the four disease models (CPM source, Supplementary File 1) for all genes that were up- or down-regulated in liver or lung endothelial cells due to activated beta-catenin signaling (identified in Supplementary File 7). E) GOTERMs and KEGG pathways as identified by DAVID Bioinformatics that are regulated by activated beta-catenin in the liver and lung endothelial cells (Supplementary File 7). Statistical test: EASE Score (one-tail). The scale is the log10 of the EASE P-values. n=number of genes: Up in Liver: 457, Down in Liver: 425, Up in Lung: 140, Down in Lung: 117.

References

    1. Daneman R. The blood-brain barrier in health and disease. Ann Neurol 72, 648–672 (2012). - PubMed
    1. Zlokovic BV. The blood-brain barrier in health and chronic neurodegenerative disorders. Neuron 57, 178–201 (2008). - PubMed
    1. Rubin LL & Staddon JM. The cell biology of the blood-brain barrier. Annu Rev Neurosci 22, 11–28 (1999). - PubMed
    1. Janzer RC & Raff MC. Astrocytes induce blood-brain barrier properties in endothelial cells. Nature 325, 253–257 (1987). - PubMed
    1. Stewart PA & Wiley MJ. Developing nervous tissue induces formation of blood-brain barrier characteristics in invading endothelial cells: a study using quail--chick transplantation chimeras. Dev Biol 84, 183–192 (1981). - PubMed

Publication types

MeSH terms