. 2019 Sep;475(2229):20190212.
doi: 10.1098/rspa.2019.0212. Epub 2019 Sep 25.

Unmanned aerial vehicles reveal the impact of a total solar eclipse on the atmospheric surface layer

Affiliations

Unmanned aerial vehicles reveal the impact of a total solar eclipse on the atmospheric surface layer

Sean C C Bailey et al. Proc Math Phys Eng Sci. 2019 Sep.

Abstract

We use unmanned aerial vehicles to interrogate the surface layer processes during a solar eclipse and gain a comprehensive look at the changes made to the atmospheric surface layer as a result of the rapid change of insolation. Measurements of the atmospheric surface layer structure made by the unmanned systems are connected to surface measurements to provide a holistic view of the impact of the eclipse on the near-surface behaviour, large-scale turbulent structures and small-scale turbulent dynamics. Different regimes of atmospheric surface layer behaviour were identified, with the most significant impact including the formation of a stable layer just after totality and evidence of Kelvin-Helmholtz waves appearing at the interface between this layer and the residual layer forming above it. The decrease in surface heating caused a commensurate decrease in buoyant turbulent production, which resulted in a rapid decay of the turbulence in the atmospheric surface layer both within the stable layer and in the mixed layer forming above it. Significant changes in the wind direction were imposed by the decrease in insolation, with evidence supporting the formation of a nocturnal jet, as well as backing of the wind vector within the stable layer.

Keywords: atmospheric surface layer; eclipse; measurements; turbulence; unmanned aerial vehicles.


Conflict of interest statement

We declare we have no competing interests.

Figures

Figure 1.
Figure 1.
Satellite imagery of the region upwind of the measurement location, showing the location of the different instruments used in the experiment. (Online version in colour.)
Figure 2.
Figure 2.
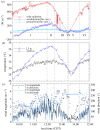
Meteorological conditions measured near the surface. (a) Solar radiation measured from 9.30 CDT to 15.00 CDT compared with estimated sensible and ground heat flux inferred for the same time period using measured temperature gradients. (b) Air temperature measured at 2.5 m and soil temperature measured at −0.02 m below the surface. (c) Wind speed measured at 7 m via a sonic anemometer and at 3.0 m via a cup and vane anemometer. Vectors at the top of the figure indicate the corresponding wind direction, with up being to the North. Vertical dashed lines indicate the boundaries between regimes with regimes identified by Roman numerals in (a). (Online version in colour.)
Figure 3.
Figure 3.
Time evolution of large-scale features of the atmospheric surface layer measured between 10 m and 100 m for regimes I and II. (a) Time–height plot of the potential temperature measured by the profiling UAV interpolated from ascending and descending rotorcraft. Gaps between isocontours indicate the times between flights. (b) Corresponding profiles of potential temperature, θ, from the same data shown in (a). Grey lines indicate the potential temperature measured during ascents and descents of the aircraft with the red line indicating the mean value at each altitude. (c) Profiles of the horizontal component of the wind speed measured from each flight. The coordinate system has been aligned with the average velocity vector calculated from measurements between 50 m and 100 m for each profile. Grey lines indicate the velocity component measured during the ascents and descents with the red line indicating the average value for each flight measured at each 1 m interval height. Vertical lines in (a) indicate the boundaries between regimes, with regimes identified by Roman numerals. (Online version in colour.)
Figure 4.
Figure 4.
Time evolution of large-scale features of the atmospheric surface layer measured between 10 m and 100 m for regimes III–VI. (a) Time–height plot of the potential temperature measured by the profiling UAV interpolated from ascending and descending rotorcraft. Gaps between isocontours indicate the times between flights. (b) Corresponding profiles of the potential temperature, θ, from the same data shown in (a). Grey lines indicate the potential temperature measured during ascents and descents of the aircraft with the red line indicating the mean value at each altitude. (c) Profiles of the horizontal component of the wind speed measured from each flight. The coordinate system has been aligned with the average velocity vector calculated from the measurements between 50 m and 100 m for each profile. Grey lines indicate the velocity component measured during the ascents and descents with the red line indicating the average value for each flight measured at each 1 m interval height. Vertical lines in (a) indicate the boundaries between the regimes, with regimes identified by Roman numerals. (Online version in colour.)
Figure 5.
Figure 5.
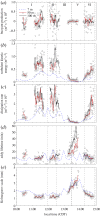
Time evolution of turbulence statistics measured at 7 m, 50 m and 100 m. (a) Buoyant production, B, calculated from fixed-wing aircraft flying at 50 m and 100 m. (b) Corresponding turbulent kinetic energy, k, compared with the estimated turbulent kinetic energy, k~, measured by the sonic anemometer located at 7 m. (c) Turbulence dissipation rate, ε, estimated from the inertial subrange of the energy spectrum. (d) Eddy lifetime, defined as the ratio of the turbulent kinetic energy to the turbulence dissipation rate. (e) Kolmogorov scale, η, estimated from the turbulence dissipation rate and kinematic viscosity, describing the smallest scales of turbulence. Gray data points indicate statistics gathered from a single pass, with lines produced via a rolling average of five passes. Upward-pointing triangles indicate a measurement made at 100 m and downward-pointing triangles indicate a measurement made at 50 m, with lines indicating the rolling average calculated from five successive passes. Data presented for the sonic anemometer at 7 m are calculated from 10 min averages with Taylor's hypothesis [70] used to estimate spatial information using the temporal variation. Vertical dashed lines indicate the boundaries between regimes with regimes identified by Roman numerals in (a). (Online version in colour.)
Figure 6.
Figure 6.
Wind speed and direction plots measured between 3 m and 100 m. Wind speed in m s−1 and direction at Russellville–Logan County Airport measured at 3 m, 7 m, 50 m and 100 m during: (a) regime I; (b) regime II; (c) regimes III and IV; (d) regime V and (e) regime VI. Wind speed and direction for the same time period are presented in (f ) at 10 m measured at Logan County Mesonet site (latitude 36.86, longitude −86.91, approx. 8.5 km from Russellville Airport). Data points from 3 m and 7 m from the cup and vane and sonic anemometer are shown at 1 min intervals. Data points from 50 m and 100 m are presented from the fixed-wing UAVs as an average for each transect (approx. 40 s intervals). Data points from the Logan County Mesonet site in (f ) are presented at 5 min intervals. Direction is meteorological direction. In (ae), symbols indicate the altitude of measurement with: black circles indicating 3 m; blue squares indicating 7 m; red inverted triangles indicating 50 m; and green triangles indicating 100 m. In (f ), symbols indicate the time of measurement with: red circles indicating regime I; orange triangles indicating regime II; yellow right pointed triangles indicating regime III; green inverted triangles indicating regimes IV and V; blue left pointed triangles indicating regime VI; and purple squares indicating measurements made after 15.00 CDT. (Online version in colour.)
Figure 7.
Figure 7.
Wind direction measured at different altitudes. Wind direction measured at 3 m, 7 m, 50 m and 100 m at Russellville Airport and at 10 m at the Logan County Mesonet site during eclipse. Direction is meteorological direction. Values at 3 m and 7 m presented at 1 min intervals, Mesonet values presented at 5 min intervals, values at 50 m and 100 m presented as the average from each transect (approx. 40 s). Vertical dashed lines and Roman numerals indicate the regime; the red solid line indicates a 20° backing of the wind between regimes III and VI. (Online version in colour.)
Figure 8.
Figure 8.
Mean wind vectors at 1 m intervals measured by rotorcraft during regimes IV and V. Wind vectors measured during (a) flight 10 (13:25 CDT–13:35 CDT), (b) flight 11 (13:42 CDT–13:52 CDT) and (c) flight 12 (13:53 CDT–14:02 CDT). Vectors averaged over the duration of the flight at 1 m intervals and shown coloured by magnitude of the vector with a 1 m s−1 reference vector in the upper right. (Online version in colour.)

References

    1. Walker G. 2008. An ocean of air: a natural history of the atmosphere. London, UK: Bloomsbury.
    1. Foken T. 2008. Micrometeorology. Berlin, Germany: Springer.
    1. Brown GL, Roshko A. 1974. On density effects and large structure in turbulent mixing layers. J. Fluid Mech. 64, 775–816. (10.1017/S002211207400190X) - DOI
    1. Gao W, Shaw RH, Paw U KT. 1989. Observation of organized structure in turbulent flow within and above a forest canopy. Bound. Layer Meteorol. 59, 35–57. (10.1007/BF00120685) - DOI
    1. Kapoor RK, Adiga BB, Singal SP, Aggarwal SK, Gera BS. 1982. Studies of the atmospheric stability characteristics during the solar eclipse of February 16, 1980. Bound. Layer Meteorol. 24, 415–419. (10.1007/BF00120730) - DOI

LinkOut - more resources