. 2019 Sep 26:13:335.
doi: 10.3389/fnhum.2019.00335. eCollection 2019.

The Principle of Inverse Effectiveness in Audiovisual Speech Perception

Affiliations

The Principle of Inverse Effectiveness in Audiovisual Speech Perception

Luuk P H van de Rijt et al. Front Hum Neurosci. .

Abstract

We assessed how synchronous speech listening and lipreading affects speech recognition in acoustic noise. In simple audiovisual perceptual tasks, inverse effectiveness is often observed, which holds that the weaker the unimodal stimuli, or the poorer their signal-to-noise ratio, the stronger the audiovisual benefit. So far, however, inverse effectiveness has not been demonstrated for complex audiovisual speech stimuli. Here we assess whether this multisensory integration effect can also be observed for the recognizability of spoken words. To that end, we presented audiovisual sentences to 18 native-Dutch normal-hearing participants, who had to identify the spoken words from a finite list. Speech-recognition performance was determined for auditory-only, visual-only (lipreading), and auditory-visual conditions. To modulate acoustic task difficulty, we systematically varied the auditory signal-to-noise ratio. In line with a commonly observed multisensory enhancement on speech recognition, audiovisual words were more easily recognized than auditory-only words (recognition thresholds of -15 and -12 dB, respectively). We here show that the difficulty of recognizing a particular word, either acoustically or visually, determines the occurrence of inverse effectiveness in audiovisual word integration. Thus, words that are better heard or recognized through lipreading, benefit less from bimodal presentation. Audiovisual performance at the lowest acoustic signal-to-noise ratios (45%) fell below the visual recognition rates (60%), reflecting an actual deterioration of lipreading in the presence of excessive acoustic noise. This suggests that the brain may adopt a strategy in which attention has to be divided between listening and lipreading.

Keywords: hearing; lipreading; listening; multisensory; speech recognition in noise.


Figures

FIGURE 1
FIGURE 1
Example stimulus. (A) Temporal waveform of the auditory speech signal “Tom telde zes groene dozen” (translation: Tom counted six green boxes.) (B) Waveform of the auditory noise. (C) Spectrogram of the recorded sentence. (D) Five videos frames around the onset of the word. Dark blue lines denote the approximate onset of each individual word. Written informed consent for the publication of this image was obtained from the individual shown.
FIGURE 2
FIGURE 2
Lipreading. (A) Visual recognition scores. The correct score (number of correct responses divided by the number of presentations) is shown separately for every word and subject (900 entries) for the V-only condition. The correct scores and rates have been ordered by the recognition rates of subjects on the abscissa, and of words on the ordinate from low-left to high-right. (B) The average estimated visual recognition rates (Equation 1). Same layout as in (A). V-only speech recognition rates for (C) subjects and (D) words. Rates were ordered from low-left to high-right. Open circles indicate the mean of the estimated rate, colored patch indicates the 95% Highest Density Interval (HDI). Reddish colors denote visual conditions.
FIGURE 3
FIGURE 3
Speech listening. Auditory word-recognition scores. (A–E) The correct score (number of correct responses divided by the number of presentations) is shown separately for every word and subject (900 entries) for each of the SNRs of −21, −16, −13, −10, and −5 dB. The correct scores have been ordered by the average V-only rates of subjects on the abscissa, and A-only thresholds on the ordinate. (F–J) The average estimated auditory recognition rates. (K) Correct scores and psychometric fit for the word ‘Pieter’ as a function of SNR, averaged across all subjects. Open squares indicate the measured correct scores. Blue shading denotes credible fits (see Materials and Methods). Vertical bold gray line indicates the average of likely recognition thresholds. (L) A-only speech recognition thresholds, ordered from high-left to low-right. Note that a lower threshold indicates better performance. Open circles indicate means of the estimated thresholds, colored patch indicates the 95% HDI. Blueish colors denote auditory conditions.
FIGURE 4
FIGURE 4
Audiovisual speech recognition. (A–E) The audiovisual correct scores are shown separately for every word and subject (900 entries) for each of the SNRs of (A) −21, (B) −16, (C) −13, (D) −10, and (E) −5 dB. The correct scores have been ordered by the average AV recognition rates of subjects on the abscissa, and of words on the ordinate. (F–J) The average estimated audiovisual recognition rates. (K) Audiovisual correct scores and psychometric fit for the word ‘Pieter’ as a function of SNR, averaged across all subjects. Open squares indicate the measured correct scores. Green shading denotes credible fits (see Materials and Methods). Vertical bold gray line indicates the average of likely recognition thresholds. (L) AV speech-recognition thresholds, (M,N) AV recognition rates for words and subjects, ordered from low-left to high-right. Note that a lower threshold indicates better performance. Open circles indicate means of the estimated thresholds, colored patch indicates the 95% HDI. Greenish colors denote audio-visual conditions.
FIGURE 5
FIGURE 5
Comparison between audiovisual and unimodal conditions. Change in threshold and rates of AV speech recognition in comparison to unimodal listening conditions. (A) The change in threshold for each word (equation 4). Note that a negative change in threshold denotes better performance in AV conditions. (B) The change in recognition rate for each word (equation 5). (C) The change in recognition rate for each subject. For rates, a change larger than 0 denotes better AV performance. Open circles denote the mean of the parameter estimate, colored patches indicate 95% HDI.
FIGURE 6
FIGURE 6
Audiovisual speech recognition varies with unimodal information. Psychometric curves were determined (equation 1–3) from all data divided across 4 groups differing in unimodal performances: visual recognition rate (A,B) larger and (C,D) smaller than 0.55; and an auditory recognition rate (A,C) larger than and (B,D) smaller than 0.55. Curves indicate the average model estimate, circles denote the average correct score. N is the number of subject-word-SNR combinations for each group.
FIGURE 7
FIGURE 7
Audiovisual enhancement as a function of SNR. (A–D) The average audiovisual enhancement, expressed as proportion correct, as a function of SNR, compared to speech listening only (blue) and the proportion summation model (black). Curves (circles) indicate the enhancement calculated from the average model estimate (average correct score).
FIGURE 8
FIGURE 8
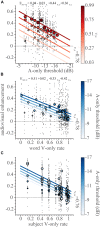
Inverse effectiveness. The audiovisual enhancement over unisensory responses (as defined in the text) as a function of the independent variables (A) auditory threshold, (B) visual word recognition rate, (C) visual subject recognition rate. Note that the x-axis is inverted in (A). Black dots indicate the enhancement in correct score for every subject-word-SNR combination. To visualize the effects of the three independent variables on the dependent variable, we binned the variables as follows. The two-dimensional bins were centered on rounded threshold values and for five visual word recognition rates (from the minimum to the maximum rates in equidistant steps) in (A), and on five auditory thresholds (from the minimum to the maximum thresholds in equidistant steps) and all visual word recognition rate values in (B) and visual subject recognition rates in (C). Circles denote binned average correct scores. Lines indicate the best-fit multiple regression lines for the independent variable of interest (on the abscissa), with intercepts determined by the second, binned variable (indicated by the color bar) and the mean of the third variable (indicated by text). Dot size (color) denotes the cross-sensory performance level (as indicated by the color bars).

References

    1. Alais D., Burr D. (2004). No direction-specific bimodal facilitation for audiovisual motion detection. Brain Res. Cogn. Brain Res. 19 185–194. 10.1016/j.cogbrainres.2003.11.011 - DOI - PubMed
    1. Alsius A., Navarra J., Campbell R., Soto-Faraco S. (2005). Audiovisual integration of speech falters under high attention demands. Curr. Biol. 15 839–843. 10.1016/j.cub.2005.03.046 - DOI - PubMed
    1. Anderson Gosselin P., Gagné J. (2011). Older adults expend more listening effort than young adults recognizing speech in noise. J. Speech Lang. Hear. Res. 54 944–958. 10.1044/1092-4388(2010/10-0069) - DOI - PubMed
    1. Bell A. H., Meredith M. A., van Opstal A. J., Munoz D. P. (2005). Crossmodal integration in the primate superior colliculus underlying the preparation and initiation of saccadic eye movements. J. Neurophysiol. 93 3659–3673. 10.1152/jn.01214.2004 - DOI - PubMed
    1. Bernstein L. E., Auer E. T., Takayanagi S. (2004). Auditory speech detection in noise enhanced by lipreading. Speech Commun. 44 5–18. 10.1016/j.specom.2004.10.011 - DOI