. 2019 Sep 27:10:2180.
doi: 10.3389/fmicb.2019.02180. eCollection 2019.

An Overview of Genes From Cyberlindnera americana, a Symbiont Yeast Isolated From the Gut of the Bark Beetle Dendroctonus rhizophagus (Curculionidae: Scolytinae), Involved in the Detoxification Process Using Genome and Transcriptome Data

Affiliations

An Overview of Genes From Cyberlindnera americana, a Symbiont Yeast Isolated From the Gut of the Bark Beetle Dendroctonus rhizophagus (Curculionidae: Scolytinae), Involved in the Detoxification Process Using Genome and Transcriptome Data

L Viridiana Soto-Robles et al. Front Microbiol. .

Abstract

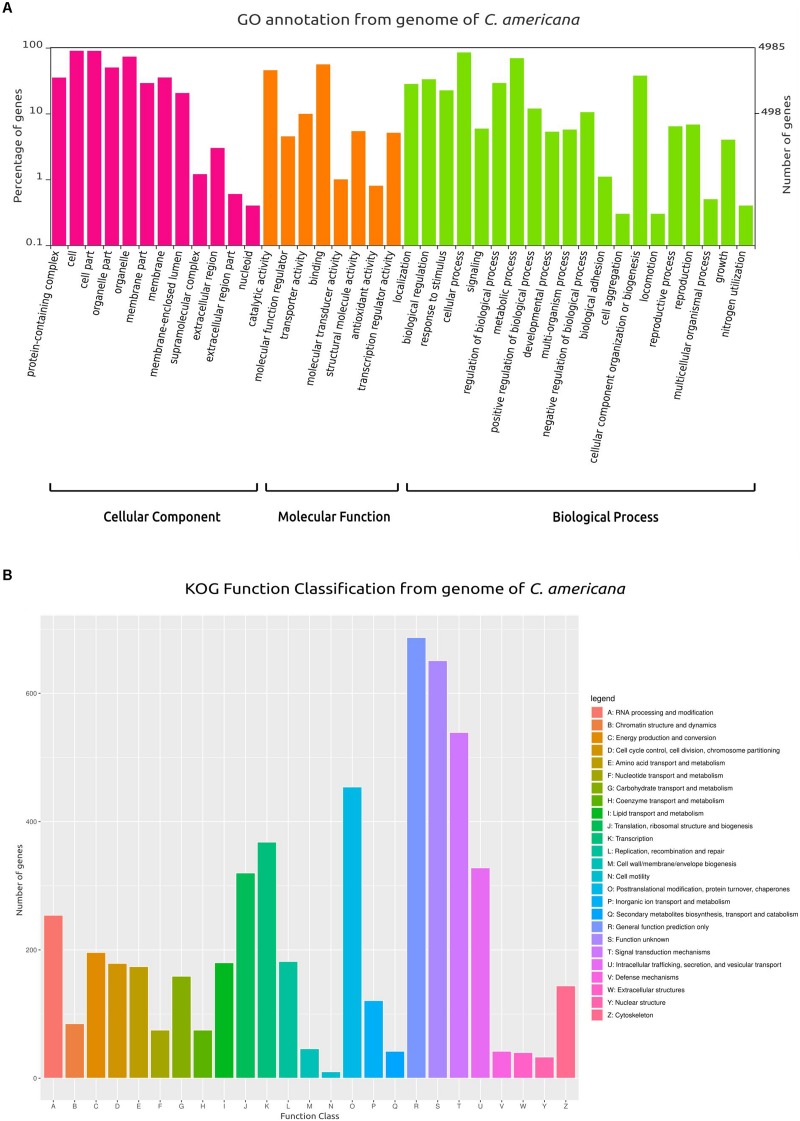
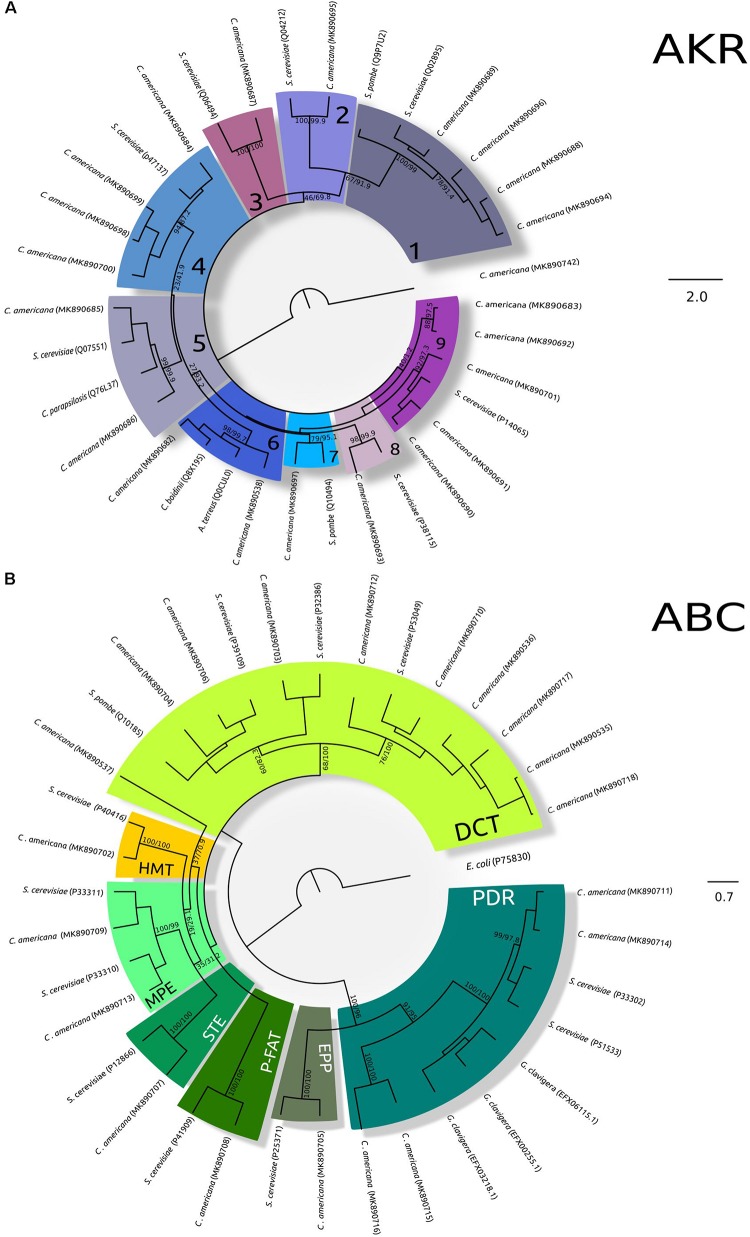
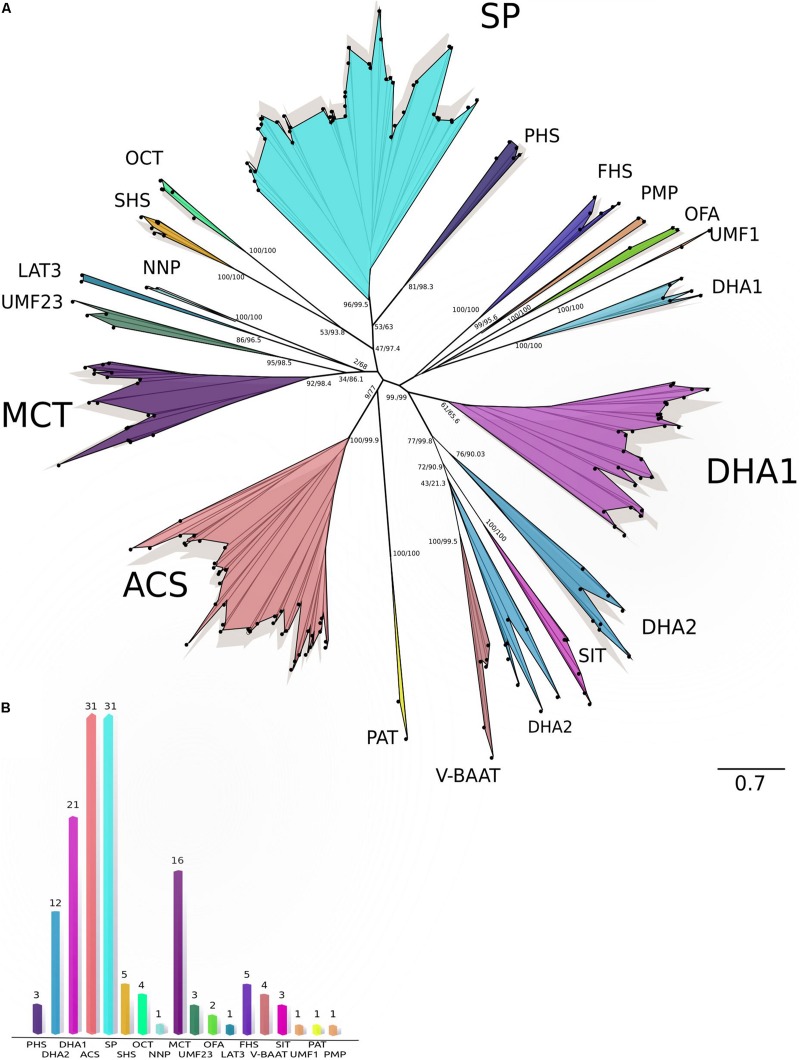
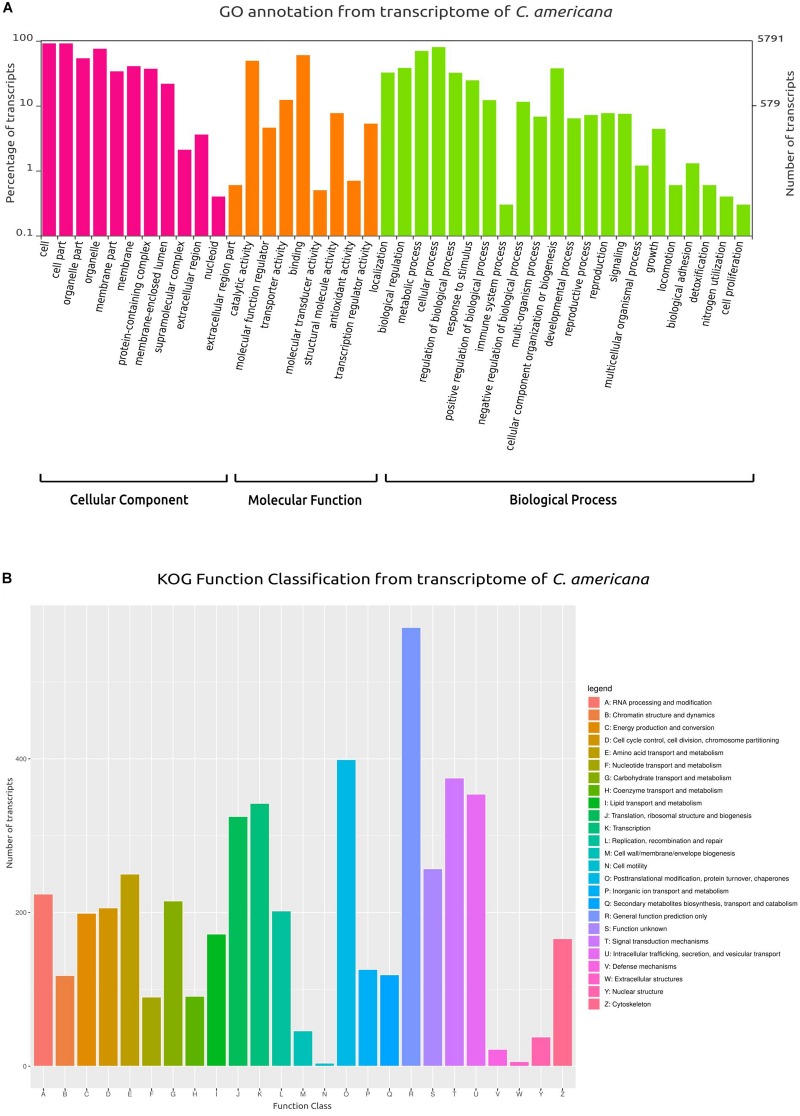
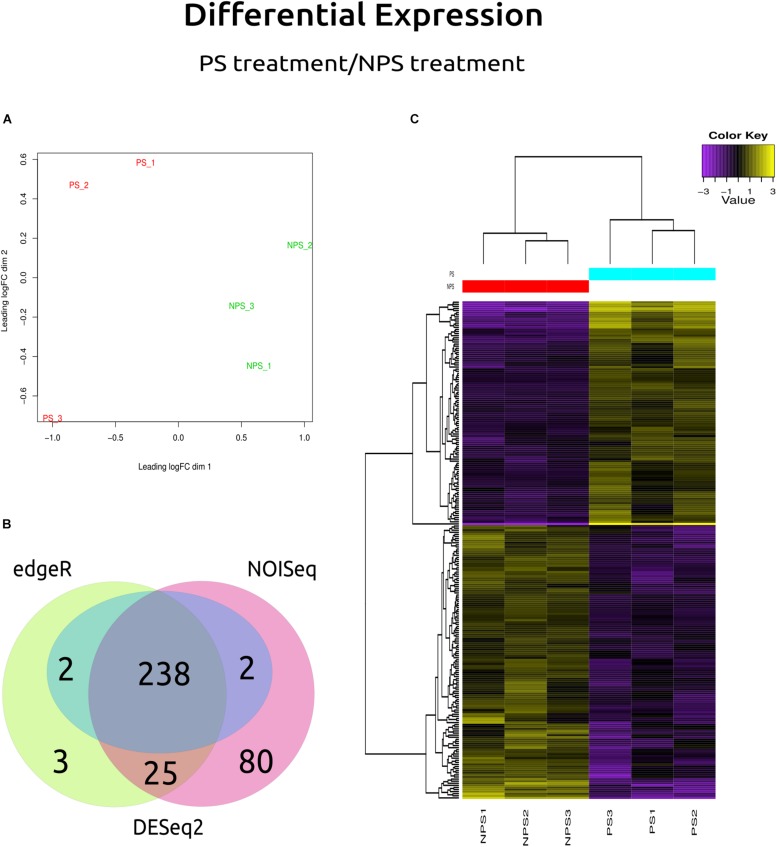
Bark beetles from Dendroctonus genus promote ecological succession and nutrient cycling in coniferous forests. However, they can trigger outbreaks leading to important economic losses in the forest industry. Conifers have evolved resistance mechanisms that can be toxic to insects but at the same time, bark beetles are capable of overcoming tree barriers and colonize these habitats. In this sense, symbiont yeasts present in the gut of bark beetles have been suggested to play a role in the detoxification process of tree defensive chemicals. In the present study, genes related to this process were identified and their response to a terpene highly toxic to bark beetles and their symbionts was analyzed in the Cyberlindnera americana yeast. The genome and transcriptome of C. americana (ChDrAdgY46) isolated from the gut of Dendroctonus rhizophagus were presented. Genome analysis identified 5752 protein-coding genes and diverse gene families associated with the detoxification process. The most abundant belonged to the Aldo-Keto Reductase Superfamily, ATP-binding cassette Superfamily, and the Major Facilitator Superfamily transporters. The transcriptome analysis of non-α-pinene stimulated and α-pinene stimulated yeasts showed a significant expression of genes belonging to these families. The activities demonstrated by the genes identified as Aryl-alcohol dehydrogenase and ABC transporter under (+)-α-pinene suggest that they are responsible, that C. americana is a dominant symbiont that resists high amounts of monoterpenes inside the gut of bark beetles.

Keywords: MDR transporters; bark beetles; detoxification; genome; symbiont yeast; transcriptome; α-pinene.


Figures

FIGURE 1
FIGURE 1
Gene Ontology (GO) and Clusters of Orthologous Groups (KOG) plots. (A) Classification and functional distribution of the inferred proteome from the genome of C. americana, according to the three major hierarchical Gene Ontology terms: Biological Process, Molecular Function, and Cellular Component. Obsolete terms and values ≤ 0.2% were not represented. (B) Distribution of KOG annotation of genes related to A–Z classes.
FIGURE 2
FIGURE 2
Maximum-likelihood trees of AKR and ABC transporters. (A) Phylogeny of AKR. The analysis was performed using the amino acid substitution model LG + G + F with a gamma parameter of 1.582, bootstrap/aLRT SH-like values shown at nodes. The alcohol dehydrogenase (non-member of the AKR Superfamily) (from C. americana was used as outgroup. 1, Aryl-alcohol dehydrogenase; 2, D-arabinose 1-dehydrogenase; 3, Pyridoxal reductase; 4, Oxidoreductase; 5, NAD(P)H-dependent reductase; 6, NAD(P)H-dependent D-xylose reductase; 7, Aldehyde reductase I; 8, D-arabinose dehydrogenase (NAD(P)+) heavy chain; 9, Glycerol 2-dehydrogenase (NAD(P)+). Accession numbers of TCDB/GenBank sequences are shown in brackets. (B) Phylogeny of ABC transporters. The analysis was performed using the amino acid substitution model VT + G + I + F with a gamma parameter of 2.312 and a proportion of invariable sites of 0.005, bootsrap/aLRT SH-like values shown at nodes. The ABC III from E. coli (P75830) was used as outgroup. DCT, drug conjugate transporter; P-FAT, peroxisomal fatty acyl CoA transporter; HMT, heavy metal transporter; MPE, mitochondrial peptide exporter; STE, a-factor sex pheromone exporter; PDR, pleiotropic drug resistance; EPP, eye pigment precursor transporter. Accession numbers of TCDB/GenBank sequences are shown in brackets.)
FIGURE 3
FIGURE 3
Maximum-likelihood tree and Classification of MFS transporters. (A) Phylogeny of MFS sequences. The maximum-likelihood tree of MFS based on amino acid sequences from C. americana plus TCDB sequences. The analysis was performed using the amino acid substitution model VT + G + F with a gamma (parameter of 3.876. Bootstrap/aLRT SH-like values are shown at nodes. (B) Classification of MFS families. The graph shows 145 putative MFS classified into 18 different MFS families. ACS, anion:cation symporter family; DHA1 and DHA2, drug:H+ antiporter 1–2 families; FHS, fucose:H+ symporter family; LAT3, L-amino acid transporter-3 family; MCT, monocarboxylate transporter family; NNP, nitrate/nitrite porter family; OCT, organic cation transporter family; OFA, oxalate:formate antiporter family; PAT, peptide-acetyl-coenzyme a transporter family; PHS, phosphate:H+ symporter family; PMP, putative magnetosome permease family; SHS, sialate:H+ symporter family; SIT, siderophore-iron transporter family; SP, sugar porter family; UMF1, unidentified major facilitator-1 family; UMF23, unidentified major facilitator-23 family; V-BAAT, vacuolar basic amino acid transporter family.)
FIGURE 4
FIGURE 4
Gene Ontology (GO) and Clusters of Orthologous Groups (KOG) plots. (A) Classification and functional distribution of the inferred proteome from the transcriptome of C. americana, according to the three major hierarchical Gene Ontology terms: Biological Process, Molecular Function, and Cellular Component. Obsolete terms and values ≤ 0.2% were not represented. (B) Distribution of KOG annotation of transcripts related to A–Z classes.
FIGURE 5
FIGURE 5
Differential gene expression results. (A) MDS plot: Multidimensional Scaling plot shows variation among RNA-Seq samples, distance between sample labels indicates dissimilarity. (B) The Venn diagram shows the genes that were reported by each method in a particular way (DESeq2, NOISeq, EdgeR, or DESeq), and which were reported by all (those shown at the center). (C) Heatmap: yellow color denotes a high level of expression, while purple indicates low expression, NPS1, NPS2, and NPS3 denote the biological replicates for samples without (+)-α-pinene, while PS1, PS2, and PS3 denote the three biological replicates with (+)-α-pinene.
FIGURE 6
FIGURE 6
Genomic localization of the upregulated Aryl-alcohol dehydrogenase CaAAD1 gene. CaAAD1 gene forms a cluster together with a transcriptional regulatory protein, two MFS transporters, a Carboxylesterase, and a Glutathione S-transferase.

References

    1. Adams A. S., Aylward F. O., Adams S. M., Erbilgin N., Aukema B. H., Currie C. R., et al. (2013). Mountain pine beetles colonizing historical and naive host trees are associated with a bacterial community highly enriched in genes contributing to terpene metabolism. Appl. Environ. Microb. 79 3468–3475. 10.1128/AEM.00068-13 - DOI - PMC - PubMed
    1. Adams A. S., Currie C. R., Cardoza Y., Klepzig K. D., Raffa K. F. (2009). Effects of symbiotic bacteria and tree chemistry on the growth and reproduction of bark beetle fungal symbionts. Can. J. For. Res. 39 1133–1147. 10.1139/X09-034 - DOI
    1. Almario M. P., Reyes L. H., Kao K. C. (2013). Evolutionary engineering of Saccharomyces cerevisiae for enhanced tolerance to hydrolysates of lignocellulosic biomass. Biotechnol. Bioeng. 110 2616–2623. 10.1002/bit.24938 - DOI - PubMed
    1. Andrews R. E., Parks L. W., Spence K. D. (1980). Some effects of Douglas fir terpenes on certain microorganisms. Appl. Environ. Microbiol. 40 301–304. - PMC - PubMed
    1. Armenteros J. J., Tsirigos K. D., Sønderby C. K., Petersen T. N., Winther O., Brunak S., et al. (2019). SignalP 5.0 improves signal peptide predictions using deep neural networks. Nat. Biotechnol. 37 420–423. 10.1038/s41587-019-0036-z - DOI - PubMed

LinkOut - more resources