Review
. 2019 Oct;11(5):765-782.
doi: 10.1007/s12551-019-00599-y. Epub 2019 Oct 14.

Probing force in living cells with optical tweezers: from single-molecule mechanics to cell mechanotransduction

Affiliations
Review

Probing force in living cells with optical tweezers: from single-molecule mechanics to cell mechanotransduction

Claudia Arbore et al. Biophys Rev. 2019 Oct.

Abstract

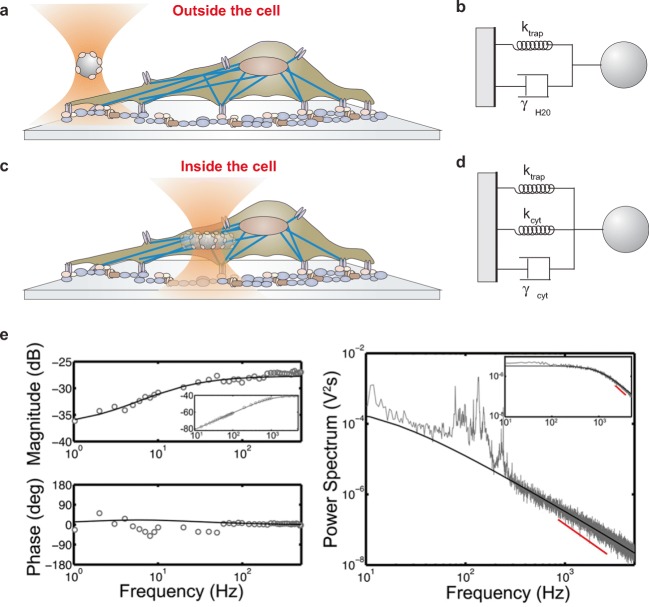
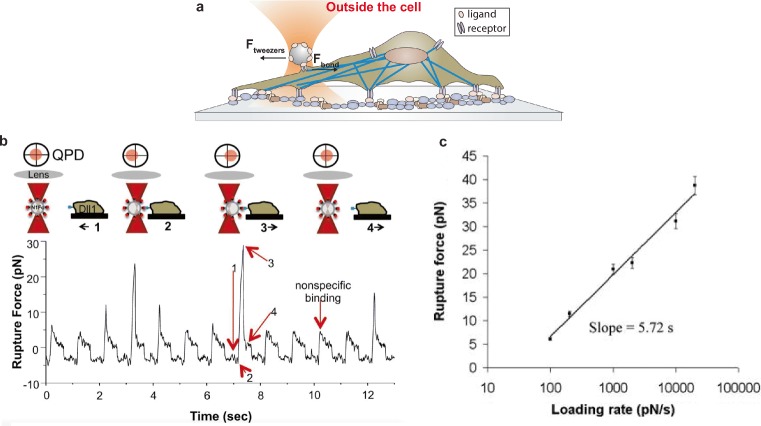
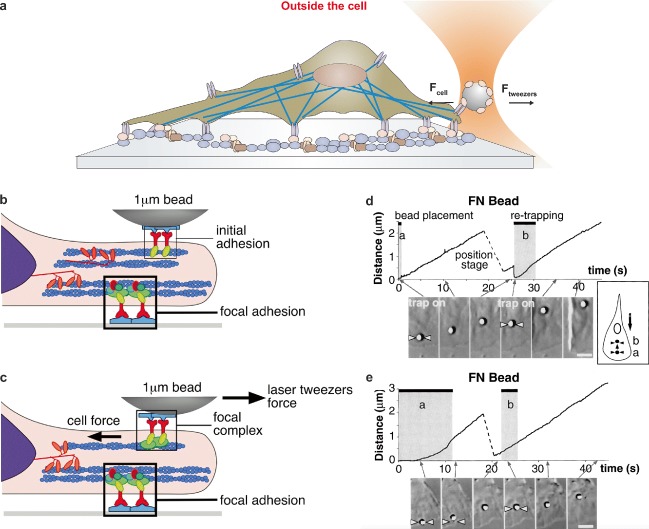
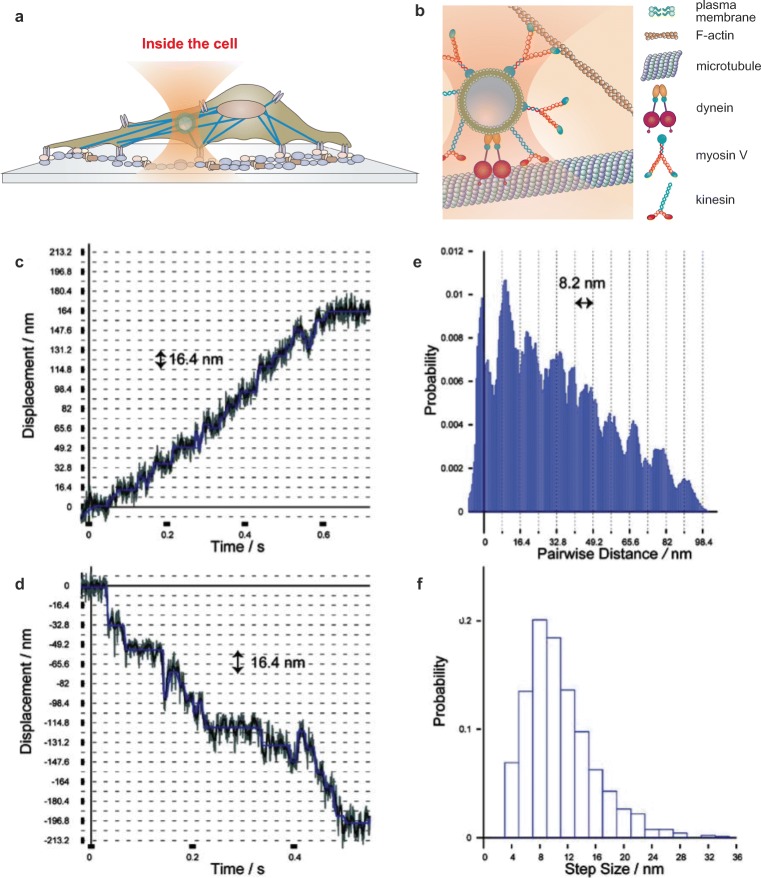
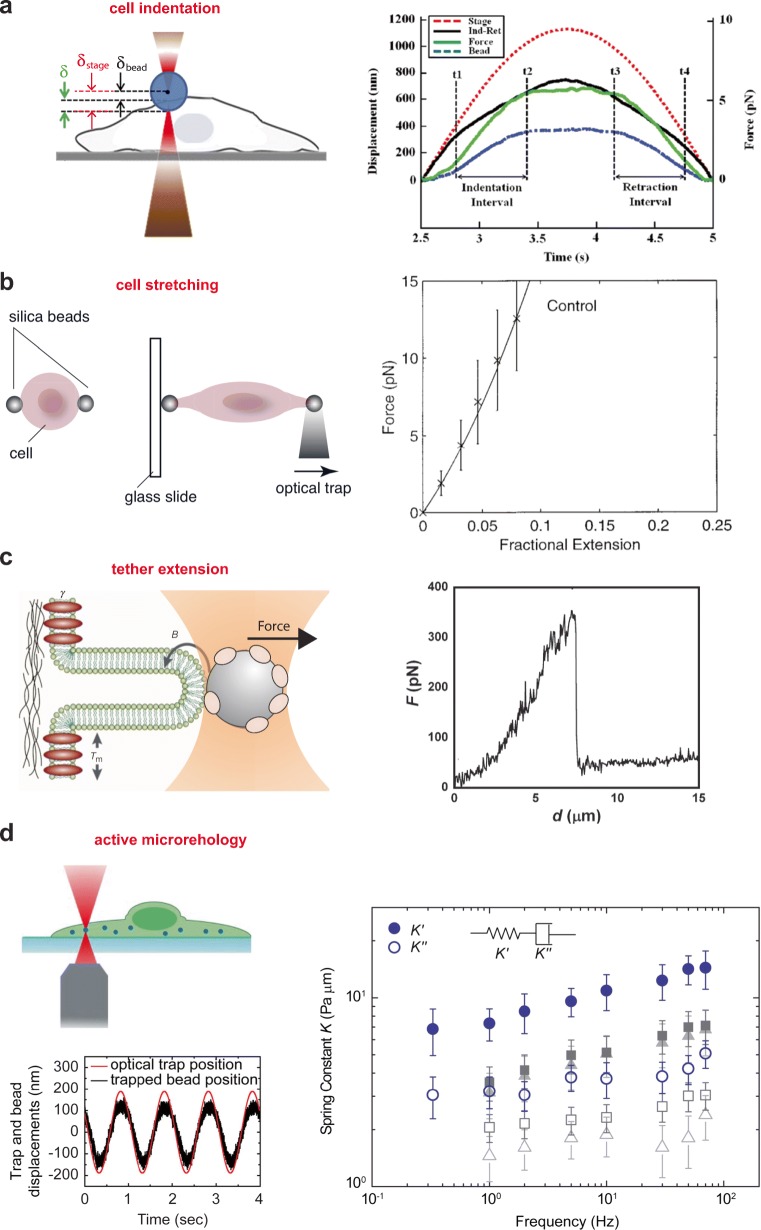
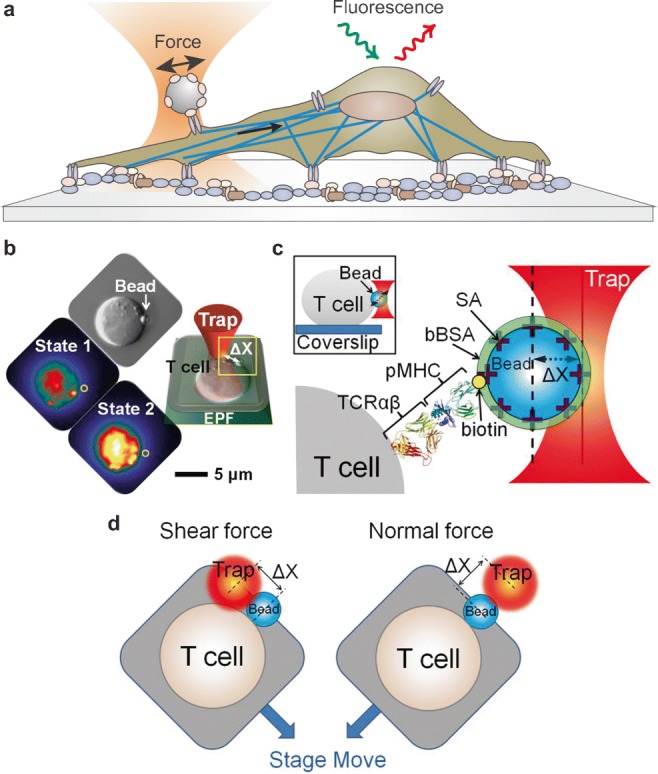
The invention of optical tweezers more than three decades ago has opened new avenues in the study of the mechanical properties of biological molecules and cells. Quantitative force measurements still represent a challenging task in living cells due to the complexity of the cellular environment. Here, we review different methodologies to quantitatively measure the mechanical properties of living cells, the strength of adhesion/receptor bonds, and the active force produced during intracellular transport, cell adhesion, and migration. We discuss experimental strategies to attain proper calibration of optical tweezers and molecular resolution in living cells. Finally, we show recent studies on the transduction of mechanical stimuli into biomolecular and genetic signals that play a critical role in cell health and disease.

Keywords: adhesion; cell mechanics; force spectroscopy; mechanotransduction; molecular motors; optical tweezers.


Figures

Fig. 1
Fig. 1
Calibration of optical tweezers inside and outside a cell. a Sketch of a bead trapped by optical tweezers outside a cell. b Diagram representing the forces acting on a trapped bead outside a cell surrounded by water solution (ktrap is the optical tweezers stiffness, γH20 is the viscous drag coefficient of the water solution). c Schematic of a trapped bead inside the cytoplasm responding to sinusoidal oscillations. d Diagram of forces acting on a bead inside a cell (ktrap is the optical tweezers stiffness, kcyt and γcyt are, respectively, the stiffness and viscous drag coefficient of the cytoplasm). e Calibration of optical tweezers inside living cells is made by global fitting forced oscillation (left panels) and thermal motion (right panel) of trapped phagocytosed beads. Thermal motion fitting is limited to frequencies > 300 Hz because spontaneous fluctuations below 300 Hz indicate biological processes in the cell and vibrations of the stage due to the coupling of the stage and the bead in the cytoplasm. Bead motion in the cell is subdiffusive resulting to a slope < 2 (red line denotes a slope of 2). Inset: Spectra from a bead immersed in water (reproduced from Hendricks et al. 2012)
Fig. 2
Fig. 2
Measuring molecular bond strength on the cell membrane. a Schematic of an optically trapped bead covered by ligands forming a bond with receptors on the cell membrane. The optical tweezers apply a force to probe the rupture force of the molecular bond. b Representation of the experimental setup having a trapped sphere in the vicinity of a live cell and the corresponding acquired force signal in real-time. The experiment proceeds in four steps, as indicated by the corresponding numbers and arrows: (1) cell moves towards the bead; (2) cell membrane interacts with the trapped bead; (3) cell moves away until rupture is observed; (4) bead position is restored in the trap and cell continues to move away. Force is calculated by the trap stiffness and bead displacement (reproduced from Shergill et al. with permission from Dev. Cell.). c Example of a rapture force versus loading rate plot for the A1/GB Ib-IX interaction (reproduced from Arya et al. with permission from Biophys. J.)
Fig. 3
Fig. 3
Measuring active forces on the cell membrane. a Schematic of an optically trapped ligand-coated bead applying force while in contact with cell’s lamellipodia. b Initial adhesion between a ligand-coated bead and integrin receptors. c Focal complexes are formed when an external force is applied by the optical trap (b and c are reproduced from Galbraith et al. with permission from J. Cell Biol.). d, e Experimental data of FN7-10–coated bead displacement as a function of time and sequential images of the cell during experiments. Shaded areas indicate time intervals in which the trap was turned on. Traces are from separate experiments: d the trap was turned off 1.5 s after initial bead–cell contact (shaded area labeled [a]). Re-trapping immediately moved the bead back towards the trap center (shaded area labeled [b]); e the trap remained on (shaded area labeled [a]) until the bead escaped its radius of action (about 2.0 μm away from its center) at 12 s. Re-trapping did not move the bead back to the trap center (shaded area labeled [b]) (d and e are reproduced from Choquet et al. with permission from Cell)
Fig. 4
Fig. 4
Measuring active forces inside living cells. a Schematic of a trapped vesicle inside a cell by optical tweezers. b Close up representation of the trapped vesicle inside the cell showing cytoskeletal filaments and motor proteins (drawing not to scale). c, d Stepping trajectories of lipid droplets under known force load: c Outward-directed trajectory with stall force of 3.9 pN. d Inward-directed trajectory with stall force of 3.6 pN. e Pairwise distance histogram calculated from c after low pass filtering. f Step size histogram for all high-resolution trajectories. (c, d, e, and f are reproduced from Sims et al. 2009 with permission from Chemphyschem.)
Fig. 5
Fig. 5
Measuring the mechanical properties of cells. a (left) Schematic of the experimental procedure where the stage is displaced upwards by δstage so the cell and bead can interact. The bead is displaced by a distance δbead while it is indenting the cell by δ = δstage − δbead; (right) Indentation and retraction experiment, where the stage is moved sinusoidally against the cell membrane. Stage displacement (red), measured bead displacement (blue), the calculated force (green), calculated indentation (black) (reproduced from Yousafzai et al. with permission from Opt. Lasers Eng.). b (left) Schematic of a rounded red blood cell being stretched by optical tweezers. The two beads are bound non-specifically to the erythrocyte. One bead is deforming the cell by moving the trap while the other is fixed on a stationary glass surface (reproduced from Van Vliet et al. with permission from Acta Mater.). (right) Force-extension curve obtained from experiments on sets of red blood cells (reproduced from Sleep et al. with permission from Biophys. J.). c (left) Diagram illustrating tether formation. The membrane–cytoskeleton adhesion energy, γ, and the tension in the bilayer plane, Tm, must be overcome by the optical tweezers in order to bend the membrane and form a tether. B is the membrane bending stiffness (modified from Sheetz et al. 2001 with permission from Nat. Rev. Mol. Cell Biol.). (right) Force-extension curve of tether extraction experiment on fibroblast NIH 3 T3 cells (reproduced from Pontes et al. with permission from Biophys. J.). d (left) Schematic of the experimental setup used to measure the cytoplasm viscoelastic properties and typical displacements of the trapped bead while the optical trap is oscillating at 1 Hz. (right) Spring constant K of the cytoplasm measured by active microrheology using optical tweezers. Solid symbols represent the intracellular elastic stiffness which dominates over the dissipative resistance (open symbols). Blue circles, gray squares, and light gray triangles represent untreated, 10 mM blebbistatin-treated, and ATP-depleted A7 cells, respectively (reproduced from Guo et al. with permission from Cell)
Fig. 6
Fig. 6
Probing mechanotransduction signals in living cells. a Combination of optical tweezers and fluorescence imaging to detect intracellular signals induced by an external force applied on the cell membrane. b Mechanical force F = − k·Δx is applied on individual T lymphocytes using an optical trap. The ligand-coated bead abutting the T cell surface is shown in the DIC image indicated by a white arrow and the fluorescence image as a gray sphere and yellow circle. The optimal force along the T cell surface triggers a rise in free Ca2+ shown as an increase in yellow intensity (state 2) compared with the initial state of the same T cell (state 1). EPF, epifluorescence. c Cartoon detailing the bead–cell contact interface as expanded from the yellow box in b. Optical traps are used for application of force to a streptavidin (SA)-coated polystyrene bead arrayed with specific biotinylated TCRαβ ligand (pMHC) and then saturated with bBSA to prevent potential nonspecific streptavidin binding to cells. (Inset) Side view of a bead-attached T cell. d Cartoon showing optimal shear and normal force directions of the bead relative to the cell (b–d are reproduced from Feng et al. 2017)

References

    1. Abbondanzieri EA, Greenleaf WJ, Shaevitz JW, Landick R, Block SM. Direct observation of base-pair stepping by RNA polymerase. Nature. 2005;438(7067):460–465. - PMC - PubMed
    1. Agrawal R, Smart T, Nobre-Cardoso J, Richards C, Bhatnagar R, Tufail A, Shima D, Jones PH, Pavesio C. Assessment of red blood cell deformability in type 2 diabetes mellitus and diabetic retinopathy by dual optical tweezers stretching technique. Sci Rep. 2016;6(May 2015):1–12. - PMC - PubMed
    1. Almonacid M, Ahmed WW, Bussonnier M, Mailly P, Betz T, Voituriez R, Gov NS, Verlhac M-H. Active diffusion positions the nucleus in mouse oocytes. Nat Cell Biol. 2015;17(4):470–479. - PubMed
    1. Arya, Maneesh, Bahman Anvari, Gabriel M. Romo, Miguel A. Cruz, Jing-Fei Dong, Larry V McIntire, Joel L. Moake, and José A. Ló pez (2002) “Ultralarge multimers of von Willebrand factor form spontaneous high-strength bonds with the platelet glycoprotein Ib-IX complex: studies using optical tweezers” - PubMed
    1. Arya M, Kolomeisky AB, Romo GM, Cruz M a, López J a, Anvari B. Dynamic force spectroscopy of glycoprotein Ib-IX and von Willebrand factor. Biophys J. 2005;88(6):4391–4401. - PMC - PubMed

LinkOut - more resources