Extracting Voxel-Based Cartilage Relaxometry Features in Hip Osteoarthritis Subjects Using Principal Component Analysis
- PMID: 31614057
- PMCID: PMC9744136
- DOI: 10.1002/jmri.26955
Extracting Voxel-Based Cartilage Relaxometry Features in Hip Osteoarthritis Subjects Using Principal Component Analysis
Abstract
Background: MRI-based relaxation time measurements provide quantitative assessment of cartilage biochemistry. Identifying distinctive relaxometry features in hip osteoarthritis (OA) might provide important information on regional disease variability.
Purpose: First, to incorporate fully automatic voxel-based relaxometry (VBR) with principal component analysis (PCA) to extract distinctive relaxometry features in subjects with radiographic hip OA and nondiseased controls. Second, to use the identified features to further distinguish subjects with cartilage compositional abnormalities.
Study type: Cross-sectional.
Subjects: Thirty-three subjects with radiographic hip OA (20 males; age, 50.2 ± 13.3 years) and 55 controls participated (28 males; 41.3 ± 12.0 years).
Sequence: A 3.0T scanner using 3D SPGR, combined T1ρ /T2 , and fast spin echo sequences.
Assessment: Pelvic radiographs, patients' self-reported symptoms, physical function, and cartilage morphology were analyzed. Cartilage relaxation times were quantified using traditional regions of interest and VBR approaches. PCA was performed on VBR data to identify distinctive relaxometry features, and were subsequently used to identify a subgroup of subjects from the controls that exhibited compositional abnormalities.
Statistical tests: Chi-square and independent t-tests were used to compare group characteristics. Logistic regression models were used to identify the possible principal components (PCs) that were able to predict OA vs. control classification.
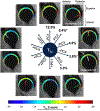
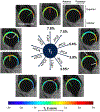
Results: In T1ρ assessment, OA subjects demonstrated higher T1ρ values in the posterior hip region and deep cartilage layer when compared with controls (P = 0.012 and 0.001, respectively). In T2 assessment, OA subjects exhibited higher T2 values in the posterior hip region (P < 0.001). Based on the PC score classification, 16 subjects without radiographic evidence of OA demonstrated relaxometry patterns similar to OA subjects, and exhibited worse physical function (P = 0.003) and cartilage lesions (P = 0.009-0.032) when compared with the remaining controls.
Data conclusion: The study identified distinctive cartilage relaxometry features that were able to discriminate subjects with and without radiographic hip OA effectively.
Level of evidence: 1 Technical Efficacy Stage: 2 J. Magn. Reson. Imaging 2020;51:1708-1719.
Keywords: T1ρ and T2; hip osteoarthritis; magnetic resonance imaging; principal component analysis; voxel-based relaxometry.
© 2019 International Society for Magnetic Resonance in Medicine.
Figures


References
-
- Prevalence of disabilities and associated health conditions among adults--United States, 1999. MMWR Morb Mortal Wkly Rep 2001;50:120–125. - PubMed
-
- Quintana JM, Arostegui I, Escobar A, Azkarate J, Goenaga JI, Lafuente I. Prevalence of knee and hip osteoarthritis and the appropriateness of joint replacement in an older population. Arch Intern Med 2008;168:1576–1584. - PubMed
-
- Amin S, LaValley MP, Guermazi A, et al. The relationship between cartilage loss on magnetic resonance imaging and radiographic progression in men and women with knee osteoarthritis. Arthritis & Rheumatism 2005;52:3152–3159. - PubMed
Publication types
MeSH terms
Grants and funding
LinkOut - more resources
Full Text Sources
Research Materials

